SPY Market Preview for Monday, September 8
Price Action & Market Structure
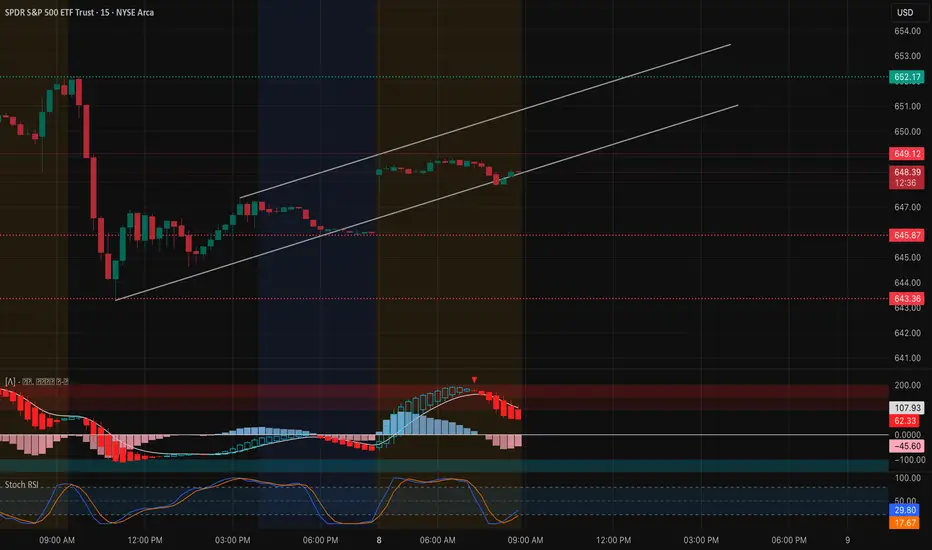
* SPY is trading around 648.4, consolidating inside a rising channel after bouncing from 644 HVL support.
* Momentum has slowed after rejecting near 649–650, but structure is still constructive as long as price holds above 646–645.
* Market bias remains neutral-to-bullish unless 644 breaks.
Key Levels
* Resistance (Upside Caps):
* 649–650 → Immediate resistance zone.
* 651–652 → Strong Call Wall / Gamma resistance.
* 653–655 → Higher extension levels.
* Support (Downside Floors):
* 646.0 HVL → Key balance level.
* 645.0–644.0 → Strong support cluster.
* 643.0–640.0 → Put Walls / deeper cushion.
Options Sentiment (GEX & IV)
* GEX: Bearish skew, with Puts 117.6% dominating positioning.
* IVR: 11.6, relatively low → options market not expecting extreme moves.
* Gamma Walls:
* 652–653 = Strong Call resistance.
* 646–644 = Strong support zone.
Indicators
* MACD (15m): Rolling bearish after early strength, showing momentum fading.
* Stoch RSI: Resetting lower, oversold zone nearing, could support bounce if 646 holds.
Scenarios for Today
Bullish Case (if 646–645 holds):
* Defend 646–645 support, push through 649–650.
* Targets: 651–652 → 653–655.
Bearish Case (if 646 fails):
* Breakdown under 646–645, move into 644 HVL.
* If 644 breaks → accelerated downside toward 643–640.
Trading Thoughts
* Longs: Buy dips near 646–645, targeting 650–652, stops below 644.
* Shorts: Fade rejection at 650–652, stops above 653.
* Stops:
* Longs → below 644.
* Shorts → above 653.
Summary
SPY sits at a pivotal mid-zone (646–650). Holding this range favors upside continuation into 652–655, but options positioning (Put heavy) warns of downside hedging pressure. A clean break under 646–644 flips momentum bearish into 640.
⚠️ This analysis is for educational purposes only, not financial advice. Always manage risk properly.
SPY trade ideas
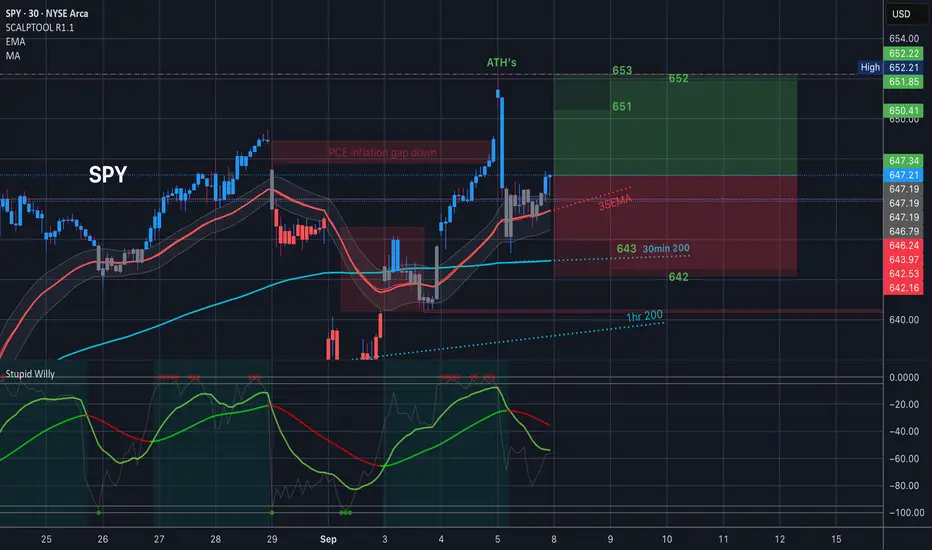
$SPY $SPX Analysis, Key Levels & Targets 9.8.25
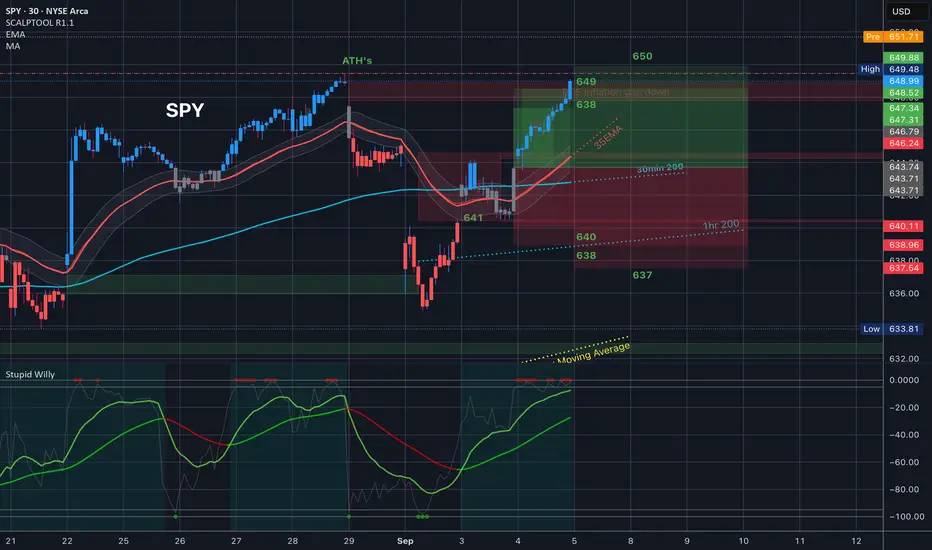
Alright, guys… it’s time to get to it again. The trading range for tomorrow has ATH’s at the extreme top of the trading range, then under that the 35EMA and then 30min 200MA. That’s it. That is all you need to know.
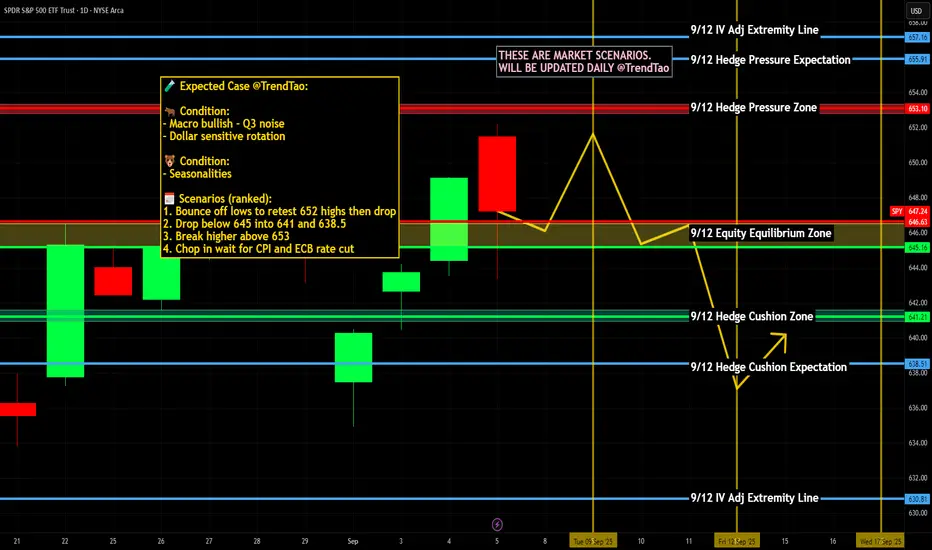
Weekly $SPY / $SPX Scenarios — Sept 8 → Sept 12, 2025🔮 Weekly AMEX:SPY / SP:SPX Scenarios — Sept 8 → Sept 12, 2025 🔮
🌍 Themes
🚩 Inflation week: PPI (Wed), CPI (Thu) drive the Fed path.
🏦 Fed watch: Data into the Sept FOMC; ECB decision adds global spillovers.
💬 Sentiment wrap: UMich (Fri) gives the consumer read.
📊 Key Data & Events (ET)
Mon 9/8
⏰ 3:00 PM — Consumer Credit (G.19)
Tue 9/9
⏰ 6:00 AM — NFIB Small Business Optimism (Aug)
Wed 9/10
⏰ 🚩 8:30 AM — PPI (Aug)
Thu 9/11
⏰ 🚩 8:30 AM — CPI (Aug)
⏰ 🚩 8:30 AM — Initial Jobless Claims (weekly)
⏰ 8:15 AM — ECB Rate Decision (global cross-asset driver)
Fri 9/12
⏰ 10:00 AM — UMich Consumer Sentiment (Prelim, Sep)
⚠️ Disclaimer: Educational/informational only — not financial advice.
📌 #trading #stockmarket #SPY #SPX #CPI #PPI #Fed #ECB #jobs #consumer #bonds #Dollar
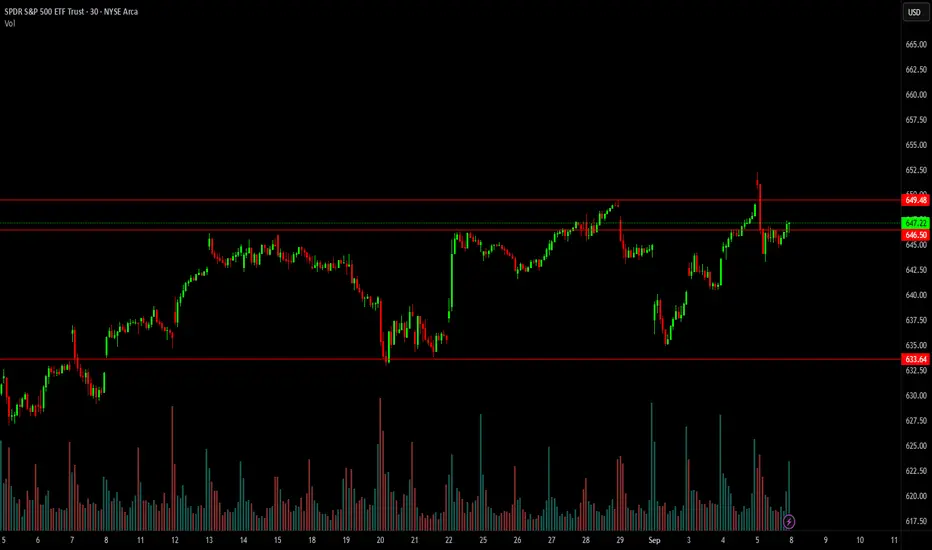
$SPY Watchlist Ticker: SPY (SPDR S&P 500 ETF Trust)
All-Time High Reference: SPY hit a record close at $649.12 on Sept 4, 2025, with an intraday peak around $652.21. That’s the level we’re watching.
Catalysts on Deck
Retail Sales (Mon, 6/17): Strong numbers = more fuel for the bulls. Weak print = pressure on consumer strength, could weigh on SPY.
Unemployment Claims (Tue, 6/18): Clean data here can push risk-on. A spike in claims could bring some hesitation into the market.
Why We Don’t Trade CHOP
If you zoom out to the 30m–1h, price has just been moving sideways. No clean trend, no conviction. Trading that kind of action is low probability:
Breakouts fail more often than not.
Noise > signal.
Risk/reward doesn’t make sense without direction.
Bottom line: we wait for momentum. If there’s no momentum, we don’t force it.
Game Plan
Bullish setup: Gap filled and bounced at 635.01. As long as we hold trend, look for calls back toward ATH. A clean break above ~652 with volume = room to run 655–660+.
Bearish setup: Only if we see a hard rejection near highs. Watch 635 as first support, then 620 if things pull back.
Bias remains bullish. We’re in an uptrend, we’re near highs, and catalysts this week will decide if we get continuation or stall out. Stay patient, let the levels play out.
SPY A Fall Expected! SELL!
My dear friends,
Please, find my technical outlook for SPY below:
The instrument tests an important psychological level 647.22
Bias - Bearish
Technical Indicators: Supper Trend gives a precise Bearish signal, while Pivot Point HL predicts price changes and potential reversals in the market.
Target - 642.31
Recommended Stop Loss - 649.96
About Used Indicators:
Super-trend indicator is more useful in trending markets where there are clear uptrends and downtrends in price.
Disclosure: I am part of Trade Nation's Influencer program and receive a monthly fee for using their TradingView charts in my analysis.
———————————
WISH YOU ALL LUCK
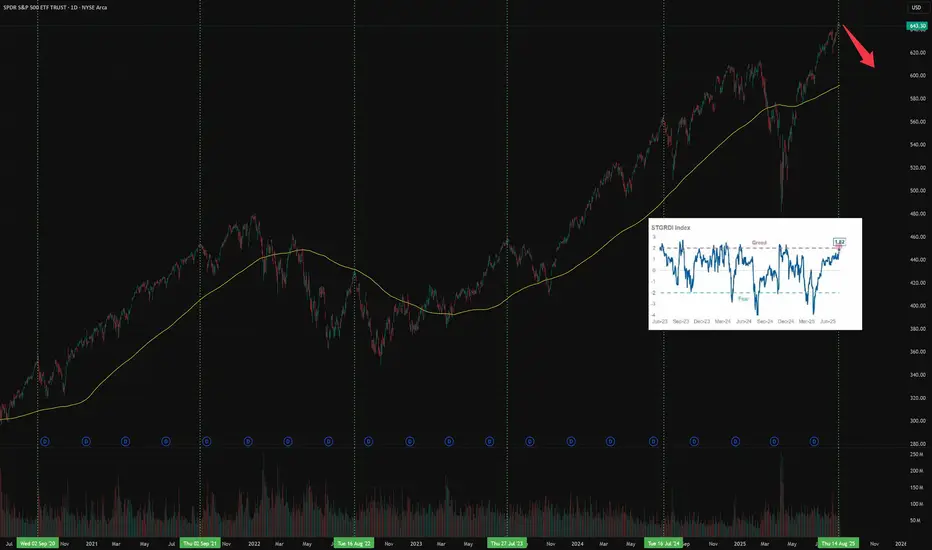
Stock Market is in Risk OnSubscribe and don't miss next ideas
The US market, as well as some assets, is in a risk-on mode.
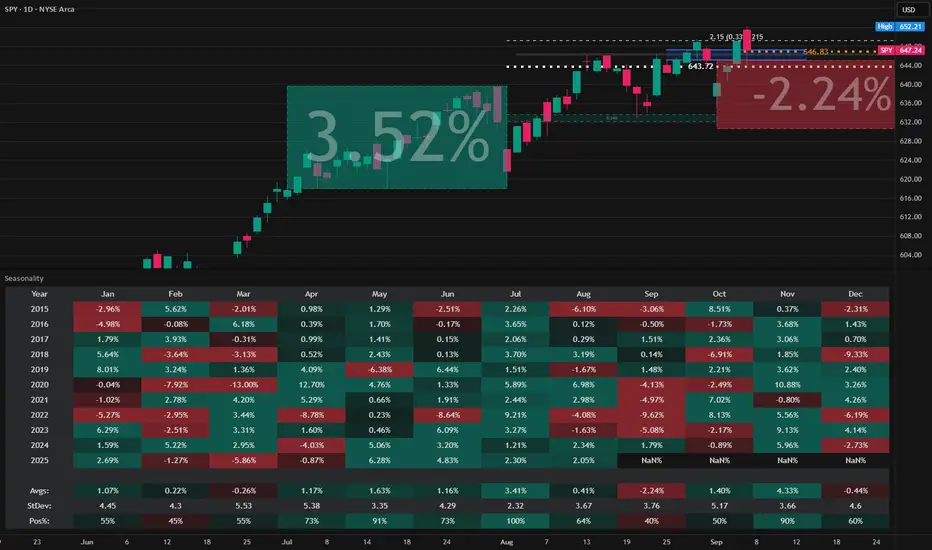
Most assets have their own seasonality.
The chart above shows one of them:
In recent years, in the period July-September, a correction began on the US market.
A number of macro indicators also speak in favor of a correction and that it is overdue.
Risk appetite according to Morgan Stanley research has reached a historical maximum
Although seasonality does not guarantee a correction right here and now, but at least it gives reason to think about reducing long positions
SPY Outlook – Key Levels & ProbabilitiesSPY Outlook – Key Levels & Probabilities
SPY is sitting on a rising trendline and testing the 647 zone near the .618 retracement. Market structure shows a tug-of-war between bulls holding trend support and sellers guarding supply overhead.
🔑 Levels to Watch
Support: 645–643 (trendline + Fib cluster), deeper at 639.3
Resistance: 651–653 supply zone, breakout target 658 (Fib extension)
Liquidity Pools: 630–628 if support fails
📊 Probabilities
Bullish Case (60%) → Hold above 643 → upside push into 652–658
Bearish Case (40%) → Break below 643 → drop toward 639, possibly 630–628
🎯 Trade Map
Long setup: Enter near 645–643, stop below 641, targets 652 → 658
Short setup: Fade rejection at 652–653, stop above 654, target 639
⚡Bias remains bullish while above 643. A clean break below flips the script bearish.
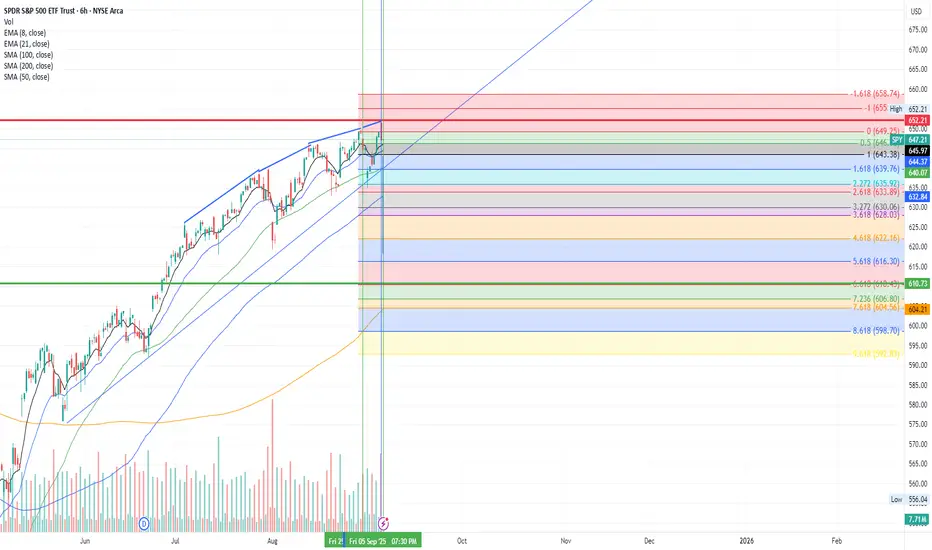
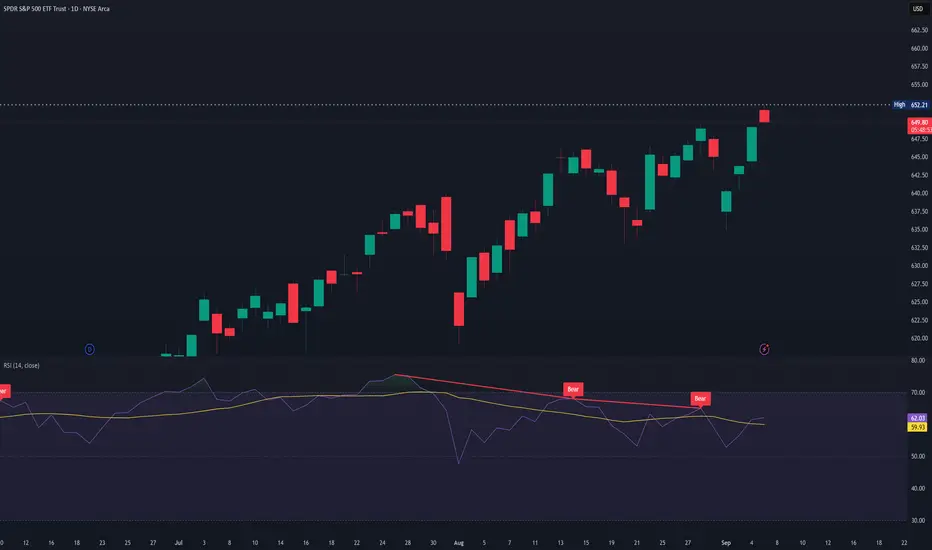
$AMEX:SPY Several Back to Back DivergenciesMany sequential divergencies on several of the higher timeframes across all 5 of the indicators i use. Theres never a "For Sure" thing in the market. But one would think these can't go unanswered for much longer. I took a PUT position on Friday after i received my buy signal.
Target 610 with a tight stop of a close above 652.21
Stay Disciplined
Plan your trade and then trade your plan
(My opinion only and Not Financial advice)
SPY: Week of Sept 8 and Month of SeptHey everyone,
Been a minute!
I am back with an analysis for the week and month!
Hope you enjoy and safe trades as always!!

$SPY Trend Marked to Neutral with Possible PullbackWEEKLY RECAP:
JOLTS data came in softer than expected, signaling cooling labor demand and providing hopes for a potential Federal rate cut.
The jobs report showed signs of labor market weakness causing Treasury yields to fall. The dollar weakened in response.
Speculation about Fed easing for potential rate cuts and whether to expect a soft landing or deeper economic slowdown.
The U.S. stock market delivered mixed results.
S&P 500 slightly edged up approximately 0.3% from last week.
Nasdaq edge up approximately 1.1% with strength in tech.
The Dow slipped approximately 0.5%
On Friday AMEX:SPY , NASDAQ:NDAQ , AMEX:DIA had opened up followed by some heavy selling.
The market tried to really towards the end of Friday.
My view is that there is investor uncertainty
S&P 500 TECHNICAL ANALYSIS:
Despite AMEX:SPY edging up for the week, investor uncertainty remains with Friday closing on a wide range red candle and above average volume.
The Friday candle formed a Dark Cloud Cover (DCC) on the Daily chart. Note that some technicians require the candle to push more than 50% into the body. While Friday's candle had a wide red body on above average volume, it only thrusted into the body of Thursday's candle by around 40%. Discretion is required. Everything is open for interpretation. There are no hard rules, except for good risk management, and knowing when to trade, and when not to trade.
The Dark Cloud Cover candle strategy is said to have approximately a 60% win rate as per wrtrading data, depending on confirmation and market context.
The Bears won on Friday but the Bulls put up a fight rallying into the close and forming a lower shadow. This is a strictly a personal view, but a lower shadow has much more significance near the bottom of a trend, rather than near the top. Had the rally been stronger a Hanging Man candle would have been formed, which is another candle considered to be bearish.
Make no mistake, whether bullish or bearish, the bears are present.
For the type of trader I am, I have the trend is marked as Neutral until support is broken. There still is considerable support.
Some technicians may see the lower shadow and say Bulls are present, while others will look at it and say it's simply short sellers covering their positions to take profit.
September has historically been the 2nd worst month of the year, for a 10-year lookback. For these reasons my bias is leaning towards a deeper pullback, which would be a nice Bull setup for a Santa rally for the stronger months of October, November, and December.
For these reasons I would expect some volatility next week, but have the trend marked as Neutral until further confirmation, but with a Bearish bias for a pullback.
This doesn't mean I think we're heading for a Bear market. It merely means the market moves up & down in waves and I'm leaning towards a pullback.
A question you should ask yourself: If I'm an investor and looking at AMEX:SPY , do I want to buy up here?
FORECAST
I would expect continued volatility as markets weigh the likelihood of a Fed rate cut amid cooling inflation and labor softness. Historically one of the weakest months for equities, September may still offer opportunities—especially in small-cap and value stocks, which remain undervalued and have recently shown signs of strength. Sectors like healthcare, communications, and real estate are also expected to outperform as investors rotate away from overextended tech names.
DISCLOSURE
All information shared is entirely hypothetical and open to interpretation. One analyst may view the market through a particular lens, while another may see it differently—based on unique strategies, trade durations, entry/exit points, and sources. In other words, context matters. Past performance does not guarantee future results. Trading always involves risk, so please do your own research and form your own opinions. What works for Trader A might not work for Trader B.
Happy Trading!
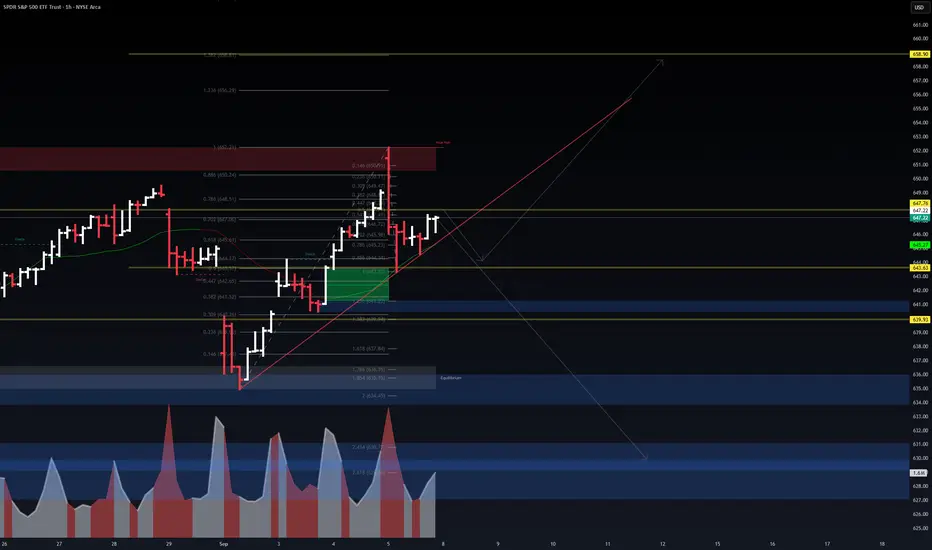
WaverVanir Market Intelligence – SPY Outlook🛰️ WaverVanir Market Intelligence – SPY Outlook
Catalyst:
September rotation into risk assets ahead of CPI/Fed cycle.
Strong liquidity injections in last sessions visible in volume profile.
Market seeking liquidity above prior highs (651–653) before establishing next trend leg.
Analysis (15m–1h Structure):
Current price: 647.2 (holding above equilibrium ~646).
Liquidity Pool Above: 651–653 (void high, premium zone).
Liquidity Pool Below: 644 → 636 (discount demand zones).
Fibonacci Map:
Retracements: 648.5 (0.786) → 650.2 (0.886).
Extensions: 658 (1.272) → 662 (1.618).
Market Mechanics:
Break of structure (BOS) confirmed, retest at equilibrium.
Volume spikes indicate institutional positioning.
Thin liquidity at 646–648 → easy to sweep higher.
Probabilities (WaverVanir DSS Projection):
📈 Bullish Path (60%): Price targets 651–653 liquidity sweep, extension to 658–662 if absorption holds.
📉 Bearish Path (30%): Failure to hold 646 → drawdown into 644 equilibrium → deeper sweep at 636–632.
⚖️ Neutral Chop (10%): Sideways between 646–650 before CPI/Fed clarity.
Strategic Note:
While SPY remains above 646 equilibrium, probability favors a liquidity grab to 653 and possible extension to 658+. A breakdown below 646 flips bias into deeper demand hunts.
🔮 WaverVanir Protocol View:
Capital flow remains tilted bullish into liquidity, but with strong volatility clusters — risk-managed entries around equilibrium (646–647) give best R:R.

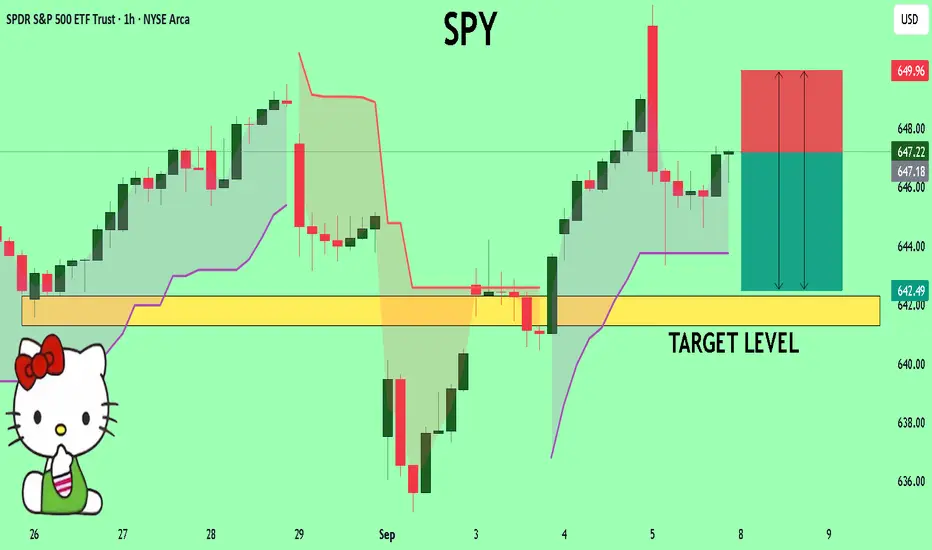
SPY: Short Trade with Entry/SL/TP
SPY
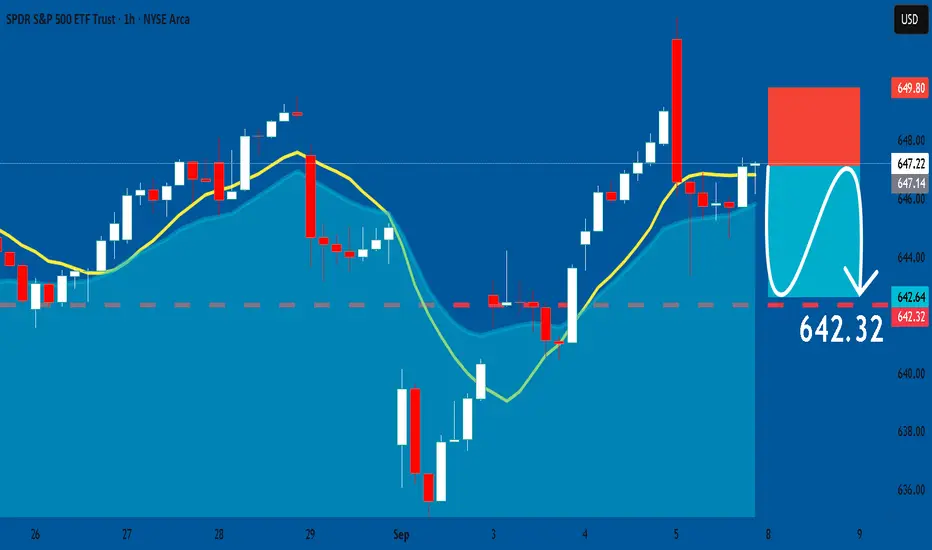
- Classic bearish pattern
- Our team expects retracement
SUGGESTED TRADE:
Swing Trade
Sell SPY
Entry - 647.14
Stop - 649.80
Take - 642.32
Our Risk - 1%
Start protection of your profits from lower levels
Disclosure: I am part of Trade Nation's Influencer program and receive a monthly fee for using their TradingView charts in my analysis.
❤️ Please, support our work with like & comment! ❤️
swing short Upcoming data is showing a move to safer assets...Data being war threat, job data, and interest rate decision.

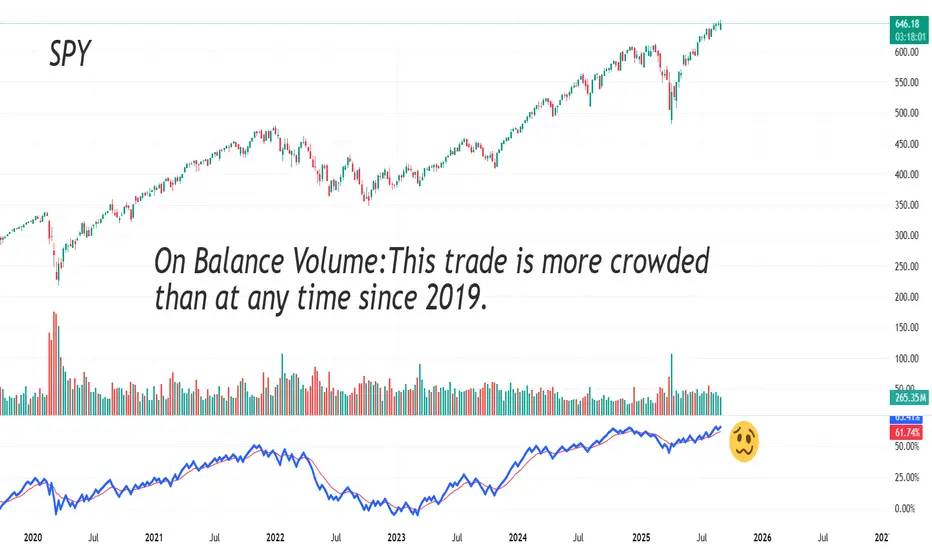
This trade is more crowded than at any time since 2019.On-balance volume keeps rising, but at a slowing pace. Along with a small bearish divergence, this shows few new entrants. Still, they’re all bullish. And if you look at the OBV level, this trade has never been so crowded since, at least, 2019.
The market can stay irrational longer than… yes, we all know the line. But when this one falls, it will look like a giant avalanche.
$SPY Intraday ResistanceThere is thick diatonic resistance right below VWAP at 647.85. Next diatonic level above will be 649's.

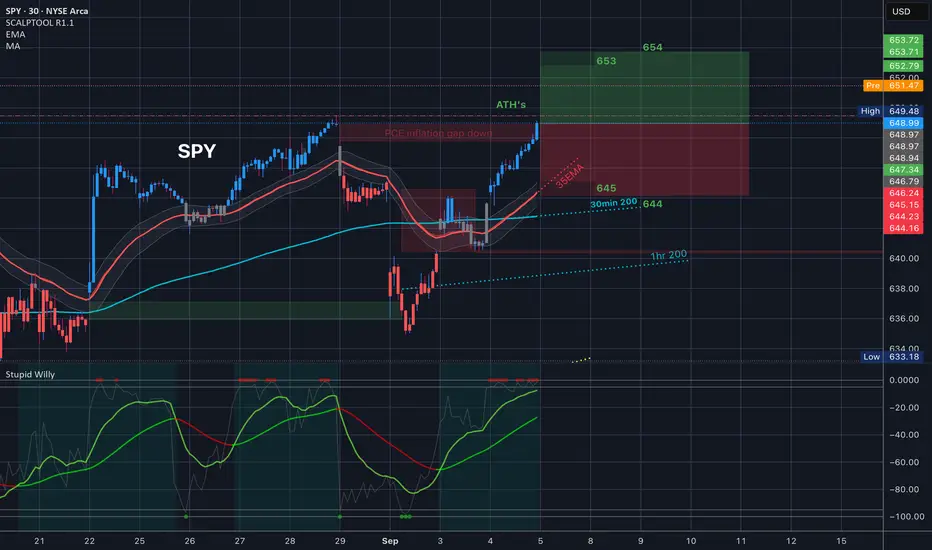
$SPY $SPX Analysis, Key Levels & Targets 9.5.25
Alright, the only two levels in todays range are the 35EMA and ATH’s. Always know where the 35EMA is - its a magnet. Let’s go
How Many Indicators Are Too Many?
I have been trading for around 5 years and in that time, I lost money and hope more often than I can count. A common coping strategy I use when in a time of loss is to strip all the "completely useless" indicators from my charts. And 6 months later, I have more than I had before.
Recently, I have actually started to earn small amounts of money from the markets consistently but my indicator problem persists. The picture above is an example of just some of the indicators I use. So now I ask the question,
-How many indicators are too many?
There really is not an answer despite what those on reddit might tell you. I seem to always have this fantasy that I will find the perfect chart set-up with all my indicators telling me just what I want to know. And of course TradingView has Pinscript which only makes my habit worse by allowing me to create exactly what I want.
As I was thinking about chart layouts this morning I came to a conclusion that my trading will always be evolving and the way in which I view the visual output of markets will change as well. There will most likely never be a chart set-up that I will use for the next 20 years. Even when I find my edge, the process of trading will still evolve. My "edge" will never be an indicator or a set of indicators .
So I wrote this to try and help those that are experiencing the same dilemma. Just know that you are not alone in your obsession with finding that perfect layout. Add 100 indicators to your chart and then delete them all when you feel they don't belong. You will never find that perfect indicator but but neither will you stop looking. It may seems like it is all a waste of time but I assure you that everything you experience in trading is worth it and progress does happen .
Safe Trading, Frank
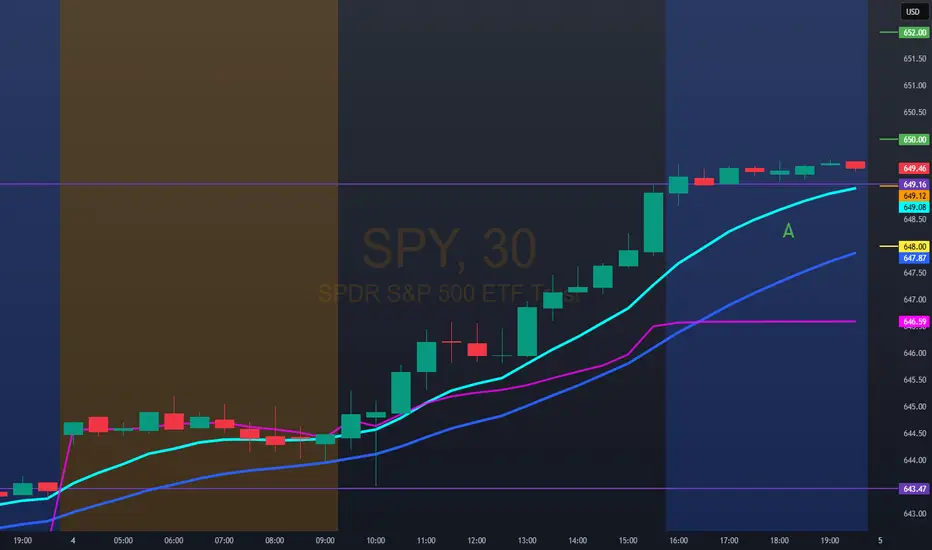
SPY Play 9/5/25After weak job report, Stock surge. SPY is in up. Be patient and allow the market to confirm it is still going higher. Don't guess - react. POI is at 650.51. You can wait until pullback to that and see if it holds for entry or use PMH. The range is 648.44-652.10. But if you wait the first 15 mins
PMH 652.10 Break-Retest and Hold = CALLS
PML 648.44 Break -Retest - Hold = PUTS
PDH 649.09
PDL 643.74
TP1 653.30
TP1 647.76
#YouGotOptions
"Discipline is the bridge between vision and victory. God gives the vision, but it's your daily obedience that builds the bridge."

$SPY $SPX $ES_F
Tomorrow was a HUGE move all the way to fill the PCE inflation gap and closed just under ATH’s
Since we made new ATH’s in premarket, expect a pullback today. This is yesterdays chart played out and today’s is coming out in just a few mins, but definitely keep that 650 level in mind today.
SPY Sept 5 Gameplan
Alright here’s what I’m seeing:
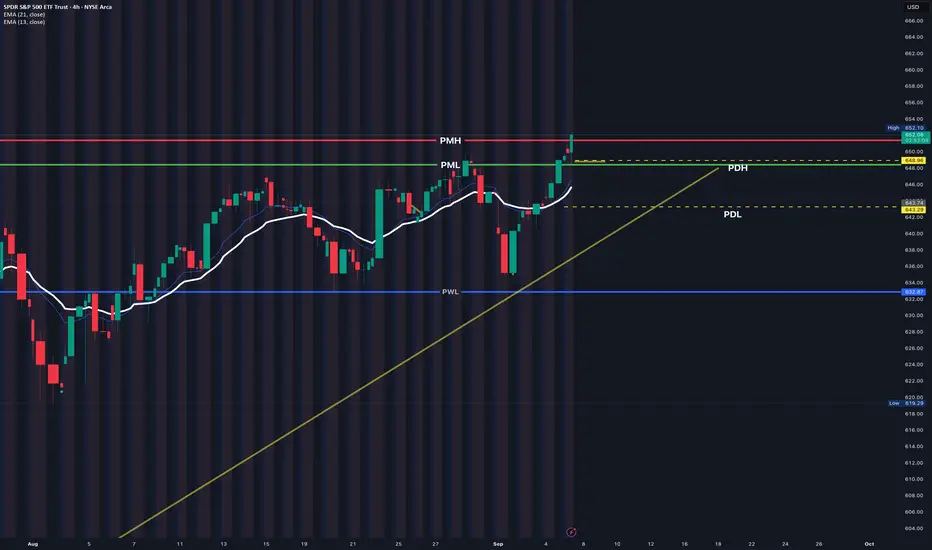
On the 4H chart SPY still holding a bull flag / ascending triangle vibe. VIX is under 15, 10-year yields are dumping, and DXY broke down — that all leans risk-on. Options flow shows big open interest stacked around 645–647, so that area is like a magnet.
I think price probably **chops around 648 first, then bounces and tries for 655+.
3 Scenarios
🟢 Bullish:
* Hold above 648 → reclaim 651 → run toward 655–658, maybe stretch 662.
* Confirmed if tech leaders (MSFT, META, AMZN) keep pushing.
Sideways / Chop:
* Stuck between 648–651, fakeouts both ways until volume picks a side.
* Basically consolidation around that option wall.
🔴 Bearish:
* Lose 648 with momentum → flush to 643–640.
* Would need DXY/yields to reverse back up or VIX to spike.
🎯 Key Levels
* PMH 651.30
* PDH 648.06
* PDL 643.51
* Option cluster: 645–647
* Targets: 655 → 658 → 662
💡 My bias → watch the 648 zone. If buyers defend it, I’m leaning long into that 655+ move.
$SPY / $SPX Scenarios — Friday, Sept 5, 2025🔮 AMEX:SPY / SP:SPX Scenarios — Friday, Sept 5, 2025 🔮
🌍 Market-Moving Headlines
🚩 Jobs Friday = make or break. Nonfarm Payrolls, unemployment, and wages will lock in Fed expectations into September.
📉 Positioning light ahead of NFP — futures choppy as traders square books.
💬 Consumer sentiment wraps the week — expectations on inflation and spending will color the tape.
📊 Key Data & Events (ET)
⏰ 🚩 8:30 AM — Nonfarm Payrolls (Aug)
⏰ 🚩 8:30 AM — Unemployment Rate (Aug)
⏰ 🚩 8:30 AM — Average Hourly Earnings (Aug)
⏰ 10:00 AM — Wholesale Trade (Jul)
⏰ 10:00 AM — UMich Consumer Sentiment (Final, Aug)
⚠️ Disclaimer: Educational/informational only — not financial advice.
📌 #trading #stockmarket #SPY #SPX #NFP #jobs #labor #Fed #economy #bonds #Dollar

Hello Trader, SPY for tomorrow: 09/05/25Double top 649.00, bullish entry 650.00/652.00, possible target 655.00/656.00
Bearish entry: 648.00/649.00, technical potential, could be a possible rebound
SPY Will Keep Growing! Buy!
Hello,Traders!
SPY is trading along the
Rising support line and
The index made a rebound
From the rising support
So we are bullish biased
And we will be expecting
A further bullish move up
Buy!
Comment and subscribe to help us grow!
Check out other forecasts below too!
Disclosure: I am part of Trade Nation's Influencer program and receive a monthly fee for using their TradingView charts in my analysis.
