SPY WEEKLY LIVE RECORDED 21st AUG 2025This is the price action of SPY. I have clearly discussed the levels where charts are showing us the probability of buying levels.
If you have any doubts, feel free to leave a comment or DM me.
NOTE:FORGET ABOUT TRADING & FOCUS ON PROTECTING YOUR CAPITAL
SPY trade ideas

August 21st 2025 - Testing New all time high res on S&P 500 SPYS&P 500 SPY ... is testing the new all time high at 646.19 ..... bullish channel support at 634.34 ... watching the bounce off that level today ...

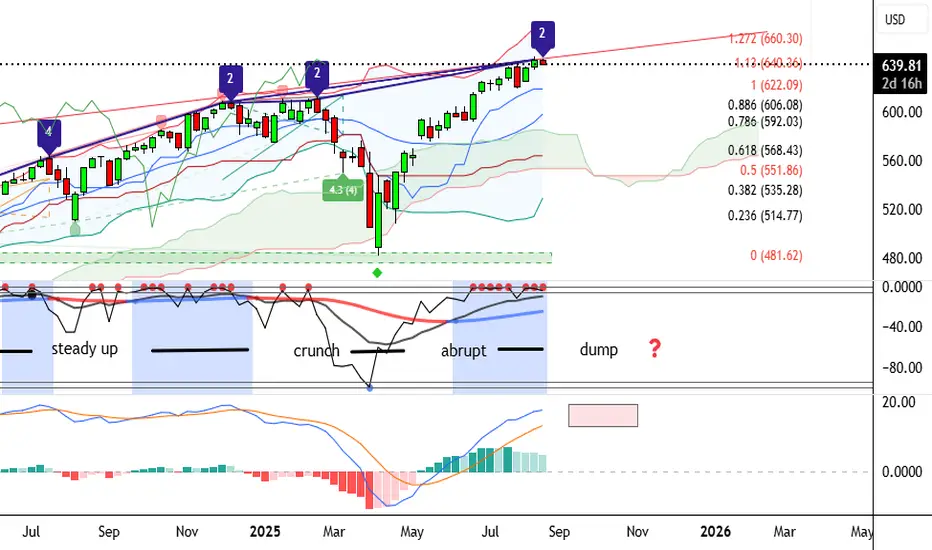
SPX Long Term TrendSPX seems to be in a 5 wave upward trend. We see alternation in waves 2 (subdividing) and 4 (sharp move down). We also see that 1 = 3 and 5 so far is 5 = 0.618*1 hence the pullback. Both 2 and 4 have retraced 1 and 3 exactly 50%. The target for wave 5 should either be 0.618*1 or 1.618*1 giving us a pretty bullish move ahead. Will publish short term view in a separate post.

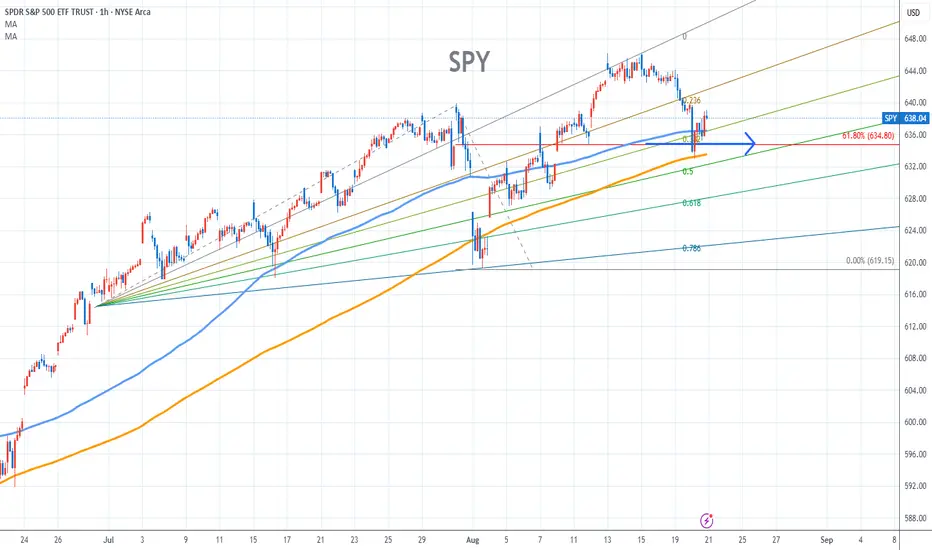
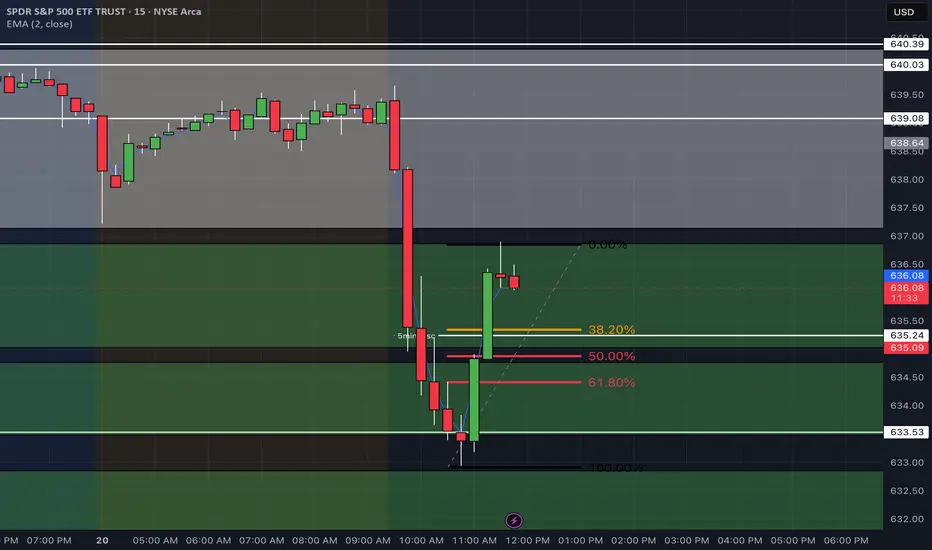
SPY Stock Chart Fibonacci Analysis 082025Trading Idea
1) Find a FIBO slingshot
2) Check FIBO 61.80% level
3) Entry Point > 634/61.80%
Chart time frame:B
A) 15 min(1W-3M)
B) 1 hr(3M-6M)
C) 4 hr(6M-1year)
D) 1 day(1-3years)
Stock progress:A
A) Keep rising over 61.80% resistance
B) 61.80% resistance
C) 61.80% support
D) Hit the bottom
E) Hit the top
Stocks rise as they rise from support and fall from resistance. Our goal is to find a low support point and enter. It can be referred to as buying at the pullback point. The pullback point can be found with a Fibonacci extension of 61.80%. This is a step to find entry level. 1) Find a triangle (Fibonacci Speed Fan Line) that connects the high (resistance) and low (support) points of the stock in progress, where it is continuously expressed as a Slingshot, 2) and create a Fibonacci extension level for the first rising wave from the start point of slingshot pattern.
When the current price goes over 61.80% level , that can be a good entry point, especially if the SMA 100 and 200 curves are gathered together at 61.80%, it is a very good entry point.
As a great help, tradingview provides these Fibonacci speed fan lines and extension levels with ease. So if you use the Fibonacci fan line, the extension level, and the SMA 100/200 curve well, you can find an entry point for the stock market. At least you have to enter at this low point to avoid trading failure, and if you are skilled at entering this low point, with fibonacci6180 technique, your reading skill to chart will be greatly improved.
If you want to do day trading, please set the time frame to 5 minutes or 15 minutes, and you will see many of the low point of rising stocks.
If you want to prefer long term range trading, you can set the time frame to 1 hr or 1 day
Nightly $SPY / $SPX Scenarios for Thursday, August 21, 2025 🔮 Nightly AMEX:SPY / SP:SPX Scenarios for Thursday, August 21, 2025 🔮
🌍 Market-Moving Headlines
Tech jitters spill as Jackson Hole kicks off. Global equities slipped following a tech sell‑off driven by concerns over U.S. intervention in chipmakers, while traders await Fed Chair Powell’s policy cues. AMEX:SPY and NASDAQ:TLT under pressure as rate‑cut expectations waver.
Sony hikes PS5 prices amid tariffs. Effective August 21, PlayStation 5 models in the U.S. see a $50 price increase—tariff impact spilling into consumer electronics. Raises inflation whispers amid already elevated tech cost narrative.
Healthcare activism heats up. Boards at firms like Medtronic, Pfizer, and Novo Nordisk shift under investor pressure—governance shake‑ups adding a layer of corporate risk and potential M&A signals.
⏱ Key Data Releases & Events (ET)
10:00 AM — Advance Services Report (Q2) (Census bureau). Quarterly weight of service economy—strong print supports Pro side of markets; weak could dial back rate‑cut hopes.
10:00 AM — Summer Youth Labor Force Survey (Annual). Goes with job‑market narrative from July—may tweak Fed sentiment depending on labor softening/stability.
Jackson Hole Symposium begins. Markets now fully focused on Powell; tone could make or break short‑term equity and bond positions.
⚠ Disclaimer: Educational/informational only — not financial advice.
📌 #trading #stockmarket #Fed #JacksonHole #SPY #SPX #TLT #Sony #tech #tariffs #services #labor #activism #healthcare
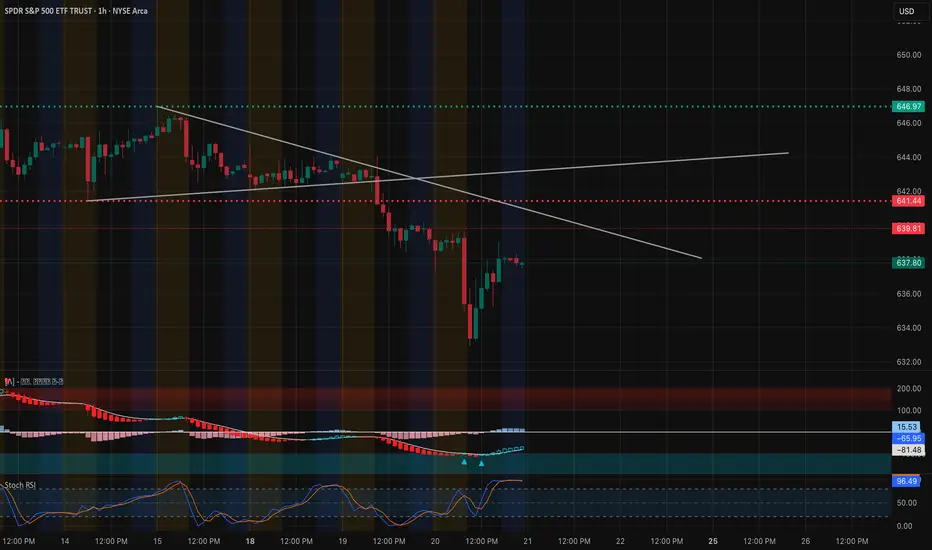
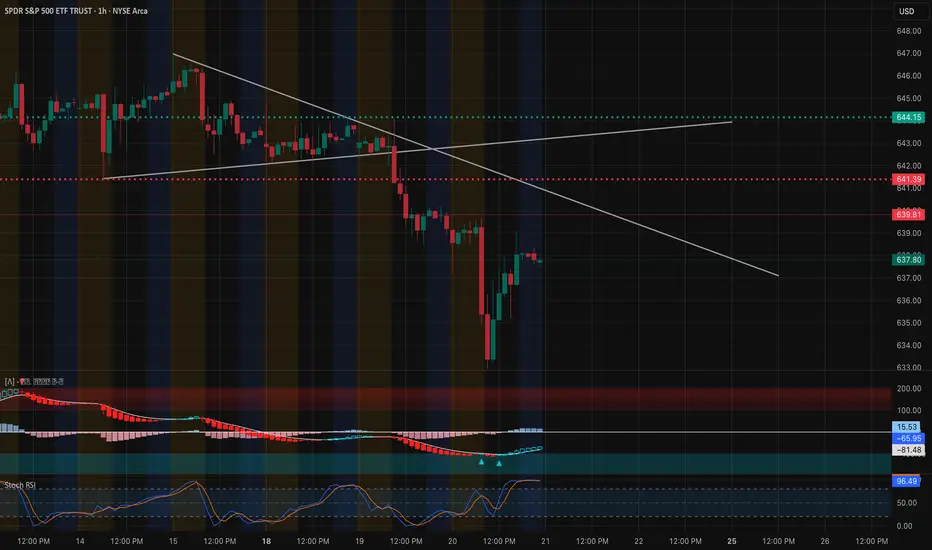
SPY at a Decision Point – Aug. 21SPY at a Decision Point – Will 639 Hold or Break? 📉📈
Technical Analysis (1H Chart)
SPY is showing a classic bounce attempt after the sharp selloff. Price is sitting around 637–638, just under the downtrend resistance line. The chart highlights:
* Trendline Pressure: Multiple touches of the descending trendline; rejection risk remains high unless bulls reclaim 641–642.
* Key Support: Buyers defended the 635 zone, with the next strong support down at 632–633. Losing this area could trigger another wave lower.
* Momentum Indicators:
* MACD is trying to curl bullish from oversold, but momentum is shallow.
* Stoch RSI is already extended near overbought — suggesting rallies may stall soon if not confirmed with volume.
* Structure: If SPY fails to clear 641.5–642, we may see another lower-high formation and retest of 635.
Trading View (Intraday):
* Bullish case → Clear break + hold above 642, targeting 646–647 supply zone.
* Bearish case → Failure under 639–641 could drag SPY back toward 635–633.
GEX / Options Sentiment
Options positioning confirms this tight battle zone:
* Call Walls / Resistance:
* 640 → First big resistance, aligning with HVL zone.
* 642–644 → Multiple call walls (9–10% concentration).
* 647–648 → Extreme upside wall, likely gamma cap.
* Put Walls / Support:
* 637 (GEX7 / -11%) → First downside magnet.
* 635 (2nd Put Wall / -20%) → Strong support cluster.
* 632 (GEX10 / -5%) → Deeper downside target if selling extends.
* Net Options Flow:
* Puts dominate ~87% (bearish tilt).
* IVR low (14.4) → cheap options pricing, directional plays favored.
* GEX heavily negative at 639, meaning dealer hedging could accelerate volatility around this pivot.
Thoughts & Suggestions
* Market is heavily leaning bearish, but intraday scalps can flip quickly if bulls reclaim 642.
* For options traders:
* Bullish scalp setup → Calls only if breakout above 642 with momentum confirmation.
* Bearish setup → Favor puts on rejection under 639–641, with 635/632 as profit zones.
* Risk management is key here: chop is possible between 637–641 before a decisive move.
🔔 Conclusion: SPY is at a tight inflection between 639 support and 641–642 resistance. Dealer flow favors downside, but if bulls can reclaim 642, a short squeeze toward 646–647 opens up. Until then, bias stays slightly bearish.
Disclaimer: This analysis is for educational purposes only and not financial advice. Always do your own research and manage risk before trading.
PLTR Bouncing Off Capitulation Zone-Aug 21PLTR Bouncing Off Capitulation Zone – Can Bulls Reclaim Control? 🚀
🔹 Technical Analysis (1-Hour Chart)
PLTR sold off sharply, finding a temporary bottom around $149–150, which aligned with high volume support. The rebound has been strong, with price now pressing into the $159–160 resistance shelf. This zone is critical because it coincides with a previous breakdown level.
* Trend: Still bearish overall, but the sharp bounce shows buyers defending the $150 zone.
* Momentum: Stoch RSI is turning up from oversold, while MACD shows early bullish momentum.
* Resistance Levels: $160 (current HVL and breakdown shelf), then $162.5 and $167.5.
* Support Levels: $155 (minor shelf), then $150 (major support). A loss of $150 opens the door toward $145.
If $160 is reclaimed and held, PLTR can attempt a short-term recovery back into the mid-$160s. Failure at this resistance risks another leg lower toward $150.
🔹 GEX / Options Sentiment
Options positioning highlights the same pivot:
* Call Resistance: Heavy walls at $162.5 (45%) and $167.5 (26%), with another layer at $170 (41%). Dealers are short here, so breakouts above $162.5 could squeeze.
* Put Support: Strongest put wall around $155, with extreme negative GEX at $150 and $145. If $150 breaks, downside could accelerate.
* IV & Sentiment: IVR 25.9 with calls only 7.9% → options sentiment still leans bearish/hedged.
Interpretation: GEX suggests a tug-of-war between $155–160. Bulls must clear $160 to ignite call wall hedging up toward $167+. Bears will defend this zone aggressively, and a rejection here drags us back toward $150.
🎯 Trade Thoughts
* Bullish Setup: Break & hold above $160 → entry long with targets $162.5 → $167.5. Stop under $155.
* Bearish Setup: Rejection at $160 → short targeting $155 → $150. Stop above $162.5.
Conclusion:
PLTR is at a decision point. $160 is the key battleground for bulls vs bears. Options data aligns with the chart — reclaiming $160 could spark a gamma squeeze higher, while rejection keeps pressure back to $150 support.
Disclaimer: This analysis is for educational purposes only and not financial advice. Always do your own research and manage risk accordingly.
SPY Long From Rising Support! Buy!
Hello,Traders!
SPY is trading in an
Uptrend along the
Rising support and we
Are already seeing a
Bullish rebound from
The line so we will be
Expecting a further
Bullish move up
Buy!
Comment and subscribe to help us grow!
Check out other forecasts below too!
Disclosure: I am part of Trade Nation's Influencer program and receive a monthly fee for using their TradingView charts in my analysis.

SPY wave 5 to 630ishSPY should complete wave 5 to 630 area which will complete higher degree wave 1, you can also use channels to determine where waves will begin and end

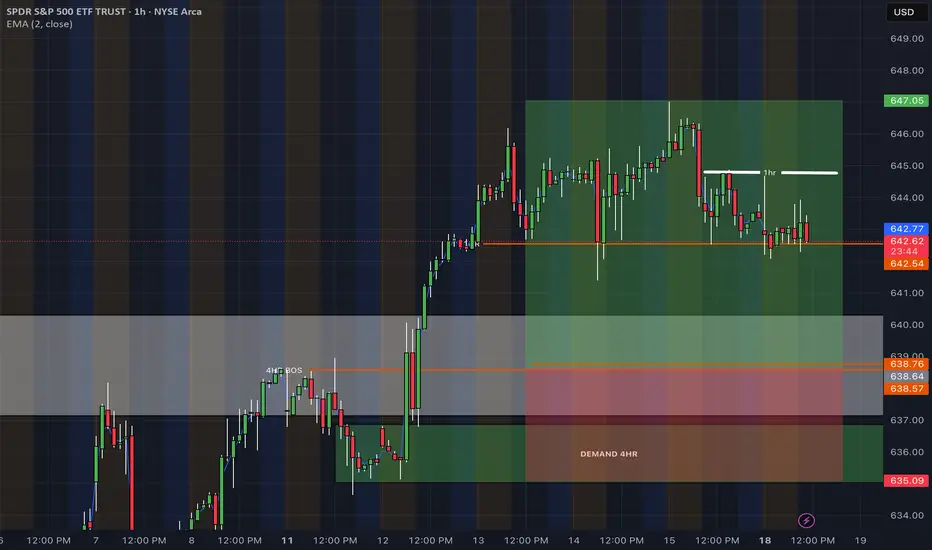
If bullish momentum continue....So far Spy may be changing directions from the bearish momentum we were facing for the remainder of the week we will continue to look for bullish scalping opportunities and i will share my analysis.
Today caught a clean scalp from demand and Fib confluence
the setup was built on Demand, Fib, and strong bullish momentum
quick in and out.
Options Trader:)

Scalp Trade
Price flushed down hard into demand and multiple timeframe demand zones overlap.
May take a quick bullish scalp today looking for confirmation on reversal on lower timeframes (15 - 5min) entry somewhere between 635 and 636 with a TP at 638.50.
Risk management due to high volatility around these zones
if price slices below 633.50 scalp will be invalidated and next leg may be lower.
look for next post for lower timeframe chart

SHORT | SPYAMEX:SPY
SPY Daily – Bearish Setup Developing
Trend Structure
SPY recently printed a Higher High near 646 but failed to hold momentum.
Current structure remains bullish overall, but the short-term is weakening.
A break below 627 would put the Higher Low sequence at risk.
EMA Context
Price rejected under the 9 EMA, signaling short-term weakness.
The 35 EMA around 629–630 is the first key support.
The 100 EMA near 607 aligns with demand/FVG zones and represents a major inflection.
Targets
TP1: 633.77
TP2: 627.04
Invalidation
A daily close above 646 would negate the bearish bias and re-open upside continuation.
Bias
Short-term bearish, expecting tests of 633.77 and 627.04.
If 627 breaks, next levels are 614–607.

SPY – No hocus-pocus – Now the witch is hunting the bullsHappy Hump-Day y'all!
In the last post (see linked chart), I explained what the witch sees in the future.
A possible scenario that is long overdue: the markets are letting out air.
With the candles from yesterday and the day before, we have confirmation that the S&P 500 is heading south. That has consequences that not many want to see right now.
The bulls will be overrun, panic selling will kick in and drive the markets into the ground even faster. The current profit target is still the Centerline, as marked with the red arrow.
Whoever doesn’t cash in at least 50% of their gains now will end up in the witch’s cauldron §8-)
Let’s see how this develops.
The YT Video will be up tomorrow - gotta feed the witches cat §8-)
May the broom be with you!

Nightly $SPY / $SPX Scenarios for Wednesday, August 20, 2025🔮 Nightly AMEX:SPY / CBOE:SPX Scenarios for Wednesday, August 20, 2025 🔮
🌍 Market-Moving News
Jackson Hole in focus; dollar firms. Traders lean ~84% odds of a 25bp cut in September; watch TVC:DXY vs. $SPY/ NASDAQ:TLT as Powell risk approaches.
Retail baton passes from HD to LOW/TGT. After HD’s hold-guidance rally, attention shifts to Lowe’s/Target for read-throughs on DIY vs. pro spend and tariff pass-through.
Risk tone jittery into minutes. Tech led a pullback Tuesday; positioning lightens ahead of Fed minutes and Jackson Hole.
📊 Key Data Releases & Events (ET)
7:00 AM — MBA Mortgage Applications (weekly). Prior: +10.9% w/w (8/13). Why it matters: housing demand pulse → rates/affordability → AMEX:XHB and growth tone.
10:30 AM — EIA Weekly Petroleum Status. Prior crude change: +3.036M bbl. Why it matters: oil balance → gasoline/diesel → inflation & AMEX:XLE path.
1:00 PM — U.S. 20-Year Treasury Auction. Typical close: 1:00 ET; also 17-week bill today. Why it matters: term-premium & risk appetite; tails/stop-throughs can shake $TLT/$TNX.
2:00 PM — FOMC Minutes (July 29–30). Watch for: depth of cut debate, tariffs → inflation, labor cooling. Why it matters: reprices path-of-rates across curve and equities.
Earnings (before open): LOW, TGT, TJX, ADI (+ others). Why it matters: U.S. consumer & capex reads; category mix shifts. Lowe’s call 9:00 AM.
⚠️ Disclaimer: Educational/informational only — not financial advice.
📌 #trading #stockmarket #SPY #SPX #Fed #FOMCMinutes #JacksonHole #DXY #TLT #XLE #LOW #TGT #TJX #ADI
Turnaround Tuesday? ✅ Morning Levels + Setup (Tues, Aug 20)
Could be, Monday gave us the setup.
I’m watching building permits at 8:30. If those come in hot, it’s a signal housing’s holding up → stronger consumer → rate hike odds perk up → possible dollar spike → pressure on QQQ.
VIX is still asleep at 14.98, but if that creeps over 16.50, tone changes fast. Complacency’s real ,use it.
SPY levels I care about today:
646.40 = upside line in the sand
642.50 = support to hold
638 / 632 = where I’d aim puts if things unwind
Not overthinking it, waiting for price to confirm.

Nightly $SPY / $SPX Scenarios for August 19, 2025🔮 Nightly AMEX:SPY / SP:SPX Scenarios for August 19, 2025 🔮
🌍 Market-Moving Headlines
Global markets tread water ahead of Jackson Hole. Asian equities slipped while European futures edged up on signs of diplomatic progress in the Russia–Ukraine crisis, as markets await Fed Chair Powell’s keynote. AMEX:SPY / SP:SPX still anchored to central-bank risk tone.
Jackson Hole in focus. Investors are positioning for signals of a dovish tilt or rate cut cues in Powell’s speech later this week—data releases are in the shadow of event risk.
Home Depot earnings loom. Retail heavyweight Home Depot reports today; strong results could buoy equities, while a miss would fan caution on consumer resilience.
💼 Key Market Developments
Meta and Palo Alto highlight tech divergences. Meta shares slipped 2.3% on AI-leaning costs and metaverse skepticism, while Palo Alto surged 5% with robust Q4 and 2026 outlook—creating bifurcated leadership in tech.
Stagflation & AI risk lurk. Analysts warn of stagflation threats and fading AI momentum as catalysts for a broader pullback—S&P 500 still up ~10% YTD, but vulnerable.
⏱ Key Data Releases & Events (ET)
📅 Tuesday, August 19, 2025
Canada Inflation Rate (July): Expected 2.0% y/y — a minor but global inflation cue
U.S. Building Permits (July): Forecast ~1.39M — housing sector signpost ahead of Powell’s speech
Corporate Highlight:
Home Depot (HD) earnings — earnings and commentary on inflation, tariffs, demand dynamics
⚠ Disclaimer: Educational/informational only — not financial advice.
📌 #trading #stockmarket #economy #JacksonHole #Fed #SPY #SPX #HD #HomeDepot #JacksonHole #inflation #earnings #tech #AI #SP500
SPY - Area of interestBeen ptiently waiting since last week for price to reach my ideal entry. Watching closely, alerts set, nu rush just letting the market come to me.
Weekly $SPY / $SPX Scenarios for August 18–22, 2025🔮 Weekly AMEX:SPY / SP:SPX Scenarios for August 18–22, 2025 🔮
🌍 Market-Moving News 🌍
🏔️ Jackson Hole (Thu–Sat): Chair Powell headlines the Kansas City Fed symposium—path-of-rates + growth vs. inflation = front-page risk for AMEX:SPY SP:SPX TVC:DXY $TLT.
📝 FOMC Minutes (Wed): Deeper read on July meeting dissents and tariff/inflation views—rate-cut odds in play.
🛒 Retail Heavyweights: Earnings updates from NYSE:WMT NYSE:HD NYSE:TGT NYSE:LOW NASDAQ:ROST = real-time consumer pulse for AMEX:XRT and broader risk tone.
🏠 Housing Check: Starts/Permits + Existing Home Sales frame construction demand and affordability; watch AMEX:XHB and long rates.
📊 Key Data Releases & Events (ET) 📊
📅 Tue, Aug 19
• Housing Starts & Building Permits (8:30 AM)
📅 Wed, Aug 20
• FOMC Minutes (July meeting) (2:00 PM)
📅 Thu, Aug 21
• Initial Jobless Claims (8:30 AM)
• Philly Fed Manufacturing Index (8:30 AM)
• S&P Global Flash PMIs (Mfg/Services) (9:45 AM)
• Existing Home Sales (Jul) (10:00 AM)
• Conference Board Leading Index (10:00 AM)
• Jackson Hole Symposium begins (all day; speeches through Sat)
📅 Fri, Aug 22
• No major U.S. releases (focus: Jackson Hole headlines + positioning)
⚠️ Disclaimer: Educational/informational only — not financial advice.
📌 #trading #stockmarket #economy #Fed #FOMC #JacksonHole #housing #PMI #retailsales #SPY #SPX #DXY #TLT #XHB #XRT
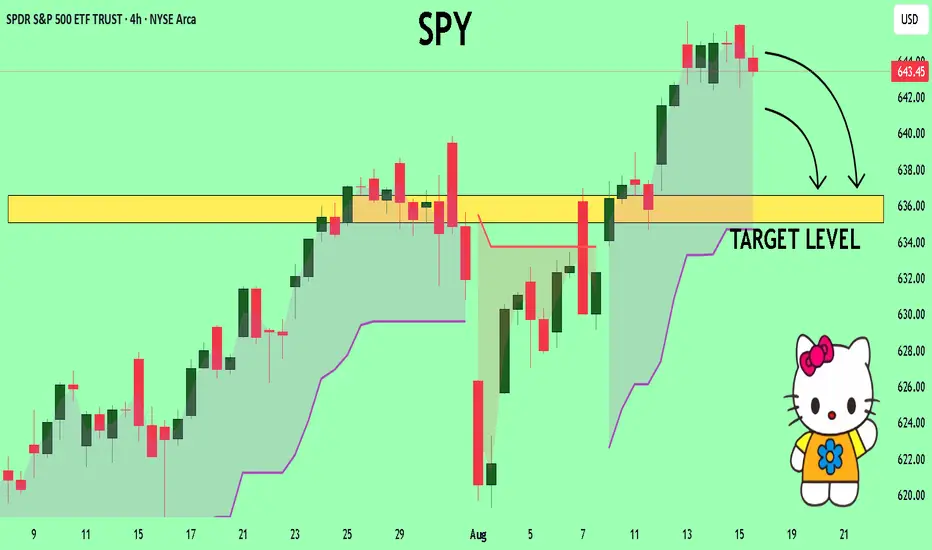
SPY Technical Analysis! SELL!
My dear followers,
This is my opinion on the SPY next move:
The asset is approaching an important pivot point 643.45
Bias - Bearish
Technical Indicators: Supper Trend generates a clear short signal while Pivot Point HL is currently determining the overall Bearish trend of the market.
Goal - 636.56
About Used Indicators:
For more efficient signals, super-trend is used in combination with other indicators like Pivot Points.
Disclosure: I am part of Trade Nation's Influencer program and receive a monthly fee for using their TradingView charts in my analysis.
———————————
WISH YOU ALL LUCK
SP500 ETF: Fibonacci MappingAs you may know, Williams Fractals indicator identifies potential reversal points by marking a high (or low) surrounded by two lower highs (or higher lows) on each side, forming a five-bar pattern that signals possible turning points in price. Unfortunately, the simplicity of such indicator provides just tiny perspective, undermining broad implication of the concept.
Before I begin diving into processing geometric narrative of emerging price via fibonacci channels, I want to explain how I interpret fractals.
When I use the term "fractal", I'm not just talking about the points alone. Market continuously corrects itself, so analyzing it by price alone can bring more confusion than help. The object of observation shouldn't be limited to quantifying just by a single property. Chaos by default requires awareness from both price and time aspects. The easiest way to root it in my vision was through realization that price is a function of trading time intervals. Its activity can be described as cyclical progression, as if it is wired by multiple "springs" of different tensions.
Classic TA patterns known to literally anyone are great for anticipating a move in surface level forecasts. Since my line of work focuses on prediction over forecasts, it requires deeper structural awareness behind complex oscillations.
Let's observe the way selloff scales from ATH and how it impacts fractal hierarchy.
The first corrective bullish wave can be explained as a reaction to initial impulsive bearish wave. The bigger scale drop from ATH to a lower point explains why the corrective bullish wave looks the way it is. And so on:
In fractals, scaling laws describe how key properties change with size, typically following power-law relationships that reflect the structure’s self-similarity, where a characteristic scales with the size raised to an exponent.
To build a probabilistic model, we must keep in mind how the smaller bits make up bigger scale picture. ATH, established bottom and angle of progression defined by pullback highs, all those points have structural weight. Since psychology of masses that shapes price dynamics is governed by mathematical sequences found in nature, it's fair to use Fibonacci Channels to map the geometry of interconnectedness.
Similarly, all of those points can be referred by another fibonacci channel with opposite direction.
From my perspective, traditional TA patterns reflect just phases of cycle, this is why I unify those fragments into broader scalable shapes. This distinctive branch of Fractal Analysis allows to track systematic aspects of market behavior and explains how a pattern replicates itself in rhythmic continuity.

Stock Market Forecast | TSLA NVDA AAPL AMZN META MSFTQQQ CME_MINI:NQ1! CME_MINI:ES1! stock market Forecast
Nvidia Stock NASDAQ:NVDA Forecast
Apple Stock AAPL Forecast
Microsoft Stock MSFT Forecast
Google Stock GOOGL Forecast
Amazon Stock AMZN Forecast
Meta Forecast Technical Analysis
Tesla Stock NASDAQ:TSLA Forecast
Magnificent 7 stocks forecast
