STO building up for a break outOIL price is dead while other commodities are rocketing up. Major disconnect in GOLD and OIL prices. I am overweight on WDS so I think i'll pick up more STO,
which also pays a solid dividend. I will average down for more STO and wait for
the imminent breakout. I picked up the gold miners when
Santos Ltd.
No trades
Next report date
—
Report period
—
EPS estimate
—
Revenue estimate
—
0.32 USD
1.22 B USD
5.46 B USD
About Santos Limited
Sector
Industry
CEO
Kevin Thomas Gallagher
Website
Headquarters
Adelaide
Founded
1954
IPO date
Oct 1, 1954
Identifiers
3
ISIN US8030218072
Santos Ltd. engages in the exploration, development, transportation, and marketing of natural gas. It operates through the following segments: Cooper Basin, Queensland and New South Wales, Papua New Guinea, Northern Australia and Timor-Leste, and Western Australia. The company was founded by Reg Sprigg, John Bonython, and Douglas Mawson on March 18, 1954 and is headquartered in Adelaide, Australia.
Related stocks

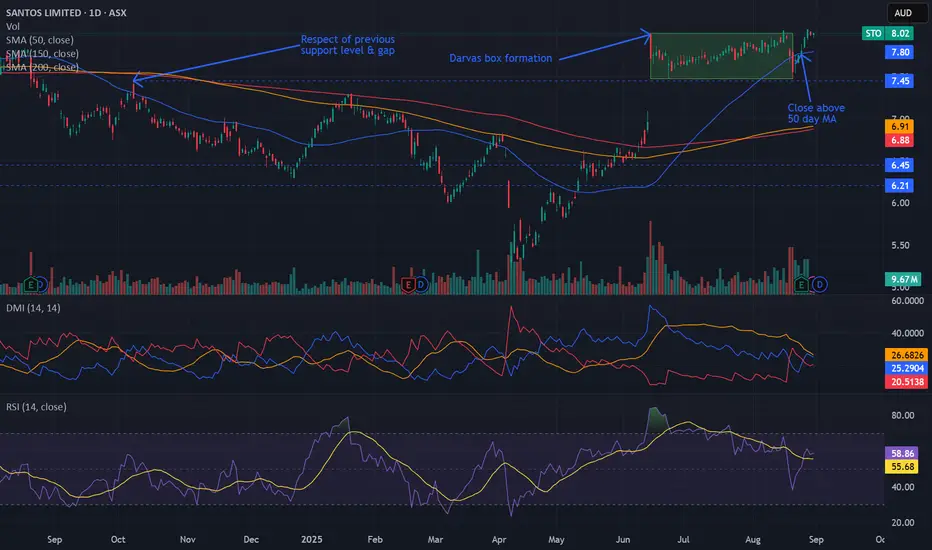
Bullish potential detected for STOEntry conditions:
(i) breach of the upper confines of the Darvas box formation for $ASX:STO.
- i.e.: above high of $8.02 of 16th June (most conservative entry), and
(ii) swing up of indicators such as DMI/RSI.
Stop loss for the trade (based upon the Darvas box formation) would be:
(i) below the sup
ASX:STO - 15 AUG, 2025 ELLIOTT WAVE ANALSYSISConclusion: Wave 3))purple continues to move higher.
Key Points: We are in an Extended Wave, specifically the 1)blue of wave 3))purple, which will basically continue to move higher, aiming for the nearest level at 11.32 or higher at 15.00.
In the short term, wave 1)blue may complete, and then wave

STO: March 5, 2024STO (Santos Limited) || March 5, 2024
Master of Elliott Wave Analysis: Shane Hua (CEWA-M)
(Left chart) In the broader context, we observe a price increase following a Leading Diagonal pattern, which concluded at 7.98. Subsequently, there's been a three-wave decline labeled ABC(circled, green). At t

Long Santos #STO #ASX # ASX200 # Trading #breakoutHi all,
An ascending triangle is classified as a continuation chart pattern.
Continuation patterns are expected to lead to the continuation of an existing trend.
While the ascending triangle is considered a bullish continuation pattern, exceptions are quite possible. It’s not infrequent to see it

STOthis is the 2W chart for the previous post.
i need to tyype more so i will
previous post was good.
but i dont want to type itup again

but Santos2week STO chart looking good.
RSI shows a breakout
and price confirms it.
expect the $9 mark to be broken
oil price has moved first but now
the oil producers will follow .
confirmation that oil prices will remain
high for a long time...,.. unless the house of saud
starts pumping more.


STO - Vol Profile TradeASX:STO
LT EMA trend bullish, ST EMA trend starting to turn bullish. Bulish volumes starting to dominate.
Two potential nodes identified. The POC at 6.34 which is the POC of the last 4 years.
The other is around the 6.90 node, the POC of the last year where the stock has been ranged bound.
I'm

See all ideas
Summarizing what the indicators are suggesting.
Neutral
SellBuy
Strong sellStrong buy
Strong sellSellNeutralBuyStrong buy
Neutral
SellBuy
Strong sellStrong buy
Strong sellSellNeutralBuyStrong buy
Neutral
SellBuy
Strong sellStrong buy
Strong sellSellNeutralBuyStrong buy
An aggregate view of professional's ratings.
Neutral
SellBuy
Strong sellStrong buy
Strong sellSellNeutralBuyStrong buy
Neutral
SellBuy
Strong sellStrong buy
Strong sellSellNeutralBuyStrong buy
Neutral
SellBuy
Strong sellStrong buy
Strong sellSellNeutralBuyStrong buy
Displays a symbol's price movements over previous years to identify recurring trends.
SNOL6226739
Santos Finance Limited 5.75% 13-NOV-2035Yield to maturity
5.60%
Maturity date
Nov 13, 2035
SNOL5650449
Santos Finance Limited 6.875% 19-SEP-2033Yield to maturity
5.21%
Maturity date
Sep 19, 2033
SNOL5172094
Santos Finance Limited 3.649% 29-APR-2031Yield to maturity
4.79%
Maturity date
Apr 29, 2031
SNOL4837282
Santos Finance Limited 5.25% 13-MAR-2029Yield to maturity
4.66%
Maturity date
Mar 13, 2029
SNOL4622854
Santos Finance Limited 4.125% 14-SEP-2027Yield to maturity
4.39%
Maturity date
Sep 14, 2027
See all SSLZY bonds