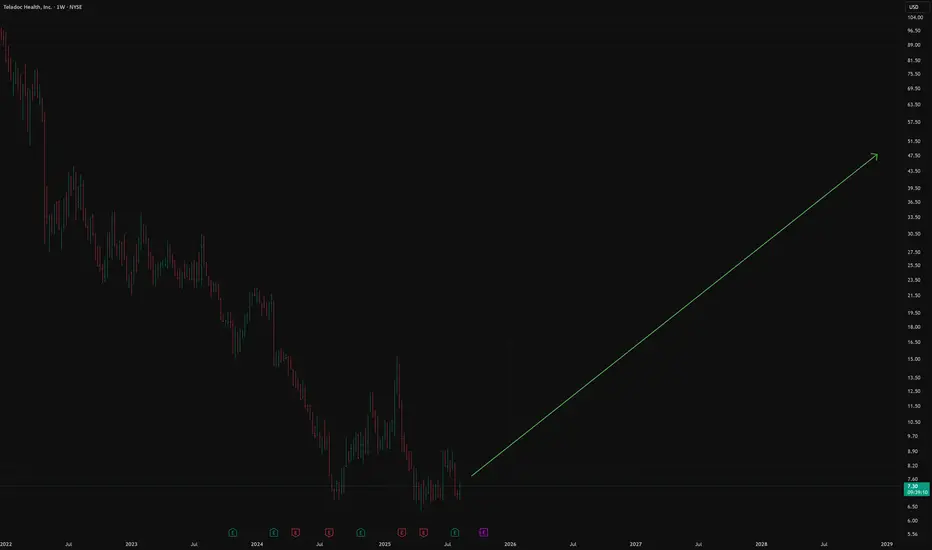
$TDOC - Improving Margins and Technical OutlookOnce again, NYSE:TDOC has been previously analyzed and shows improving financial profit margins, with the potential to reach breakeven. From a technical perspective, if my fundamental analysis is correct, $8.90 appears to be a temporary resistance level. The target is indicated in the chart above.
This is not a recommendation to buy or sell.
Trade ideas

$TDOC: Above the 100MA with Resistance AheadTDOC (Teladoc Health) demonstrates improving financial efficiency and maintains consistent revenue performance, with a current valuation around $1.46 billion. Assuming this trend persists, and considering the 100-MA average as a technical reference point, there is potential for upward movement in the stock's value as long as it remains above that average.
The initial resistance level is observed near $8.90 , with a broader regional resistance around $10.80 .
This analysis is for informational purposes only and does not constitute a recommendation to buy or sell securities.

$TDOC looking Juicy in higher timeframe!- NYSE:TDOC weekly and monthly looks like its ready for the take off.
- AI should make the company leaner and more effective.
- AI in healthcare is secular trend.

$TDOC Breakout Play- NYSE:TDOC is in process of breaking out of multi-year downward trendline.
- There are so many tailwinds which should propel the stock higher including AI in healthcare.
- Aging population in US would need access to doctors and there are shortages of doctor. Telemedicine would be faster, easier way to diagnore/triage patients.
- Improvement in mult-modal LLMs should lead to efficiencies in the business. NYSE:TDOC should be able to go leaner by cutting down cost by laying off manual work and utilizing AI.

Value Zone and ChannelsTDOC is in a downward parallel channel but near a previous demand zone and in a value zone, but if TDOC does not breakout upward out of the channel and close below 6.50, the Value Zone will be invalid.

Teladoc Mid-Long term ideaTeladoc Health is a company specializing in telemedicine and virtual healthcare.
The company gained wide popularity during the covid-19 pandemic.
The company has historically expanded its operations through M&A:
In 2013 and 2014, the acquisition of Consult A Doctor, AmeriDoc allowed Teladoc to become one of the largest telemedicine companies in the United States.
Today, the company is valued by the market as value, although a few years ago the valuation was growth. Why did this happen?
As part of its strategy, the company's previous CEO had aggressive M&A deals on credit.
In 2021, TDOC's revenue growth began to slow rapidly. And in Growth companies, growth rates determine, if not everything, then a lot, including market valuation.
Price/Sales 2020 at its peak was over 30, which is very expensive. Before the company's triumph in 2020, the valuation was around 10. Today, P/S is only 0.5
It is necessary to separately touch upon such a parameter as the company's balance sheet and valuation through the prism of the P/B multiplier. The balance sheet grew rapidly in 2020, but it was done through the growth of goodwill, and not through the growth of fixed assets. In general, the growth of goodwill in the balance sheet is an extremely interesting thing and we will discuss this in the following posts. Starting in 2022, the company's balance sheet began to decline sharply, but the write-offs were NON-CASH, and there was a revision of that same goodwill.
On average, the company's P/B was around 4-5 and at its peak it reached 15. Today, the market values companies at 0.9, and this is despite the fact that the main write-offs have already occurred. The company has a debt of 0.99 B$
Cash and cash equivalents 0.67 B$
Which gives us a net debt of 314 M$
The company's revenue has been stagnating since 2023 and is 2.54 B$ TTM
The good thing is that starting from the same 2023, EBITDA began to grow from 0.066 B$ to 0.160 B$
OCF is positive
2022 193.99 M$
OCF today 303 M$ TTM
FCF is positive
2022 16 M$
2025 151 M$ TTM
The company today has a stable financial position with a net debt of 314 M$ and FCF 150 M$
In June 2024, Chuck Divita was appointed as the new CEO of the company, who is trying to put TDOC back on the rails of revenue growth and restart revenue growth while maintaining current margins. The first steps in this direction have already been taken and in February 2025 Teladoc acquired Catapult Health for 70 M$ in order to launch a sales funnel.
Also, in the near future, the Fed will begin to lower rates and since TDOC belongs to the small caps category, this will help in the revaluation of both the sector and Teladoc itself.
Conservative targets can be called 45-55$ , closing the very gap when the company made a large write-off of goodwill in the report.
In general, we make the target 80-100$
Buy z dips doctorTeladoc (TDOC) looks like a classic turnaround setup — high risk, but with meaningful upside if execution plays out. The stock is trading around $8 after a brutal drawdown, pricing in a lot of pessimism. But under new leadership, Teladoc is aggressively cutting costs, improving free cash flow, and refocusing on its Integrated Care segment while stabilizing the underperforming BetterHelp unit. Recent acquisitions (Catapult, UpLift) support this shift toward more integrated, network-based services.
Technically, the setup is compelling: Bollinger Bands are tightening and there’s a divergence forming — both early signals of a potential breakout or reversal. If the company can continue delivering on margin improvement and steadying revenue, the market may start to rerate the story. Execution is key, but at these levels, it could offer deep-value exposure to a recovering digital health player.

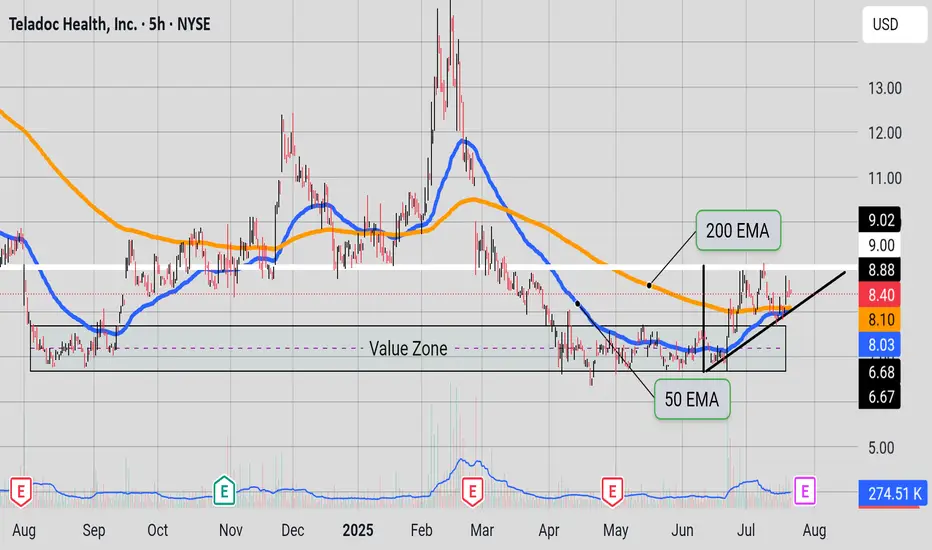
TrianglesThe asset is forming an asymmetrical triangle. The resistance is at $9. The support is at the 50 EMA and the 200 EMA. And the moving averages might make a golden cross. Bulls need the price to break the $9 resistance while a golden cross happens. Bears wouldn't mind price to go back to the value zone.
Value Zone and DreamsPrice maybe ready to break free from the value zone; If this week close out with these readings intact. Significant increase in volume; RSI is close to 50; SAR just flash bullish, MACD sloping upward, and just flashed green. To be safe one may go to a lower time(TF) frame like the 4 hour TF and look for higher highs and higher lows from this week closing price.

Teladoc Stock Chart Fibonacci Analysis 051625Trading Idea
1) Find a FIBO slingshot
2) Check FIBO 61.80% level
3) Entry Point > 7.3/61.80%
Chart time frame: B
A) 15 min(1W-3M)
B) 1 hr(3M-6M)
C) 4 hr(6M-1year)
D) 1 day(1-3years)
Stock progress: A
A) Keep rising over 61.80% resistance
B) 61.80% resistance
C) 61.80% support
D) Hit the bottom
E) Hit the top
Stocks rise as they rise from support and fall from resistance. Our goal is to find a low support point and enter. It can be referred to as buying at the pullback point. The pullback point can be found with a Fibonacci extension of 61.80%. This is a step to find entry level. 1) Find a triangle (Fibonacci Speed Fan Line) that connects the high (resistance) and low (support) points of the stock in progress, where it is continuously expressed as a Slingshot, 2) and create a Fibonacci extension level for the first rising wave from the start point of slingshot pattern.
When the current price goes over 61.80% level , that can be a good entry point, especially if the SMA 100 and 200 curves are gathered together at 61.80%, it is a very good entry point.
As a great help, tradingview provides these Fibonacci speed fan lines and extension levels with ease. So if you use the Fibonacci fan line, the extension level, and the SMA 100/200 curve well, you can find an entry point for the stock market. At least you have to enter at this low point to avoid trading failure, and if you are skilled at entering this low point, with fibonacci6180 technique, your reading skill to chart will be greatly improved.
If you want to do day trading, please set the time frame to 5 minutes or 15 minutes, and you will see many of the low point of rising stocks.
If want to prefer long term range trading, you can set the time frame to 1 hr or 1 day.

Important Level TDOC touched a key level again and recently appeared to have a fake out. It is consolidating and if it breaks this consolidaton downward it can make new lows. We need a break from the parallel structure upward around 7.33 and then a break from the blue 10 EMA for some bullish action.


Sentiment of Buyers vs Sellers🎯Hypothetical Strategy
Direction Entry Type
✅ Short Value, Entry Trigger: If price retests $8.50 & rejects again Above $8.60 Stop Target $8.20 → $8.00 or if price breaks below the 50 EMA
✅ Long Momentum, Entry Trigger If price closes above $8.58 (200 EMA) with bullish candle Below $8.45 Stop Target$8.93 → $9.20
🔔 Right now, the chart leans bearish bias under 200 EMA. Flip zone rejection confirms sellers are in control — short entries are higher probability unless $8.58 is broken, also notice the Chris Moody MACD flashed red, also notice the downward parallel channel.
Please be careful

TDOC Teladoc Health Options Ahead of EarningsAnalyzing the options chain and the chart patterns of TDOC Teladoc prior to the earnings report this week,
I would consider purchasing the 20usd strike price Calls with
an expiration date of 2026-1-16,
for a premium of approximately $1.04.
If these options prove to be profitable prior to the earnings release, I would sell at least half of them.

TDOCTeladoc Health, Inc. engages in the provision of telehealthcare services using a technology platform via mobile devices, the Internet, video and phone. It operates through the following segments: Teladoc Health Integrated Care, BetterHelp, and Others. The Teladoc Health Integrated Care segment offers virtual medical services. The BetterHelp segment includes virtual mental health and other wellness services. The company was founded in June 2002, by George Byron Brooks, Michael Gorton, and Gary Wald and is headquartered in Purchase, NY.
Long-term chart. For entertainment only.
2/19/2024 - Blue Orca declares short position.

Wednesday CandleWill Wednesday candle be a reversal candle we need today and tomorrow candle to verify. Wednesday candle was also near the Fibonacci level?

CorrectionBearish MACD indicator but price still above 200 EMA, which is a sign that asset is still in an uptrend. Price is resting near the golden zone on the Fibonacci level and in a Fair Value Gap, hopefully there will be a price reversal soon. Hopefully, price does not fall to lower Fibonacci levels. Please see chart for Fib levels and FVGs(in green and red blocks).

Minor Correction?I hope all is well.
In the 30 minute chart, it seems TDOC is moving nicely in an upward parallel channel, for the short term trend to remain bullish we need price to remain above 13.47 and to continue the momentum we need price to overcome 14.73.

Teladoc Health | TDOC | Long at $9.91Teladoc Health NYSE:TDOC - Initial position started at $9.91 with the potential for the price gap in the $7's to be closed in the near future (likely another entry there unless fundamentals change)
Pros:
User base of over 90 million and growing
Revenue grew from $555 million in 2019 to $2.6 billion through Q3 of 2024
Positive free cash flow since 2021
Low debt (debt to equity ratio around 1x)
AI integration and partnership with Amazon and Brightline
Historical simply moving average is approaching price, which often leads to a jump or change in downward momentum in the longer-term
Cons:
Currently unprofitable and not forecast to become profitable over the next 3 years
Lots of insider selling and exercising of options
No dividend
Daily price gap in the $7 dollar range which may close prior to move up
Targets through 2027 :
$14.20
$20.00
$27.00
$35.00
$55.00 (long-term, positive outlook)

Casually made a chart pattern and forgot to look back at it. Now look. Right where I thought and right when I expected it to happen. Bummer. But it’s okay. It happens when you look at loads of charts. Just good for the ol’ confidence bank.

TDOC (NYSE) - 30-Min Chart Long Trade Setup for Monday!🔥 🚀
🔍 Stock: TDOC (NYSE)
⏳ Timeframe: 30-Min Chart
📈 Setup Type: Bullish Breakout
📍 Trade Plan:
✅ Entry Zone: Above $12.95 - $14.21 (Breakout Confirmation)
🟢 Take Profit 1 (TP1): $14.21 (First Resistance Target)
🟢 Take Profit 2 (TP2): $15.40 (Extended Bullish Target)
🚀 Stop-Loss (SL): Below $11.99 (Key Support)
📊 Risk-Reward Ratio: Favorable for a bullish continuation 🚀
🔹 Technical Analysis & Setup:
✅ Pattern: Ascending Triangle Breakout 📈
✅ Breakout Confirmation Needed: Sustained price above $12.95 with volume increase
✅ Support & Resistance Levels:
🔸 $12.95 (Breakout Zone)
🔸 $14.21 (First Major Resistance)
🔸 $15.40 (Extended Target for strong momentum)
✅ Momentum Shift Expected: A breakout above $12.95 could trigger an upside rally 🚀
🔥 Trade Strategy & Refinements:
📊 Volume Confirmation: Look for increasing buying volume above $12.95 📈
📈 Trailing Stop Strategy: Once price reaches TP1 ($14.21), adjust SL higher to secure profits 🛑
💰 Partial Profit Booking: Take partial profits at $14.21 and let the rest ride toward $15.40+ 💵
⚠️ Fake Breakout Risk: If the price fails to hold above $12.95, reconsider entry ❌
🚀 Final Thoughts:
✅ Bullish Breakout Potential – High probability of continuation higher 📈
✅ Momentum Shift Possible – A move above $14.21 could accelerate upside 🚀
✅ Strong Risk-Reward Setup – SL at $11.99, TP at $14.21 - $15.40+ for optimal gains
📊 Trade Smart & Stick to the Plan! 🏆🔥
🔗 #StockMarket #TDOC #Teladoc #TradingSetup #TechnicalAnalysis #BreakoutTrade #DayTrading #MarketTrends #BullishSetup #ProfittoPath 🚀📈

Friendly ReminderGood day, Team:
We need this asset to break this hypothetical wedge structure to start a theoretical bull run.
The good news is that it is still in the theoretical value zone, which is from 6.83 to 38.50, hopefully the consolidation phase will be over, and we will be in the markup phase. Please see the chart for key levels and wedge structure. Please keep an eye on the RSI levels also. Be very careful.

Confluences(Hope)Good day Team
Thank you all for your time.
Here we have TDOC on the 3 Day Time Frame.
For holders/investors this is hopeful news.
-Currently we have a double bottom and the candle is forming a successful retest.
-Currently the MACD(Chris Moody) is forming a successful bullish crossover.
-CCI is currently positive and at the 70 levels and getting higher.
-Stochastic RSI is currently healthy.
-If price close tomorrow in it's current state, it would be a successful break and retest of the 10 EMA.
If these observations come to fruition it will be a miracle.
Please wait until candle finish printing.
Verify confluences and look for more confluences and check other TFs.
Have a bless day.
