MRK - Bear signal bell!=======
Volume
=======
-neutral
==========
Price Action
==========
- Bearish flag noticed
- Weak buying pressure after price gap up
=================
Technical Indicators
=================
- Ichimoku
>>> price above cloud
>>> Green kumo thinning
>>> Tenken + Chiku - above clouds and towards
>>> Kijun - Above clouds and moving towards
=========
Oscillators
=========
- MACD turning bearish
- DMI turning bearish
- StochRSI, turning bearish
=========
Conclusion
=========
- short to long term breakout swing
- price may reverse at current level, to enter spot or wait for pullback at entry 2.
Trade ideas


MERCK BULLISH (in long time)
. Overall Setup
The stock has been in a prolonged downtrend (red descending channel), which was broken by a falling wedge pattern (a bullish reversal signal).
After the breakout, price attempted to recover but was rejected around Top 1 – Top 2 (~$86).
It is now pulling back toward a key support zone near $78.
2. Support & Resistance
Strong support: $77–78 → potential rebound area (bottom of the channel + high-volume zone).
Resistance levels:
$82 (first intermediate resistance).
$86–88 (previous tops).
$95–100 (psychological + technical level).
Final bullish target: ~115, projected from the wedge breakout.
3. Technical Indicators
Bollinger Bands: price is at the lower band → potential reversal zone.
RSI (14):
Currently oversold (~35).
Past bullish signals (April) anticipated a rally.
Volume: declining during the recent drop → bearish pressure may be fading.
4. Bullish Strategy
Entry: accumulate in the $77–78 support zone (oversold RSI + lower Bollinger band).
Confirmation: breakout above $82 with volume.
Targets:
First: $86–88 (closing the gap + double top).
Second: $95–100.
Final: ~115 (wedge projection).
Stop-loss: below $76 (support invalidation).
Position management: take partial profits at resistance levels, hold a core position for the final target.
5. Strategy Narrative
This is a technical rebound play based on:
a completed bullish reversal pattern (falling wedge),
RSI in oversold territory,
price near the lower Bollinger band,
and the expectation of regaining lost ground toward and above $100.
The idea is to use the current pullback as a buying opportunity, positioning for a renewed bullish momentum.

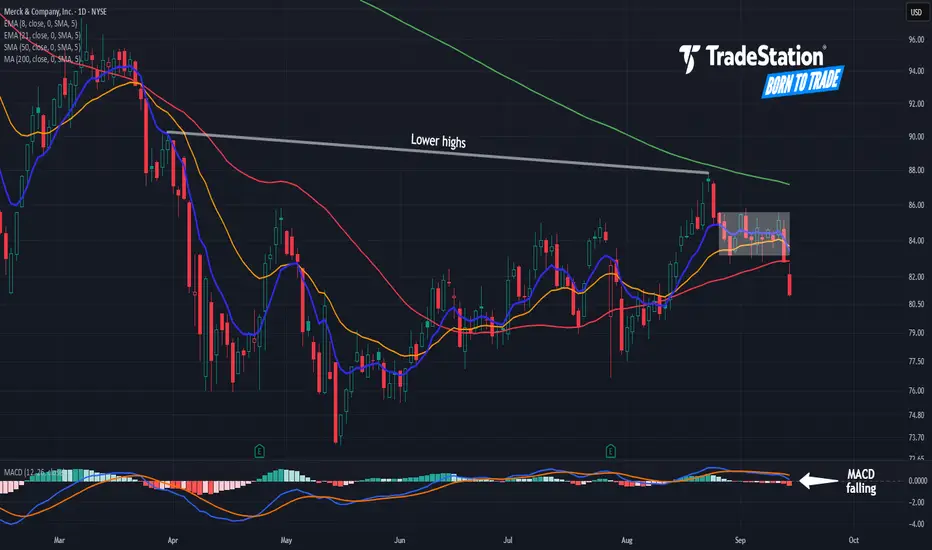
More Downside in Merck?Merck has been sliding for more than a year. Now, following a period of consolidation, some traders may see further downside risk.
The first pattern on today’s chart is the range between the August 26 high of $85.59 and the August 28 close of $83.21, where the pharmaceutical giant spent almost three weeks. It closed under support on Friday and continued lower yesterday. That may suggest that support has been broken.
Second, the 8-day exponential moving average (EMA) crossed below the 21-day EMA. MACD is also falling. Those signals could suggest the short-term trend has grown bearish.
Next, August saw a lower high relative to late March (which also featured lower peaks than previous months). That may confirm a longer-term downtrend is in effect.
Finally, MRK is back under its 50-day simple moving average.
TradeStation has, for decades, advanced the trading industry, providing access to stocks, options and futures. If you're born to trade, we could be for you. See our Overview for more.
Past performance, whether actual or indicated by historical tests of strategies, is no guarantee of future performance or success. There is a possibility that you may sustain a loss equal to or greater than your entire investment regardless of which asset class you trade (equities, options or futures); therefore, you should not invest or risk money that you cannot afford to lose. Online trading is not suitable for all investors. View the document titled Characteristics and Risks of Standardized Options at www.TradeStation.com . Before trading any asset class, customers must read the relevant risk disclosure statements on www.TradeStation.com . System access and trade placement and execution may be delayed or fail due to market volatility and volume, quote delays, system and software errors, Internet traffic, outages and other factors.
Securities and futures trading is offered to self-directed customers by TradeStation Securities, Inc., a broker-dealer registered with the Securities and Exchange Commission and a futures commission merchant licensed with the Commodity Futures Trading Commission). TradeStation Securities is a member of the Financial Industry Regulatory Authority, the National Futures Association, and a number of exchanges.
TradeStation Securities, Inc. and TradeStation Technologies, Inc. are each wholly owned subsidiaries of TradeStation Group, Inc., both operating, and providing products and services, under the TradeStation brand and trademark. When applying for, or purchasing, accounts, subscriptions, products and services, it is important that you know which company you will be dealing with. Visit www.TradeStation.com for further important information explaining what this means.
MRkStock: Merck & Company (MRK) – NYSE
Timeframe: 1H (short–to–mid term outlook)
Current Situation
The stock is trading around 85.16 – 85.33.
It has broken out of a long descending channel (yellow zone), signaling a potential trend reversal to the upside.
Suggested entry on the chart: Buy at 84.80 with a stop loss at 72.
Targets
Target Zone 1: 92.93 – 93.35
First major resistance area.
Good level for partial profit-taking.
Target Zone 2: 106.81 – 109.72
Strong resistance and confirmation of a mid-term uptrend continuation.
Target Zone 3: 116.16 – 120.31
Key historical resistance.
A breakout above this range could trigger a much larger bullish wave.
Risk Management
Stop Loss: 72 (below the last swing low – breaking it invalidates the bullish scenario).
Risk/Reward Estimate:
Entry 84.80 → First target 93 = ~+10%.
Potential downside to stop loss = ~–15%.
Best approach: scale out – take partial profits at target 1, let remaining shares ride toward higher targets.
Technical Notes
Breakout from the downtrend channel = bullish signal.
Recent formation of higher lows supports upward momentum.
Strong support lies in the 80 – 82 range.
✅ Conclusion:
MRK shows signs of reversal and recovery after a prolonged downtrend. Buying around 84.80 is valid with a strict stop at 72. First target is 93, then 107, with a potential extension toward 116–120 if bullish momentum continues.

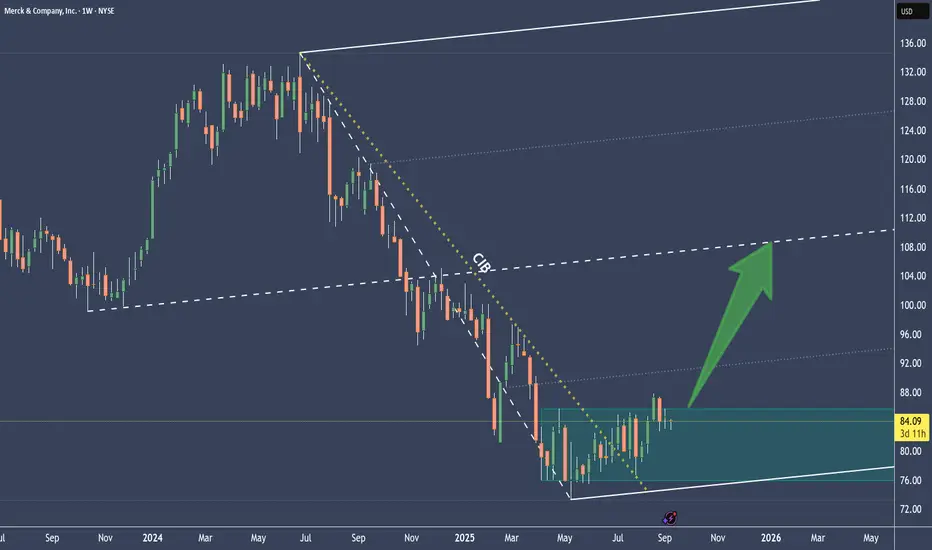
MRK is showing some breakout signsThe white fork is pointing slightly to the upside.
CIB is broken and signals a change in behavior. The pullback to it was very nice - a Eye twinkle? §8-)
Then price opened the door to the upside by peeking through the resistance of the consolidation, asking: "Anybody here to buy me?"...silence...so far.
OK, let's be patient and wait for another sign or hint.
Until the, stalking hat on, as my mentor Shane always said.
--> NO FOMO IN THIS CLASS! <--
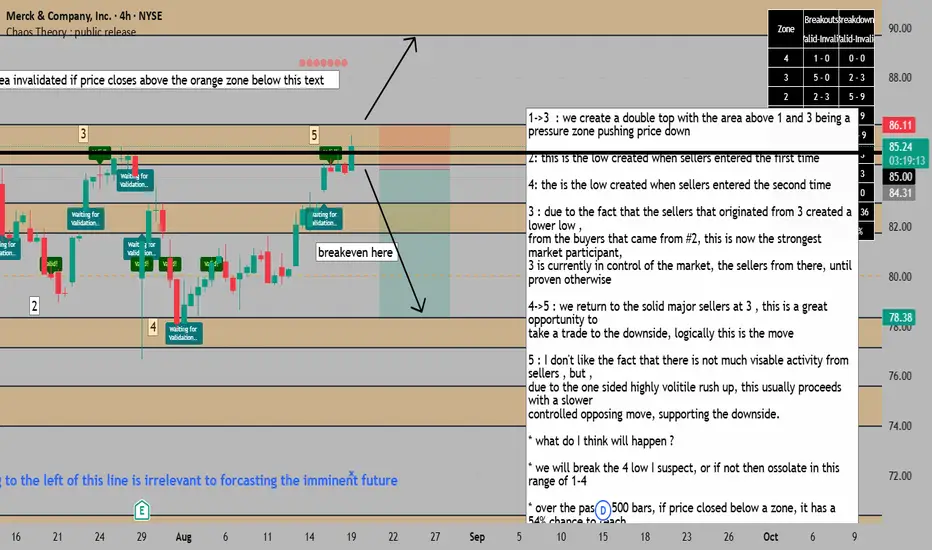
double top includes a solid major high as second top=SELL1->3 : we create a double top with the area above 1 and 3 being a
pressure zone pushing price down
2: this is the low created when sellers entered the first time
4: the is the low created when sellers entered the second time
3 : due to the fact that the sellers that originated from 3 created a lower low ,
from the buyers that came from #2, this is now the strongest market participant,
3 is currently in control of the market, the sellers from there, until proven otherwise
4->5 : we return to the solid major sellers at 3 , this is a great opportunity to
take a trade to the downside, logically this is the move
5 : I don't like the fact that there is not much visable activity from sellers , but ,
due to the one sided highly volitile rush up, this usually proceeds with a slower
controlled opposing move, supporting the downside.
* what do I think will happen ?
* we will break the 4 low I suspect, or if not then ossolate in this range of 1-4
* over the past 2,500 bars, if price closed below a zone, it has a 54% chance to reach
the next orange zone below. you can manually verify this via reducing the lookback
period. this is not a great confluence as its almost a coin flip, but I do like that we can
break even after we clear the first orange zone , as a return to this zone up if we
break below would surely be bad news for sellers.
Is Merck Ready for a Rebound?Fundamental Analysis
Financial Performance
Revenue Decline: Q2 revenue fell 2% year-over-year to $15.8 billion.
Earnings Drop: Adjusted earnings per share decreased by 7% to $2.13.
Key Product Challenges
Keytruda Competition: Facing increased competition for its top cancer drug, Keytruda.
Patent Cliff: Keytruda’s patent expiration looms in 2028, posing a revenue risk.
Growth Highlights
Winrevair Success: New pulmonary arterial hypertension drug generated $336 million in sales post-approval last year, with blockbuster potential.
Animal Health Segment: Sales rose 11% year-over-year to $1.6 billion, showcasing strength in a leading segment.
Pipeline and Innovation
Subcutaneous Keytruda: Aced phase 3 studies, extending patent protection.
Pipeline Expansion: Enhanced through licensing agreements, including promising cancer and weight loss therapies.
Innovation Potential: Likely to develop new therapies to offset Keytruda revenue risks.
Dividend Profile
Forward Yield: Offers a 3.85% forward dividend yield.
Dividend Growth: Increased dividends by 39% over the past five years.
Investment Appeal: Remains attractive for dividend-seeking investors.
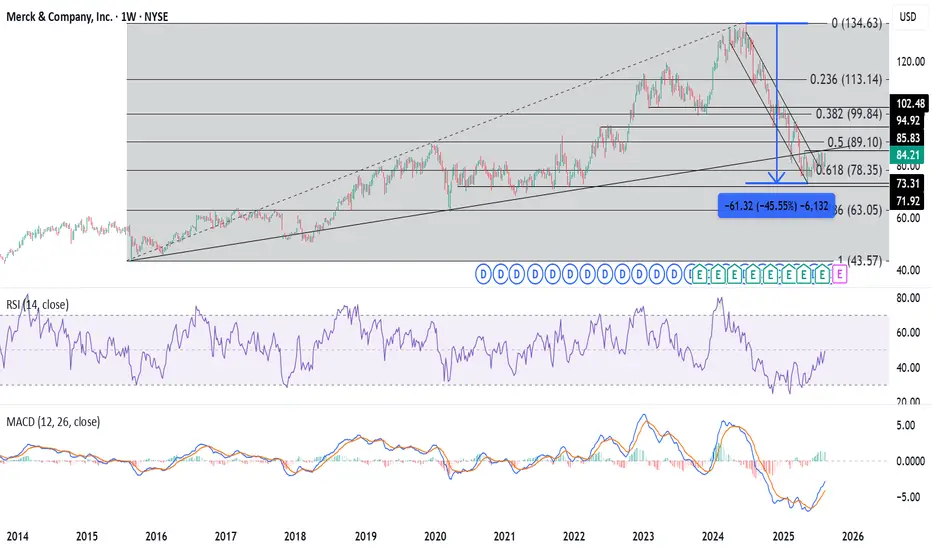
Technical Analysis
The stock price has fallen by over 45% from its ATH of $134.63 in June 2024. The price seems to be consolidating within the range of $74-$86 from April 2025. Moreover, the consolidation seems to be coinciding with the trendline support and 0.618 retracement level at $78.35 of the price rise from $43.57 in August 2015 to $134.63 in June 2024. Further, the daily RSI is just above 60, indicating that a rebound may be near the corner.
Entry: Above $86
Targets: $94.92, $99.84, and $102.48.
Stop Loss: $78.35-$77.
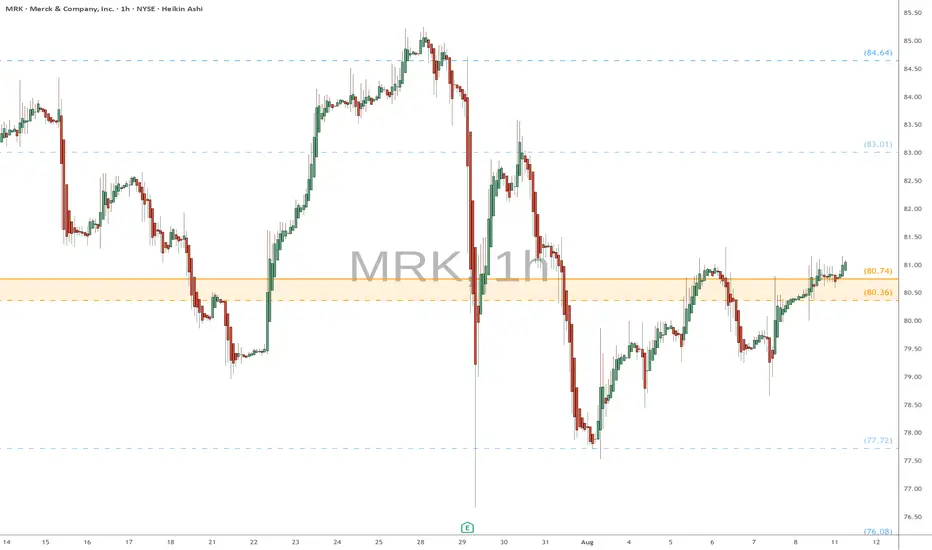
MRK eyes on $80.36/74: Double Golden zone could mark the bottomPharma has been struggling with Trump's tariff threats.
This one is orbiting a Double Golden zone at $80.36-80.74
Looking for a clean Break-n-Retest for possible long entries.
Can Global Chaos Fuel Pharmaceutical Giants?Merck's remarkable growth trajectory demonstrates how a pharmaceutical leader can transform global uncertainties into strategic advantages. The company has masterfully navigated geopolitical tensions, including US-China trade disputes, by diversifying supply chains and establishing regionalized manufacturing networks. Simultaneously, Merck has capitalized on macroeconomic trends such as aging populations and rising chronic disease prevalence, which create sustained demand for pharmaceutical products regardless of economic fluctuations. This strategic positioning allows the company to thrive amid global instability while securing revenue streams through demographic tailwinds.
The foundation of Merck's success lies in its innovation engine, powered by cutting-edge scientific breakthroughs and comprehensive digital transformation. The company's partnership with Moderna for mRNA technology and its continued expansion of Keytruda's indications exemplify its ability to leverage both external collaborations and internal R&D prowess. Merck has strategically integrated artificial intelligence, big data analytics, and advanced manufacturing techniques across its operations, creating a holistic competitive advantage that accelerates drug development, reduces costs, and improves time-to-market efficiency.
Protecting future growth requires fortress-like defenses of intellectual property and cybersecurity assets. Merck employs sophisticated patent lifecycle management strategies, including aggressive biosimilar defense and continuous indication expansions, to extend the commercial life of blockbuster drugs beyond their primary patent expiry. The company's substantial cybersecurity investments safeguard its valuable R&D data and intellectual property from increasingly sophisticated threats, including state-sponsored espionage, thereby ensuring operational continuity and a competitive advantage.
Looking forward, Merck's sustained momentum depends on its ability to maintain this multifaceted approach while adapting to evolving market dynamics. The company's commitment to ESG principles and corporate social responsibility not only attracts socially conscious investors but also helps retain top talent in a competitive landscape. By combining organic innovation with strategic acquisitions, robust IP protection, and proactive risk management, Merck has positioned itself as a resilient leader capable of converting global complexity into sustained pharmaceutical dominance.
MRK potentially enters the Wyckoff accumulation phase this week.The weekly chart points strongly towards a stock emerging from a prolonged Markdown Phase and potentially entering Accumulation (Phase C), with signs of strength appearing.
Merck is basically yelling 'buy me' across all timeframes, so I'm jumping into a long call

MRK eyes on $80.36/74: Double Golden zone break to end DownTrendMRK and all pharma has been dropping forever.
Just pierced the Double Golden zone yet again.
Break and Hold of this zone will say "bottom".
.

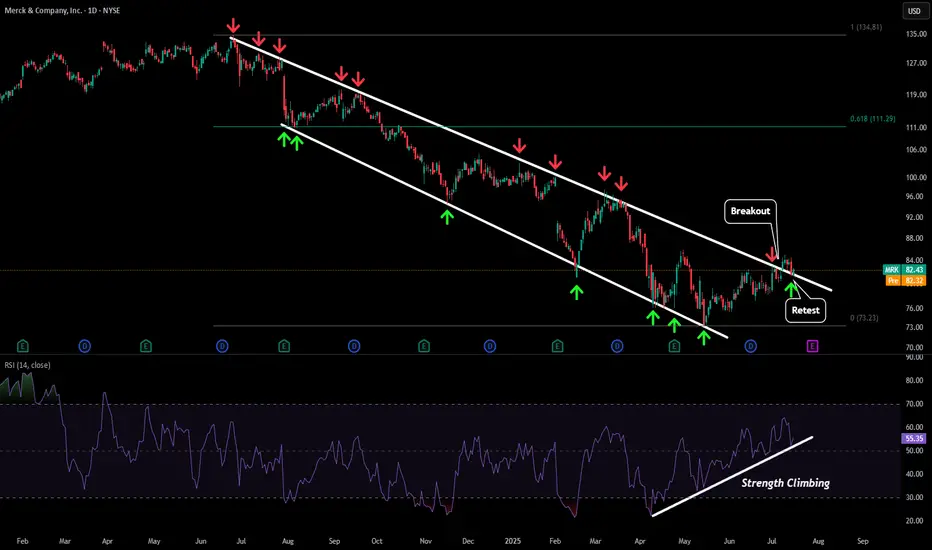
MRK - Retesting BreakoutAfter being in a downtrend for almost a year things finally look like they are starting to turn around for MRK.
Recently price broke the downwards sloping resistance and has retested that level as a new support level. We have also seen strength increasing on our daily RSI bringing some life back into this stock.
Our first price target to the upside would be out LTF target around $88 followed by our 0.618 target around $111.
If we see some serious strength and price climb above our previous ATH we could even see a move towards the $172 level.
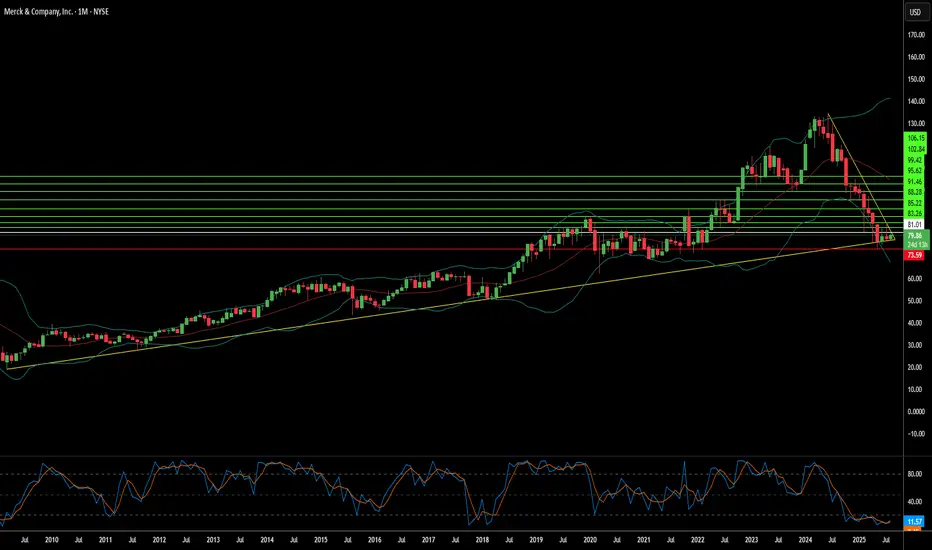
MRK Wave Analysis – 14 July 2025- MRK reversed from the support zone
- Likely to rise to resistance level 85.00
MRK recently reversed up from the support zone surrounding the long-term support level 73.45 (which has been reversing the price from the start of 2020, as can be seen from the weekly MRK chart below).
The upward reversal from the support level 73.45 started the active long-term impulse wave III.
MRK can be expected to rise to the next resistance level 85.00 (former top of wave (4) from May) – from where the price is likely to correct down.
MRK Buying Opportunity!MRK is currently undervalued. The stock price dropped approximately 45% from June 25th of last year to May 15th of this year. At present, the price has bounced off a long-term weekly trendline that has been respected since 2009, indicating a strong rejection zone.
Additionally, on the daily timeframe, the long-standing bearish channel was broken on July 8th. This breakout suggests a likely continuation to the upside. A conservative and highly probable price gain of around 30% is expected from here.

Long $MRK- NYSE:MRK is a quality compounder selling at a discount.
Year | 2025 | 2026 | 2027 | 2028
EPS | 8.90 | 9.72 | 10.65 | 10.38
EPS% | 18.36% | 9.21% | 9.54% | -2.52%
Conservative forward p/e should be 10
Fair Stock value:
EPS | 8.90 | 9.72 | 10.65 | 10.38
Price | 89 | 97 | 106 | 103
Positive Suprises or rotation into healthcare by fund manager would leead to forward p/e of 15
EPS | 8.90 | 9.72 | 10.65 | 10.38
Stock price | 133 | 145 | 159 | 155

MRKEntry Zone: $81.50 to $80.00 (Potential accumulation area for buyers).
Key levels within this zone: $81.51, $81.53, $80.57.
Immediate Resistance: $83.07 (today’s high).
Higher Targets:
$92.63 - $93.26 (First target zone).
$97.36 - $98.25 (Second target zone).
$100.55 - $101.73 (Major resistance zone).
Stop loss 72.00

AAA - Setup from the bottomInverse head and shoulders pattern on the daily timeframe and if you were to break it down further to 12hr it should be also clear.
Monthly rsi sharply bounced back below an RSI of 30, weekly rsi has been below 30 rsi for multile touches
rsi line and rsi moving average crossover indicating change in direction of trend"
increased volume will support this
macd and signal line crossover
macds histogram shows sign of bullish momentum that could grow.


$MRK, Long, TP>15-25%NYSE:MRK , Long, TP>15-25%
Fundamentally the stock is good.
Choose an entry point and do not forget about a protective order if you are trading with leverage.
Don't risk it if you're not sure.
Good luck to everyone.

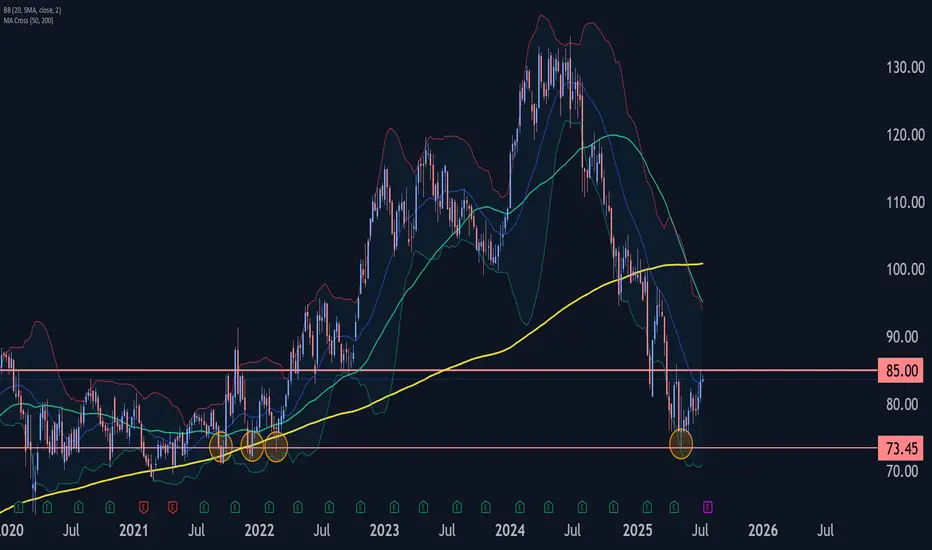
Merck Wave Analysis – 19 May 2025
- Merck reversed from support area
- Likely to rise to resistance level 80.00
Merck recently reversed up from the support area between the long-term support level 73.35 (which has been reversing the price from the middle of 2020) and the lower weekly Bollinger Band.
The upward reversal from this support area created the weekly Japanese candlesticks reversal pattern Long-legged Doji.
Given the strength of the support level 73.35 and the oversold weekly Stochastic, Merck can be expected to rise to the next round resistance level 80.00.

Merck & Company Potential Post Tariff Resolution Bullish RallyWith potential developments towards the resolution of global tariffs and pharma being defensive in general, MRK price action seems to exhibit signs of a potential Bullish reversal breakout as the price action may form a prominent Higher High with multiple confluences through key Fibonacci and Support levels which presents us with a potential Non-Leverage hold opportunity.
Entry: (Buy 1 CMP 76.2 & Buy 2 87.6)
Stop Loss: 45 or 0 (depends on trading style as Non-Leverage Buy & Hold is recommended)
Potential Range for Targets: 130 - 170

Buy MRK Merck being a Pharma company which belongs to a defensive sector is a good buy around 69$ levels. Has a P/E of less 10 and dividend of 4% at current price can be a good long term hold who targets passive income with dividend.
For swing trade , buying at 69-70 levels and target 20% to sell at 85 levels
