Earnings in AMEarnings tomorrow before market opens.
Price is below the .236 and above the .382 of the trend up.
ABC/D pattern that could fail if there is an earnings miss. Analysts appear mixed on earnings results.
Possible stop under C. Target is D.
No recommendation.
Trade ideas

$AXP - Long Trade Idea$AXP
This ticker popped up on my screener set based on strength.
As long price is above the swing high point created by the first low in a double bottom, target is $211.
No trade at the moment as I wait for potential pullback to 165/166 zone.
Noticeable pattern: double bottom

Long American ExpressWhy buy American express?
1 - because I said so
2 - It's an American Bank who respects Julius Caesar more then Canadian banks
3 - It's on a clear uptrend
4 - ask Chat GPT to dumb down for you the theory of reflexivity by George no Soros
5 - I said so
6 - the price is holding above the 23.6% Fibonacci (God's math) retracement level
7 - because I said so
8 - it's undervalued from a Fundamentals point of vue and they invest in blockchain companies (most banks don't bother)
9 - They paid for my baller 1st class Lufthansa ticket to Paris with stop in Munich, Hostel Costes with supermodels Sep 2-5 and Hotel du Palais in Biarritz that my grandson once built for his love Princess Eugene

American Express to All-Time Highs?AXP is showing pretty clear signs of all time highs coming by June-ish.

AXP WEEKLY (AMERICAN EXPRESS COMPANY)RULES:
-If price break Point 2, 4, 6, or 8 cancel the setup
-Price needs to break Point 1, 3, 5, or 7 to confirm the setup
When price reach the 100FE(BLUE BOX) it normally does a pullback/retest or reversal
The market can Truncate(fall short)

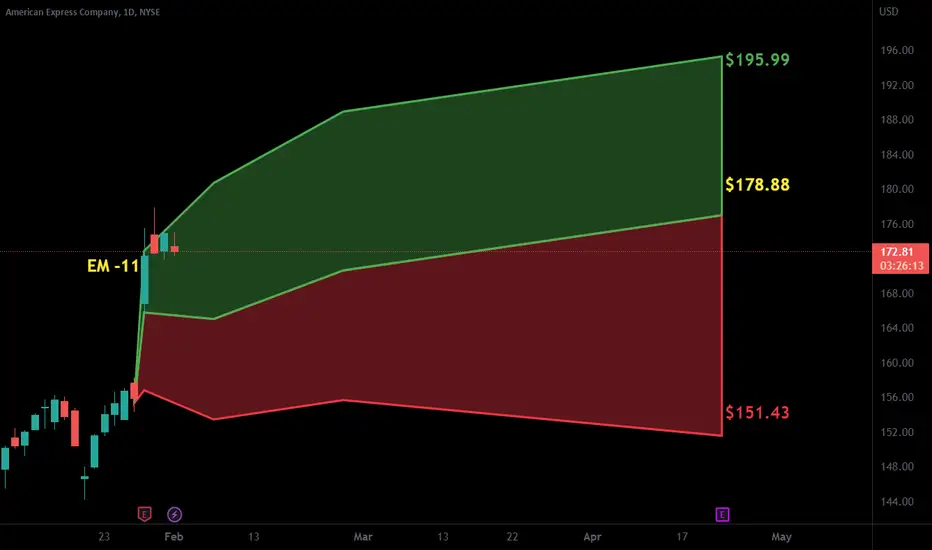
Neutral on AXP - Watching the levelsThe P&L is for the reference of entry, potential upside and cut loss point. The dates on it have no relevance.

$AXP with a Bullish outlook following its earnings #Stocks The PEAD projected a Bullish outlook for $AXP after a Positive Under reaction following its earnings release placing the stock in drift A with an expected accuracy of 66.67%.

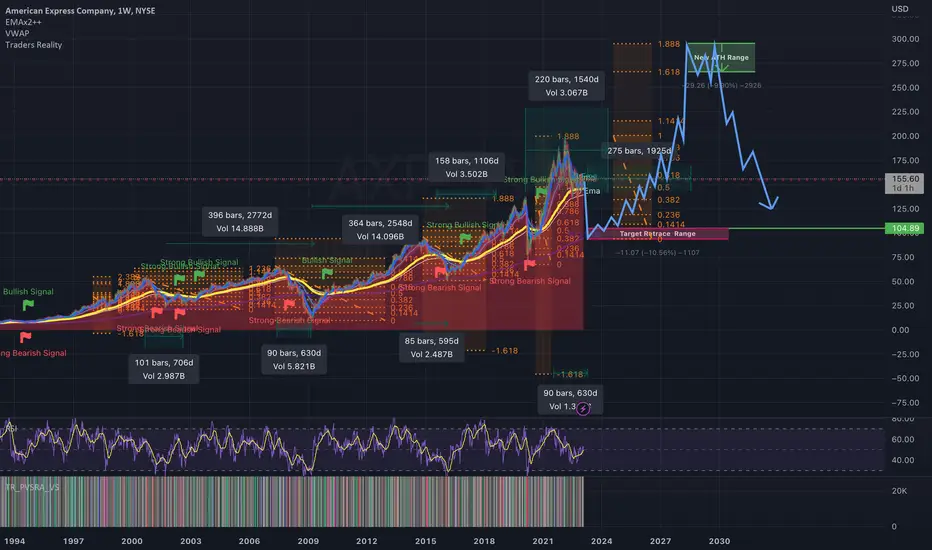
AXP historical cycles and future price projectionsThe peaks and valleys of the AXP chart are extremely consistent over time. Every 7 years we see a cycle where we achieve a new ATH and retrace sharply before repeating the cycle. The time ranges in which the elements of this pattern play out are shown. The time it typically takes from peak to low and the time from low to peak. Based on these consistent time and price patterns, this shows my prediction for upcoming cycle low and the following cycle peak. The 7 year cycle is known as the Shamita. It plays a fundamental part in the ebbs and flows of the global financial markets.
Amex (AXP) bullish scenario:The technical figure Triangle can be found in the daily chart in the US company American Express Company (AXP). American Express is an American multinational financial services corporation specialized in payment cards. It is one of the most valuable companies in the world and one of the 30 components of the Dow Jones Industrial Average. The Triangle broke through the resistance line on 25/01/2023. If the price holds above this level, you can have a possible bullish price movement with a forecast for the next 18 days towards 165.00 USD. Your stop-loss order, according to experts, should be placed at 144.26 USD if you decide to enter this position.
American Express Company AXP is set to report its fourth-quarter 2022 results on Jan 27, before the opening bell.
In the last reported quarter, the diversified financial services company’s adjusted earnings per share of $2.47, primarily due to continued business momentum and a solid revenue stream. American Express also benefited from better volumes and higher Card Member spending, due to a significant increase in Travel and Entertainment spending. However, the positives were partially offset by higher operating costs.
Risk Disclosure: Trading Foreign Exchange (Forex) and Contracts of Difference (CFD's) carries a high level of risk. By registering and signing up, any client affirms their understanding of their own personal accountability for all transactions performed within their account and recognizes the risks associated with trading on such markets and on such sites. Furthermore, one understands that the company carries zero influence over transactions, markets, and trading signals, therefore, cannot be held liable nor guarantee any profits or losses.

American Express rises amid negative pressuresAmerican Express's stock (AXP) rose in the intraday levels, touching the resistance of the 50-day SMA, amid the dominance of the main downward trend in the short term, while the RSI reached overbought levels.
Therefore we expect the stock to return lower, targeting the first support at 142.72, provided the resistance of 153.84 holds on.

Rejection by the 100sma and 50sma on the weeklySpent the last 5 weeks trying to break the 100sma (orange line) with no success. Broadly, it has been trying to break the 50sma (teal line) since June/July! Now both moving averages are converging.
It'll be important to see how this weekly candle close. If it resembles anything like the tombstone doji that we see now during the mid-week, it will likely fall.

AMERICAN EXPRESS C- BEARISH SCENARIOOver the past year, many American Express Company insiders sold a significant stake in the company. The biggest single sale by an insider was when the Chairman & CEO, Stephen Squeri, sold US$8.6m worth of shares. Not only that but the company`s local unit in Australia (AmEx) was taken by the Australian securities regulator for a misleading credit card program.
The expectations are for a breakout of the local trend and a continuation of the major downtrend.
Price target $132
Risk Disclosure: Trading Foreign Exchange (Forex) and Contracts of Difference (CFD's) carries a high level of risk. By registering and signing up, any client affirms their understanding of their own personal accountability for all transactions performed within their account and recognizes the risks associated with trading on such markets and on such sites. Furthermore, one understands that the company carries zero influence over transactions, markets, and trading signals, therefore, cannot be held liable nor guarantee any profits or losses.

#AXP to 178$?Hello dear Traders,
Here is my idea for #AXP
Price closed above yellow line (previous month high)
Price closed (15min Chart) above purple trigger line to enter trade.
Targets marked in the chart (black lines)
Invalidation level marked with red line
Good luck!
❤️Please feel free to ask any question in comments. I will try to answer all! Thank you.
Please, support my work with like, thank you!❤️


$AXP with a Bullish outlook following its earnings #Stocks The PEAD projected a Bullish outlook for $AXP after a Negative over reaction following its earnings release placing the stock in drift C.

Short idea #13Hey all, I really like the look AXP is giving for shorts here. I would like it to get *slightly* higher, but I suspect it will when SPY reaches $389. I think this name is going to be a very solid short through November, and I am surely going to play it.

$AXP with a Bullish outlook following its earnings #Stocks The PEAD projected a Bullish outlook for $AXP after a Negative over reaction following its earnings release placing the stock in drift C.

Short term bullish on American Express. AXPWe are not in the business of getting every prediction right, no one ever does and that is not the aim of the game. The Fibonacci targets are highlighted in purple with invalidation in red. Confirmation level, where relevant, is a pink dotted, finite line. Fibonacci goals, it is prudent to suggest, are nothing more than mere fractally evident and therefore statistically likely levels that the market will go to. Having said that, the market will always do what it wants and always has a mind of its own. Therefore, none of this is financial advice, so do your own research and rely only on your own analysis. Trading is a true one man sport. Good luck out there and stay safe.

AXP: Broadening with H&S ConfirmationMain Pattern: Weekly Broadening
the confirmation is on the pullback of the fifth retracement, and it happened with head and shoulders

AXP low rideseemingly the most support so far that ive seen, axp seems like a trooper and through the downtrend should sustain value pretty decently compared to the market as a whole. strong quarterly support below around 125 will most likely be tested, if it holds things are positive

AXP swing short ideaHey all, I'm not playing this name currently, but I have in the past. I'd look to either exit any AXP long or swing short if I were to play this name- it is backtesting a major trendline, is extended, and is now in a downtrend. This recent rally changes nothing technically- it is a bounce in a larger downtrend, and should present a solid shorting opportunity for those who play it! I might add that I expect this thing to revisit $90/share.

$AXP with a Bullish outlook following its earnings #Stocks The PEAD projected a Bullish outlook for $AXP after a Positive over reaction following its earnings release placing the stock in drift B with an expected accuracy of 50%.
