CAT realigns the squiggle lines and makes a moveI start a lot of trades out by looking at the 30m chart to see if it appears to be doing something "new", very much like CAT did today.
She finally got the squiggly lines in a nice and tight formation and made haste to start closing time periods higher. As much as I really feel psyched out by the slow grind, I really had to fight myself to just hold this overnight. After all, the premise is, when a trade works right out of the gate, you'd say you've got to hold it.
I've spent a lot of time looking for a particular sequence on this time period within context of "finding a low". Consider it the formation of a double bottom. Price was correcting, but then makes 2 bullish candles in a row. Ideally somewhat tight and within a range, but clearly as to say that the buyers are stepping in. Seeing a Red candle to retrace some of the two without closing below, and then a follow-up Green candle, and I'm taking that against the low that was made.
But when I saw CAT make that kind of close over many hours of prior price action and aligned it with the 4 hour chart, mm mm mm, had to be in that.
The nuance will be where you define a Target and whether you'd be able to hold through a downward thrust. Hard to think that the Bears will just let it run.
The alignment with the catch-up that we appear to be getting in the DIA and it looks good to me.
Caterpillar Inc.
No trades
Trade ideas


$CAT Chart IdeaTough to say which direction the daily chop breaks out of, however my main theory is that we will see a test of both the support and resistance TL's at least once before a breakout of this consolidation. The reason I say this is because we only have two points confirming the TL on both sides so far and it looks like we will consolidate in this pennant for the better part of July so we have some time.

$CAT Chart IdeasMy leading theory is bullish because of the wick on the last candle and the gap up on 7/9. Otherwise there is a bit of room to fall before it gets eaten up.


Weekly Outlook! 7/12 - 7/16Here is what stocks we are looking at for the coming week! As well as a recap of last week's video!
NYSE:CAT
Looking for another swing high off of lows. Looking to get a confirmation for the break of it's current bullflag pattern over the $220 level.
NASDAQ:NVDA
NVDA has been range bound the last two days between $806 and $788. We will be looking for a range break in either direction of those levels
NASDAQ:ROKU
Nice dip here after the recent run we have seen. Looks like we got a break of resistance and will look to catch the next move higher over the $434 level
NYSE:YUM
Nice trend resistance break on Friday, looking to catch a move over a break of $119 for continuation
NASDAQ:EBAY
Nice bullflag pattern forming here at highs, will look to take the next move up after a break of the $70 level

CAT Long 210.50Daily looks good stoch heading up
higher lows need more vol
Weekly looks great turning up

CAT multiple signals of a big move upCAT has multiple signals aligning for a big move up.
Bounce off the longterm upwards trendline
Big increases in volume at the end of the recent downtrend, indicating a big transition of shares as bears exit and bulls take over
Recent cross-over the 20 period SMA
A higher low was just put in, offering a very tight stop for a large leveraged play
MACD crossover confirmation
The beauty of this play is we're only 2 bars from where the trendline continuation bounce put in a new higher low.
This means we can size up on this play with a natural technical stop very close behind

CAT is ready to rollTech looks tired. X and CLF had phenomenal runs on Friday... We may start seeing money move back into industrials. A CAT begins to turn around, this would make a good 2-week play.

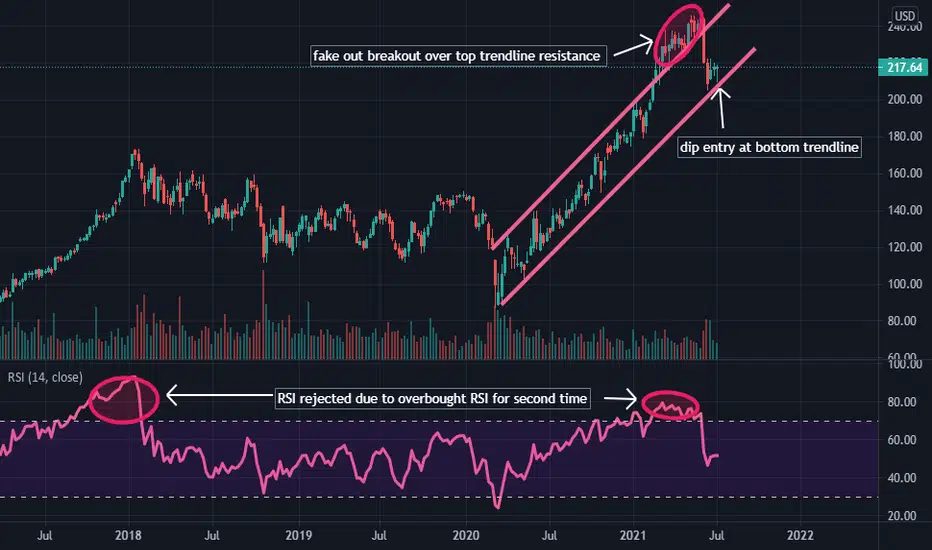
its crazy how well trendlines work :) hello everyone, please leave a like and follow if you enjoy my ideas :) this chart speaks for itself... if you have any questions or comments feel free to dm me or drop a comment below. have a good weekend !

Went long CAT 215.03 Scout Daily stoch heading up
selling getting less on vol strong support 121.49
Weekly just starting to turn I am early
CAT Short - Caterpillar, Inc. - The Double Top DropNYSE:CAT Short - Caterpillar, Inc. - The Double Top Drop
This short biased thesis is based on the following factors:
A double top that was recently formed and confirmed
A Bearish Three Black Crows candle stick pattern followed the second top (of the double top)
A large series of dark pool prints totaling around $882M came in on June 25th, all around the $216.31 price level. Although we do not know the nature of this trade, we are currently trading under this level and continued downside price action will further increased the probability that this trade was a sell.
Possible Threats:
The $212.62 fib defined level may show support where price action may struggle or bounce from.
Short term tactical sentiment for XLI is starting to recover from a bearish downtrend and may show upward momentum from here that could lift CAT up enough to hit the Stop Loss.
That nature of the large dark pool trades are unknown and can only be inferred.
The June 29 Bar is being used to define the following trade parameters:
Short Entry: $214.58
Stop Loss: $218.71
Possible Targets:
$207 - First meaningful fib level
$200.17 - A previous trend high that was used as a fib definition point
$197 - Based on a fib level that has show to have acted as reasonable resistance and support
$190 - Based on the rounding to a whole number on the closest fib level
Other targets can be based on the fib levels show in the chart or by drawing support lines
This thesis/idea is just my opinion based on the information discussed within. None of it should be looked as a recommendation or as financial advice.
NYSE:CAT Daily Chart
NYSE:CAT Weekly Chart


CAT - Long (fixed)pretty straight forward here - infrastructure bill play. retrace back to golden pocket $235 area, and then we see. Target $235, $245, and $263
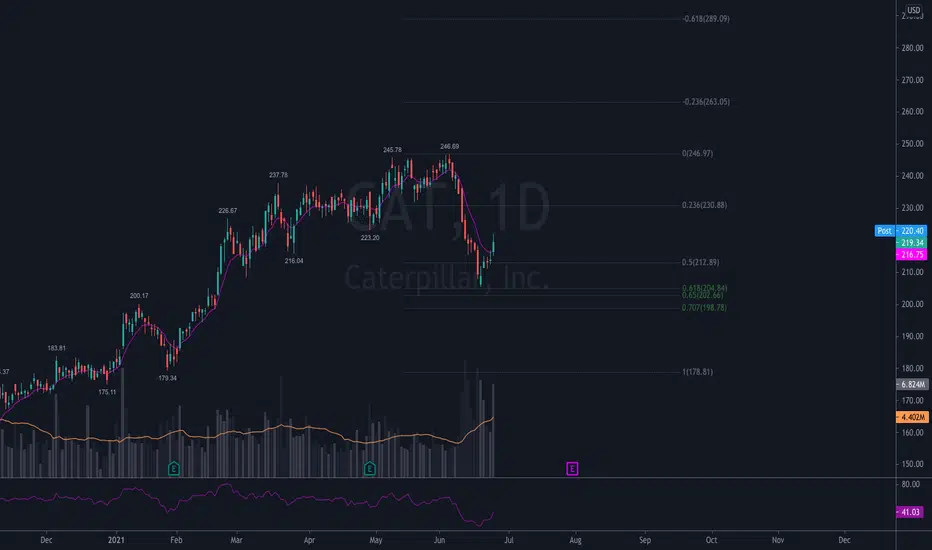
CAT - Longpretty straight forward here - infrastructure bill play. retrace back to golden pocket, $235 area, and then we see.

wave A down has ended look for new highs We have just bottomed in wave A at a perfect .618 we will now see a wave B to above 250 by late july wave C CRASH SEPT TO OCT I am net long calls in cat de hd low cost pg now

boomer stock do or die will the trendline hold or will this boomer stock face a possible grind to goblin town. long

$CAT Trade Idea$CAT Trade Idea
$CAT consolidating at the lows of the recent pullback forming a double inside day pattern.
Above 221 with Market Strength, the 6/25 225c can work targeting 224,226, and 229.
Under 216 the 6/25 215p can work targeting 213, and 210.
@TradingView
@KyleTrades86

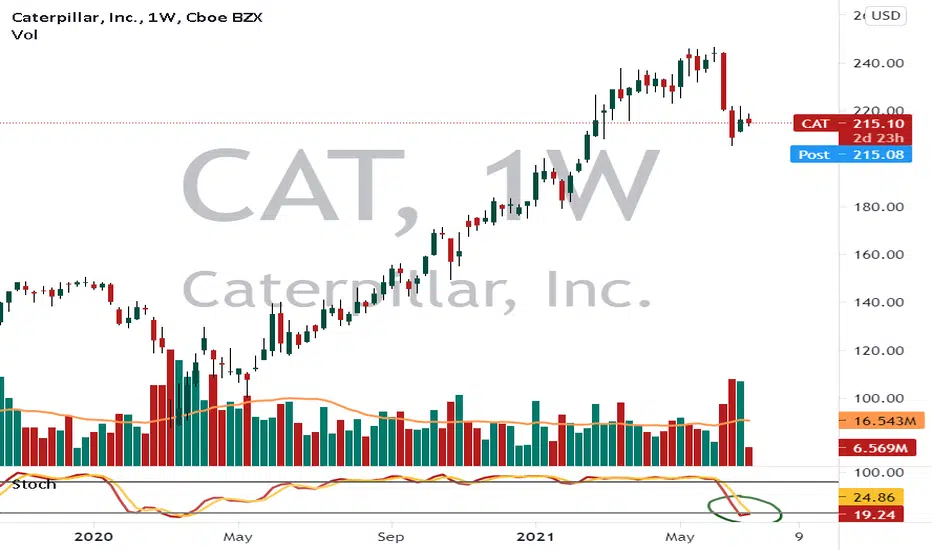
Caterpillar Is OversoldCaterpillar was one of the favorite value / cyclical plays coming out of 2020’s mini-depression. Now, the Dow Jones Industrial Average member just had its biggest pullback in a long time.
This chart highlights the deeply oversold condition on stochastics, which fell on Monday to their lowest level in over a year. CAT also just had its worst week (-9.6%) since the depths of the coronavirus crash in March 2020:
The main catalyst for the selloff appears to be the failure of a high-dollar bipartisan infrastructure bill in Congress. However, there were signs of trouble on the chart – especially the bearish divergence on MACD.
However now that a liquidation has occurred, bulls may like the chart. Aside from the oversold stochastics, CAT is holding the March 2021 low around $216. Will this level become support again?
Given the sharpness of the drop and the high volume, it may still be early in the process to jump into CAT. However, it remains one of the most important cyclicals / industrials in the market. Potential buyers may start getting interested – especially with a new quarter getting close.
TradeStation is a pioneer in the trading industry, providing access to stocks, options, futures and cryptocurrencies. See our Overview for more.
