CLF - a second chance to follow the trendI posted a chart on my investment in CLF prior to this chart.
The good news today is the announcement that the company used free cash to retire the series B preferred stock related to the ArcelorMittal deal thus effectively reducing proforma share count by 10%. This is a positive earnings driver for the share price upward over the next two quarters.
The $22 strike, 2023 leap puts I sold are in the money.
This is a move which is more than twice the 20 day average true range.
To follow the trend, additional investment of an additional 2% of total account value is required.
I like my chances.
all the best
Trade ideas

$CLF Cleveland Cliffs Trade above 100ma.
Hopefully you find the chart helpful in terms of Supports & Resistance etc.
we refrain from adding commentary on the chart as that is reserved for our members and we are very conscious of not giving financial or trading advice.
Thank you for taking time to consult our chart and we would really appreciate a like, follow or comment.

Symmetric triangleIt looks like a breakout is about to happen.
The overall picture looks bullish.
We got above the P-Pivot point, also reclaimed the 20 EMA once again.
As for the indicators; RSI and MACD indicate more upward movement.
The only concern is that the price is stuck between the 2 EMAs.
We have to get above the other one as well, with high volume!
Short term price target: 23,49
Support: 21,16

Run into earnings?Going back almost a year the MACD is at the same crossover point from a big run after positive earnings last year. The only thing holding this back is the current disaster the government has on market conditions. I am still bullish with hopes we see a run to near all time highs in the next couple of months if earnings is positive.

Buy CLF 28/9/2021You can buy CLF target 25.63 stop loss 18.44
money management your responsibility.
I recommend entering a maximum of 10% of the portfolio.
Good luck

CLF Double Bottom wLooks like a good reversal going into another bullish wave. Bounced at key support levels and w/ fears of inflation it wouldn't be surprising to see more volume going into other sectors such as non-energy minerals.

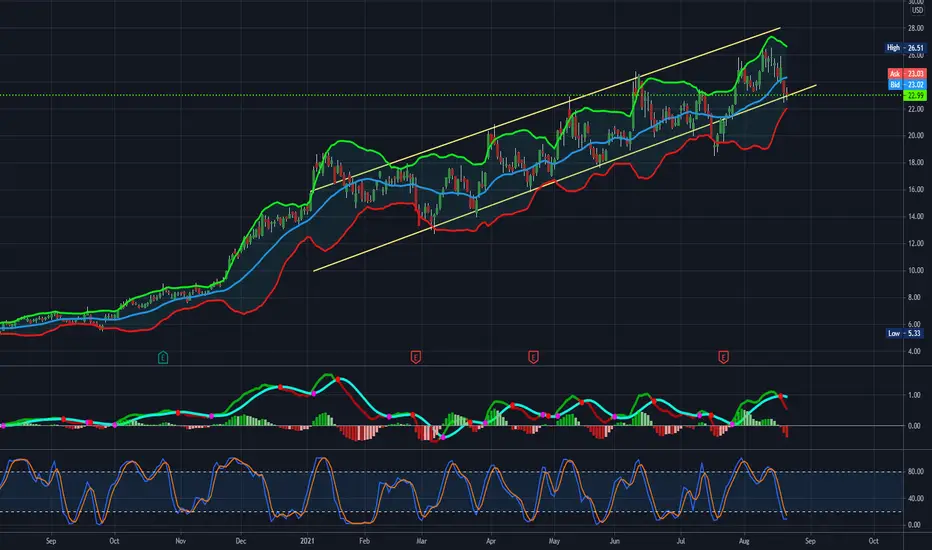
Bullish Continuation? CLF has been on an upward trend for several months now following a trading channel very nicely in the stand deviation ranges. The stock has recently been on the decline pushing outside of the dev channel today. Is this sign of a reversal of trend to the downside or a continuation of its recently predictable pattern to the upside? Just an idea it continues with good upside.

CLF Channel PlayThesis: Playing the bounce off of the bottom of this channel. Might dip just a bit more first to $23.
Target: $28
Trade vehicle: 9/17 $25 calls @ $0.54

CLF modified Head and ShouldersCLF, despite a recent jump in HRC1! steel futures, continues to selloff.
It's day candles reveal a 3-peak pattern commonly understood to be a "Head and Shoulders".
Despite the modified (angled) neckline, I still read this pattern as incredibly bearish.
CLF is also quite close to invalidating a strong 1y trendline (pink) for the second time in the last quarter.
While I personally don't have any interest in a short position for such a fundamentally strong stock, this pattern and support break presents enough concern to dissuade me from taking a long position until sometime in September.
My guess is other technical investors will feel the same!
CLF seems likely to stop selling off at the 21.60 level, which is both the 0.5 Fib zone, as well as the end of the neckline for the Head and Shoulders that have formed.
I will wait for strong reversal confirmation before taking a bullish positions. Any long positions should consider the impact of upcoming earnings 10/22, and look to take profits before then.
Fibonacci time zones call for a local top around Oct 14th, about a week prior to earnings, which aligns with historical price action.
MacD and RSI are both moderately bearish and congruent with the Head and Shoulders bear sentiment.

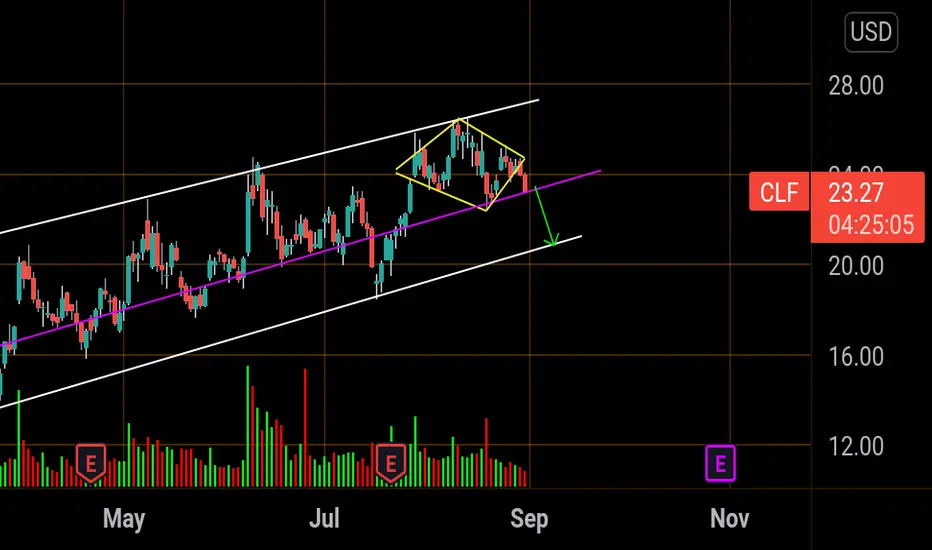
CLF.. bearish diamondWhite lines - Channel
Purple line - Split channel
Bear diamond - Yellow lines
Bear diamond spotted on CLF, Fell through support yesterday but i missed it. Target is channel bottom around 20$. Bounced off split channel today.. good entry below 23.20 -23.00
CLFHere’s another textbook channel play on the ticker $CLF. Currently, we’re at the very bottom of the channel, bouncing perfectly on our line and slightly consolidating. Previously, there was a break to the downside but we saw a rejection at the $19.76 line of support before returning to the ongoing pattern and continuing its momentum to the upside. We don’t see any green candles currently, so there’s a chance it can break and test the new line of support at $21.94. If it does break below $21.94, we’ll be looking for a short-term short position with a goal of the $19.76 line of support that had that rejection. If it breaks further than $19.76, we’ll be looking at a long-term short position of ~$15.06 or below. However, I’m feeling bullish and I’m expecting this to continue its trend in the channel to the upside with a goal of ~$27.44. The flow is looking massively bullish and the RSI is showing room for some more movements to the upside. I’d like to see a bullish engulfing candle sometime soon or a break of the $23.58 resistance level before entering into a long-term bullish position. If it does break, we’ll be holding our bags all the way up to the top.
CLF - Going upAccording to Traders-Paradise Algorithm, this has a high chance of going up as the TakeProfit & StopLoss strategy indicate.
For day traders - 11/8/21: High chance for going up today.

$CLF correction inevitable, still bullish long-termMacD and RSI on CLF calling for a selloff, I think we'll see it follow this ABC type correction pattern instead of a complete dump. If it tests white support line at point (C) I will be adding heavily to September calls. Currently in a short position. MacD is almost identical to every single prior selloff. Ultimately I am long this stock but the short term swing seems undeniable. Assuming ABC correction based on previous correction patterns and timeframes. Fib time zone placed between apex of bull trends.

Cleveland-CliffsVery difficult entry point, but excellent risk management. The stock is still in a long trend, so a trading idea is to retest either the trend line or the support level, which will give us confirmation at the beginning of a short trend and confirm a downward trend.
Let me remind you once again that these are just scripts. If it follows the script, then you can go. Deviations of the script are possible, but it is necessary to redo it competently.
Stop 0.5% Take 1 to 24.
If the scenario works out I will pull up the stop for each previous local maximum.
Don't forget to Like and write comments.

CLF Cycle CompletionI'm anticipating a dip at the bell Wednesday, followed by a climb to the 26.60 or possibly 27.60 area, completing the 4th channel cycle, before earnings.


CLF is clocklikeCLF is like a clock! Is there anything prettier than a stock that oscillates in channel? The peak-to-trough of this oscillation suggests that 5-6 dollar moves are possible. Cleveland Cliffs is an iron ore company that has been on a phenomenal run. There are incredible expectations for earnings as CLF quarterly revenue was up 1014.2%. This would be a unique play buying a call dated after earnings (7/23), but selling before the report. I am not a financial advisor. Play at your own risk.

$CLF | Double Bottom: Buy on Dips$CLF formed a double bottom and looks ready for continuation to the upside
Ideally we buy into a pullback so will be watching $21.60 down to $21 for entries

Triangle CLFTriangle. Honestly could go either way. I want to say LONG but not sure. Bought 15 calls though :)


