DWD trade ideas


Morgan Stanley Nuzzles SupportFinancials have been one of the weakest corners of the market lately, thanks to credit worries and falling interest rates.
Of all the big names, Morgan Stanley has held up the best. It’s down less than 3 percent on the year, compared with drops of more than 20 percent for other key stocks like Bank of America and JPMorgan Chase.
MS has performed better fundamentally because it has more exposure to wealth management. That helped it deliver a strong quarter the last time earnings were reported on July 16.
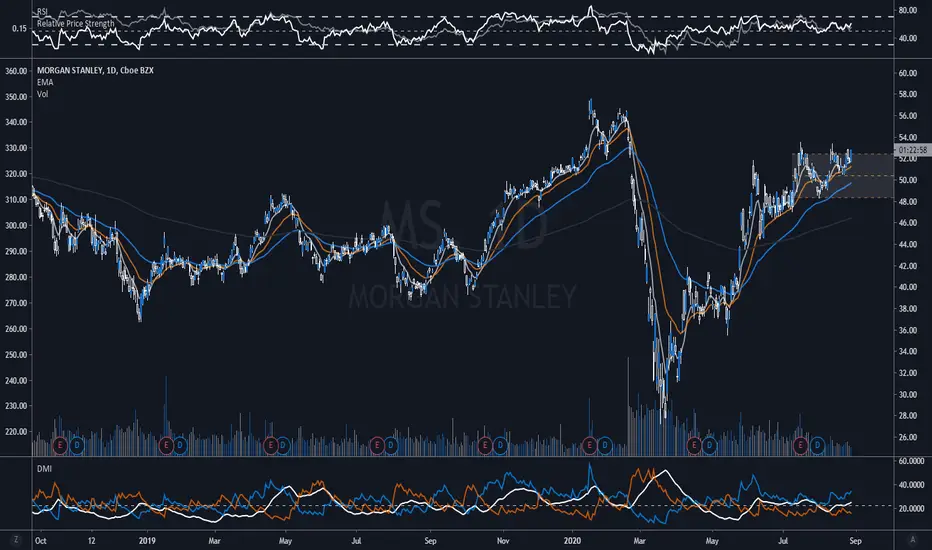
The stock jumped at the time but didn’t go far. One reason was that stochastics were overbought. Another was the fact its 50-day simple moving average (SMA) was below the 200-day SMA.
Both of those conditions have now flipped. Stochastics show an oversold condition, and a “Golden Cross” of the 50-day SMA above the 200-day SMA occurred on July 17.
MS is also showing signs of basing out around the same $49 area that marked the top of its range in late June and early July. Notice the recent hammer candlesticks around that level. It’s also nuzzling the 50-day SMA.
Traders may want to take a long bias as long as MS remains above the 50-day SMA, or the July 31 low of $48.27.


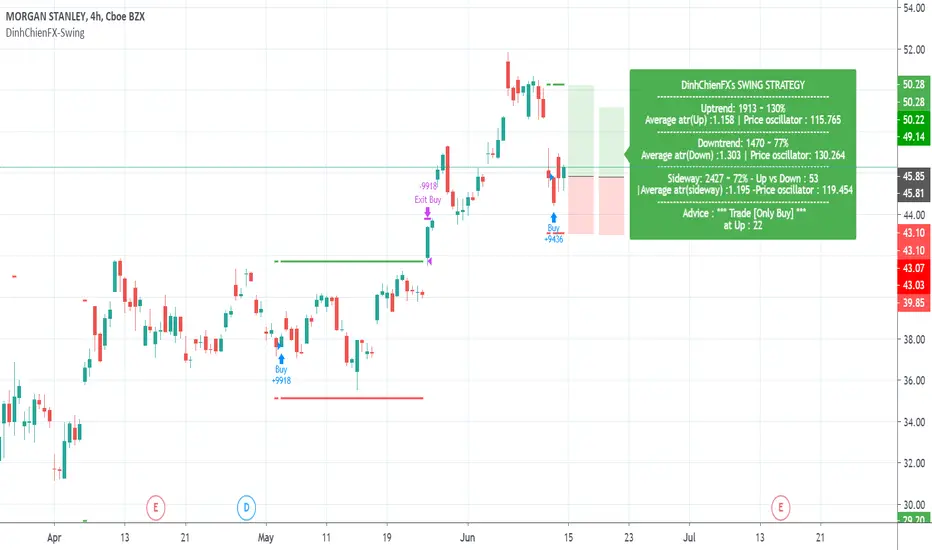
Morgan Stanley (MS) Earnings Estimates Q2 2020Morgan Stanley ($MS) will report earnings 07/16/2020.
The chart above includes the Q2 Earnings Estimates and a Technical Analysis.

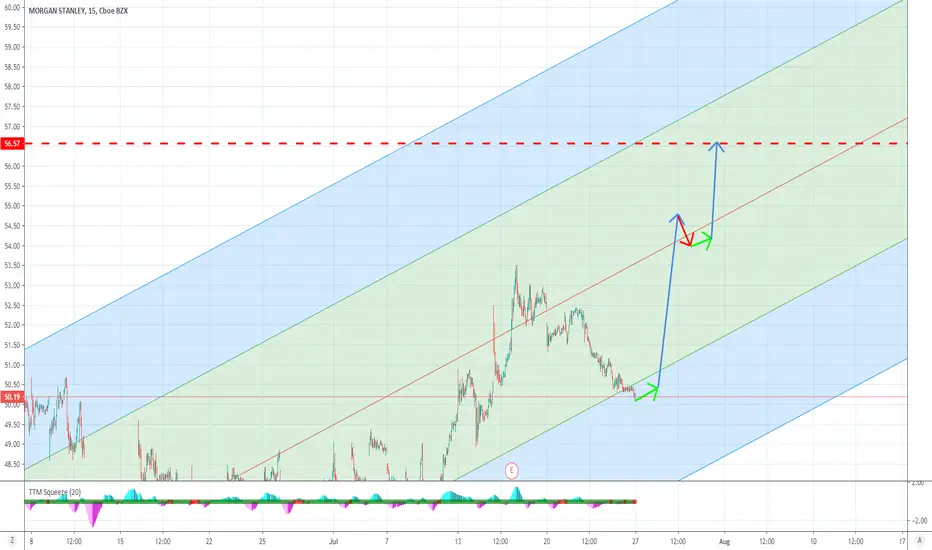
MS Long Trade for week of 7.12MS looking similar to JPM looking for a move higher.
Target points are on the chart.
Stop at: 47.00
Best,
--d0x


BUY for MORGAN STANLEY Hey traders, **DISCLAIMER** content on this analysis is subject to change at any time without notice, and is provided for the sole purpose of assisting traders to make independent investment decisions. MORGAN STANLEY is a bullish probability of pull back to start again on its rise.
Please LIKE & FOLLOW, thank you!


MS - Morgan StanleyOne of the stronger stocks in the Financials sector. Breaking above the $41 area on solid volume.

MS - Potential H+S Pattern - XLF looking weakPotential H+S pattern on Morgan Stanley (MS)
May wish to wait for further confirmation of the breakdown before entering, if you choose to enter now, i would use a close above the right shoulder as an initial exit.
P.S. The H+S pattern i noted on JPM also seems to be developing quite nicely, overall the financial sector (XLF) is one to keep an eye on
-TradingEdge

Seasonality Sell for $MS into May ($XLF, $KRE)There is the potential for a nice selloff in MS (and $BAC) after busting a parallel channel. The banks have been hit during virus.
On May 4 we received a rare 2 million single block trade on MS, which we have splashed and are testing now. We are dropping below. This is a very bearish signal for me.
MAY 6 2020, 10:13 AM EDT
VOL (K) | PRICE ($) | 🔼
--------.-----------.----------
📈 $MS
--------.--(MAY04)--.----------
2,000 | 37.62 | 💔 -0.65%
