Macy’s Stock Surges Despite Recent DeclineKey Highlights
Department store chain Macy’s (NYSE:M) reported 3rd Quarter FY2023 results beating Wall Street analysts' expectations , with revenue down 7.3% year on year to $5.04 billion. On the other hand, its full-year revenue guidance of $23.05 billion at the midpoint came in slightly below analysts' estimates. Turning to EPS, Macy's made a non-GAAP profit of $0.21 per share, down from its profit of $0.52 per share in the same quarter last year.
Shares of Macy’s Inc. shot up 12.4 percent to $14.17 in premarket trading on Thursday as the retailer showed some unexpected strength on the bottom line as it navigated a tough sales environment.
The company’s adjusted earnings per share fell to 21 cents in the third quarter from 52 cents a year earlier. Net income fell 60 percent to $43 million, or 15 cents a diluted share, from $108 million, or 39 cents, a year earlier. Revenues for the three months ended Oct. 28 decreased 7.8 percent to $5 billion from $5.5 billion a year earlier.
Technical Analysis
(NYSE: M ) is trading near the bottom of its 52-week range and below its 200-day simple moving average.
What does this mean?
Investors have been pushing the share price lower, and the stock still appears to have downward momentum.
Trade ideas

M Target ~ $15.9M seems undervalued considering EPS.
Expecting price to retest channel and long term resistance at $15.9.

Looking for a bearish scalp on Macey's.
As you can see here, we are approaching a major imbalance on the hourly chart. I will be looking on the 15 minute chart for a heavy bounce off with good volume and hold it until close for a day trade. As always, thank you for viewing my analysis. #macys #puts #scalp

M rejecting from resistance zone 🐵🙉Break of this trend support and we head to 14.5-13.12 support before any move to the upside..
break past 16.98 and we can see parabolic move to 19-22. Best to wait for clear trigger here, boost and follow for more 💙

Macy's: Bullish Gartley Holding Strong Above Support ZoneMacy is holding above a Support Zone with MACD Bullish Divergence at a Bullish Gartley PCZ and is now trying to crack above $11.50 if it gets above $11.50 it will probably see $20 relatively quickly.

Macy's (M) Long and ShortMacy's tapped the midpoint. A return to $15.14 would setup a reliable auto-buy for round two. Sell 2 lots at the mid-point again.
The perfect mid-point hit and retreat sets up a good short at $16.71 if it gets there.

Macy's Option Trade TAI noticed Macys( NYSE:M ) was way oversold and was overdue for a run at least to 12. This is my documentation for charting this play. I purchased Oct 12, 2023 $12 call. Sold for ~25% profit.
I should have sold the call on Tuesday or Wednesday cause I hit my 20% profit quickly but I was being greedy. Having faith in conviction is one thing but to be a successful trader you need a trade plan and to follow it. Faith gets you posting loss porn on r/WallStreetBets. I have learned to be happy with this cause being greedy has cost me way more money.
Note: The TA was done and tracked on the 5 minute chart but you need to have a time frame of at least 15 minutes when you publish ideas. That is why you see some funny UI glitches.


M Macy's Options Ahead of EarningsAnalyzing the options chain and the chart patterns of M Macy's prior to the earnings report this week,
I would consider purchasing the 16usd strike price Calls with
an expiration date of 2023-9-15,
for a premium of approximately $0.72.
If these options prove to be profitable prior to the earnings release, I would sell at least half of them.
Looking forward to read your opinion about it.

$M on it's last legA little bear flag has formed and it will certainly result in the downside.
If we start worrying about recession this will dump hard.

Macys ( M ) Pre-earnings LongAs can be seen on the 2H chart, Macy's last earnings on June 5th was afavorble beat
resulting in first an uptrend and then a sideways price movement for a month and
a half. Earnings are expected on 8/22/23. Price has had dynamic support at the mean VWAP
anchored in April while the dynamic resistance has been two standard deviations above that
represented by the thin red line. Price is currently midway between resistance and support.
Additional support is the POC line ( with the highest trading volumes ) of the volume profile
beginning at the prior earnings date. Overall I see this as an opportunity to take an options
trade with an expiration a couple of weeks after expected earnings to strike the thin red line
of dynamic resistance at 17 expiring September 1st. Depending on price action in the days
leading up to earnings I may take off half the contracts if they are in decent profit while
letting the other half run through the post earnings period figuring that M could repeat
and jump after earnings.

MACY Stock Chart Fibonacci Analysis 072423 Trading Idea
1) Find a FIBO slingshot
2) Check FIBO 61.80% level
3) Entry Point > 16/61.80%
Chart time frame : B
A) 15 min(1W-3M)
B) 1 hr(3M-6M)
C) 4 hr(6M-1year)
D) 1 day(1-3years)
Stock progress : A
A) Keep rising over 61.80% resistance
B) 61.80% resistance
C) Hit the bottom
D) Hit the top
Stocks rise as they rise from support and fall from resistance. Our goal is to find a low support point and enter. It can be referred to as buying at the pullback point. The pullback point can be found with a Fibonacci extension of 61.80%. This is a step to find entry level. 1) Find a triangle (Fibonacci Speed Fan Line) that connects the high (resistance) and low (support) points of the stock in progress, where it is continuously expressed as a Slingshot, 2) and create a Fibonacci extension level for the first rising wave from the start point of slingshot pattern.
When the current price goes over 61.80% level , that can be a good entry point, especially if the SMA 100 and 200 curves are gathered together at 61.80%, it is a very good entry point.
As a great help, tradingview provide these Fibonacci speed fan lines and extension levels with ease. So if you use the Fibonacci fan line, the extension level, and the SMA 100/200 curve well, you can find an entry point for the stock market. At least you have to enter at this low point to avoid trading failure, and if you are skilled at entering this low point, with fibonacci6180 technique, your reading skill to chart will be greatly improved.
If you want to do day trading, please set the time frame to 5 minutes or 15 minutes, and you will see many of the low point of rising stocks.
If want to prefer long term range trading, you can set the time frame to 1 hr or 1 day.

$M Long Swing Opportunity with Big Price TargetsNYSE:M is in a downtrend channel but I think there is a long opportunity as long as it holds the 15.9 level with targets of 19 and 22.65
-Falling Wedge breakout and retest wedge-line as support
-Bottom of channel bounce with strong green candles
-Buying volume vastly outweighs selling volume from trend
-RSI showing momentum with plenty of room to run
Good idea to wait for a confirmation hold above 16 old support for entry

MACY Stock Chart Fibonacci Analysis 033123Trading Idea
1) Find a FIBO slingshot
2) Check FIBO 61.80% level
3) Entry Point > 17.2/61.80%

M ShortI see clear down trend on M since beginning February. It tests 50MA and can not hold it, broke down . now i close to 200MA and trendline. I guess M will continue downtrend until its earnings 02 Mar 2023

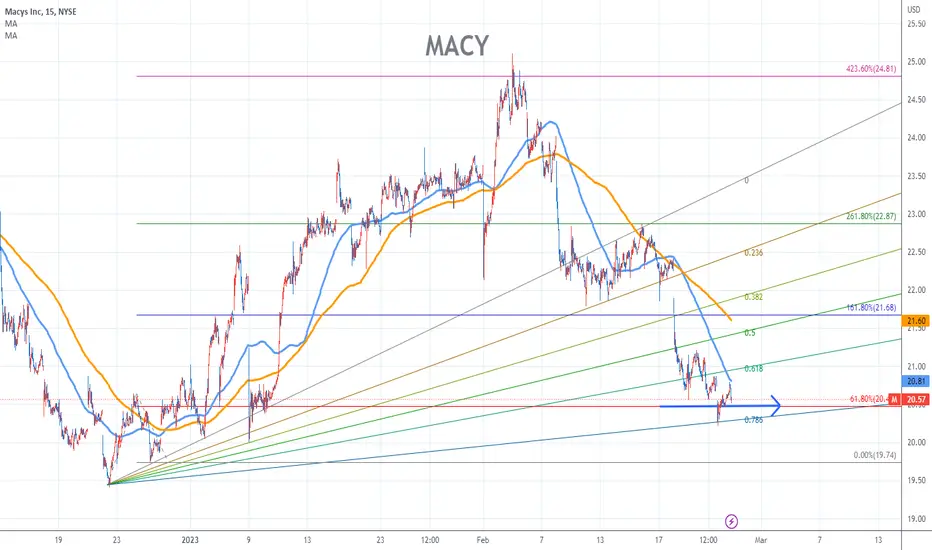
MACY Stock Chart Fibonacci Analysis 022623 Trading Idea
1) Find a FIBO slingshot
2) Check FIBO 61.80% level
3) Entry Point > 20.5/61.80%
macy'sit seems a bearish trend is going to start on M. I guess the price could be reversed from the 23.45-22.81 zone if the price break 23.45 above it could reach to 24.9 level.

M 20P 01/20/2023 1. Yearly bar red, normally the next year going to make a new low
2. recession not going to benefit macy's
Risk:
It MAY pops to 21.75 level to reclaim the resistance if the market bounce recently
Important CPI and unemployee data will be released before next thursday

Short idea #8Hey, I think M drops, and significantly so. I'm not shorting yet, but I'm posting my idea ahead of time. I WILL short this when SPY hits $390

Macys! Coming hot to holiday season !LONG on MACYS!
1st Holiday Season with NO COVID RESTRICTION :)
Algo looks agree on this LONG as well~


make or break level 🥶Macys has been in this downtrend all year, but many other tickers are breaking the 8-10 month downtrend. this can be next!
watching for longs above 22.40, shorts below 19.45
