CRM - Minor Downtrend Line Broken!CRM - CURRENT PRICE : 260.57
CRM previously entered a downtrend following a double-top reversal , which pushed the stock into a prolonged bearish trend. However, current price action shows early signs of trend change as CRM successfully breaks above the minor downtrend line with strong momentum.
Momentum indicators are confirming the shift:
⚡RSI has turned bullish and moved decisively above 50
⚡MACD shows a bullish crossover with improving histogram
With improving trend structure and bullish indicators, CRM may continue its upward recovery. Price may extend toward 278.00 and 296.00 as long as it stays above 242.00 (near EMA 50).
ENTRY PRICE : 260.57
FIRST TARGET : 278.00
SECOND TARGET : 296.00
SUPPORT : 242.00
Salesforce, Inc.
No trades
Trade ideas

CRM watch $262-265: Major Fib zone Break should _POP_ off BOTTOMCRM trying to paint a bottom after getting destroyed.
Testing a well proven dual fib zone at $262.54-265.36
Zone includes Golden Genesis and a semi-major Covid.
.
See "Related Publications" for previous plots such as this EXACT BOTTOM CALL:
Hit BOOST and FOLLOW for more such PRECISE and TIMELY charts.
========================================================
.

Salesforce Inc. surges on earnings beat and AI growth storyCurrent Price: $260.57
Direction: LONG
Confidence Level: 78% (Strong institutional buying, multiple traders highlighting bullish setups despite some legal headwinds)
Targets:
- T1 = $268.00
- T2 = $272.50
Stop Levels:
- S1 = $256.00
- S2 = $252.50
**Wisdom of Professional Traders:**
The collective view from professional traders is leaning bullish right now. Multiple traders are pointing out that even though Salesforce had been a laggard in big tech earlier this quarter, the earnings beat and raised guidance have shifted sentiment sharply. They’re eyeing short‑term continuation patterns, especially with price action now holding well above the $228–$232 bounce zone and pushing toward key psychological and moving average resistance. The consensus is that the AI integration story, combined with fresh analyst upgrades, offers enough momentum to sustain higher prices this week.
**Key Insights:**
Here’s what’s driving this: earnings came in ahead of expectations at $2.91 EPS versus $2.78 consensus, with nearly 10% YoY revenue growth. Several traders highlighted how this confirms Salesforce can still grow double‑digits despite macro headwinds. The AI‑commerce cloud exposure is starting to resonate with institutional buyers, who’ve been seen adding across the $230–$235 area. In the short‑term, traders see a path toward testing the $268–$273 levels before the week’s end if momentum persists. Breakouts above the $250 level have historically triggered quick $10–$15 runs, and market chatter reflects that setup.
One thing I’m watching closely is the resistance confluence around $260–$262, where the 200‑day SMA and recent highs meet. If we clear that decisively with volume, the next magnet is near $272.50, an area mentioned repeatedly by both technical and momentum traders. The legal overhang from the fraud investigation is real, but unless a damaging filing lands this week, the bias is for higher prices.
**Recent Performance:**
This all played out in the price action last week—CRM ripped over 5% after the earnings print and guidance raise, moving from $232 to flirting with the $260 handle. That’s a near‑parabolic short‑term move, but dips have been shallow, showing strong dip‑buying interest. Intraday pullbacks to $258–$259 have been bought aggressively, and volume remains well above the 30‑day average.
**Expert Analysis:**
Traders are taking notice—several professional traders I track suggested the post‑earnings consolidation was a healthy pause and not a reversal signal. They pointed to the MACD histogram turning positive on 4‑hour charts and the series of higher lows since late November as evidence of underlying momentum. A few traders acknowledged overhead resistance near $262, but framed it as more of a speed bump than a wall given the current buying pressure. The support levels they’re working with are tight—anything below $252.50 would invalidate this week’s long thesis.
**News Impact:**
The news flow is heavily supportive of the bullish case. An analyst upgrade train is forming, with some targets moved up toward $330 longer term, and further AI‑related partnership announcements are expected this week. While the SEC investigation headlines injected brief intraday volatility, the market has largely shrugged them off in favor of the growth story. Unless new damaging legal news breaks, the news cycle should continue to act as a tailwind.
**Trading Recommendation:**
Here’s my take: I’d be entering long positions around current levels, $260–$261, with stops just under $256 for tight risk control, and a second layer of protection at $252.50. The primary near‑term target is $268, with $272.50 as the stretch goal if the breakout holds. I’m more confident in this long position than not, given the earnings‑momentum combo and the strong bid from institutions. Monitor the tape for any sudden legal headlines, but otherwise ride the AI‑driven momentum this week.

Salesforce (NYSE: $CRM) Stock: Record Q3 & Breakout SetupSalesforce (NYSE: NYSE:CRM ) delivered a standout fiscal Q3 2026, posting record results driven by explosive growth in Agentforce and Data 360, its fastest-scaling AI and data platforms. Revenue rose 9% year-over-year to $10.3 billion, with subscription and support revenue reaching $9.7 billion, up 10%. The company generated a strong $2.3 billion in operating cash flow, a 17% annual increase, while free cash flow surged 22% to $2.2 billion.
A major highlight was the accelerating expansion in performance obligations. Current RPO hit $29.4 billion, up 11% Y/Y, while total RPO climbed to $59.5 billion, signaling strong visibility into future revenue. Salesforce also raised full-year FY26 guidance to as high as $41.55 billion, supported by the newly completed Informatica acquisition, which enhances the company’s enterprise data capabilities across governance, integration, metadata, and MDM.
Agentforce and Data 360 were the clear growth engines. Combined ARR reached $1.4 billion, soaring 114% Y/Y. Agentforce ARR alone surpassed half a billion, up 330% Y/Y, with over 9,500 paid deals and more than 3.2 trillion tokens processed through its LLM gateway. Data 360 saw massive record ingestion growth, including a 341% spike via Zero Copy. This adoption momentum strengthens Salesforce’s long-term target of $60B+ organic revenue and its FY30 Profitable Growth Framework.
TECHNICALS
The chart shows NYSE:CRM reclaiming demand after months of compression inside a descending trendline. Price recently bounced sharply from the $225–$235 support zone, where accumulation has been active for nearly two years. The breakout attempt above the long-term trendline is now in focus.
If price secures a clean close above $255–$260, upside targets open toward $290, and ultimately the $369 all-time-high zone. RSI sits mid-range, signaling room for expansion, while MACD hovers near a bullish cross. Failure to hold above $255 could re-expose the $225 demand region.

Salesforce’s AI Pivot: The Rise of the Agentic EnterpriseSalesforce (CRM) stands at a pivotal intersection of software legacy and artificial intelligence innovation. Despite a year-to-date stock correction of 32%, the company’s fundamentals tell a story of aggressive evolution. The cloud pioneer is systematically re-engineering its DNA to dominate the "Agentic Era." Investors focusing solely on the current share price of $227 may miss the underlying structural shift. With Q3 earnings approaching, we analyze the multi-domain drivers fueling Salesforce’s fundamental ascent.
Financial Resilience: Economics & Business Models
The subscription economy remains Salesforce's financial fortress.
In Q2 Fiscal 2026, the company generated $10.2 billion in revenue, a 10% annual increase. Crucially, $9.7 billion of this flowed from stable subscriptions and support. This recurring revenue model insulates the company against macroeconomic volatility. Furthermore, management’s focus on operational efficiency drove adjusted earnings per share (EPS) to $2.91, beating prior periods. This discipline balances aggressive R&D spending with shareholder returns, a vital equilibrium in high-interest rate environments.
High-Tech & Science: The "Agentic" Shift
Salesforce is redefining the science of work. CEO Marc Benioff envisions an "Agentic Enterprise" where human workers and AI agents collaborate seamlessly. This is not theoretical; the Data & AI division’s revenue more than doubled to $1.2 billion last quarter. The company’s proprietary platform, Agentforce, utilizes advanced Large Language Models (LLMs) to automate complex workflows. This moves beyond simple chatbots to autonomous agents capable of executing multi-step tasks in sales and service.
Patent Analysis: We anticipate a surge in IP filings regarding "autonomous agent orchestration" as Salesforce builds a legal moat around this technology.
Strategic M&A: Technology & Cyber
Data is the fuel for AI, and Salesforce just bought a bigger pipeline. The recent acquisition of Informatica secures critical cloud data management infrastructure. This strategic move allows Salesforce to ingest, clean, and secure vast datasets from disparate sources.
Cybersecurity Implication: By controlling the data layer, Salesforce offers a "walled garden" for enterprise clients. This reduces cyber risk and ensures data governance, a primary concern for Fortune 500 CIOs adopting AI.
Geopolitics & Geostrategy: Middle East Expansion
Salesforce is aggressively diversifying its geographic footprint. The recent launch of an Arabic version of Agentforce signals a strategic pivot toward the Middle East. This region is currently investing heavily in digital transformation to diversify away from oil dependence. By providing localized, AI-driven automation, Salesforce embeds itself into the infrastructure of emerging economic powers. This reduces reliance on Western markets and taps into sovereign wealth capital flowing into technology.
Management & Leadership: Culture of Innovation
Leadership is driving a forced evolution. Benioff is pivoting the company culture from "Cloud First" to "Agent First." This cultural shift is difficult but necessary to avoid obsolescence. The integration of Informatica and the push for $60 billion in revenue by 2030 demonstrate a long-term commitment to growth. Management is willing to sacrifice short-term margins for long-term dominance in the AI application layer.
Outlook: The December Catalyst
All eyes turn to Wednesday, December 3. Salesforce will release its Q3 2025 earnings after the bell. Analysts expect revenue of $10.27 billion and further EPS growth. The market will scrutinize the adoption rates of Agentforce and cloud subscription metrics. A positive report could validate the "Agentic" strategy and reverse the stock's recent bearish trend. For the strategic investor, Salesforce represents a disconnect between current sentiment and fundamental reality.
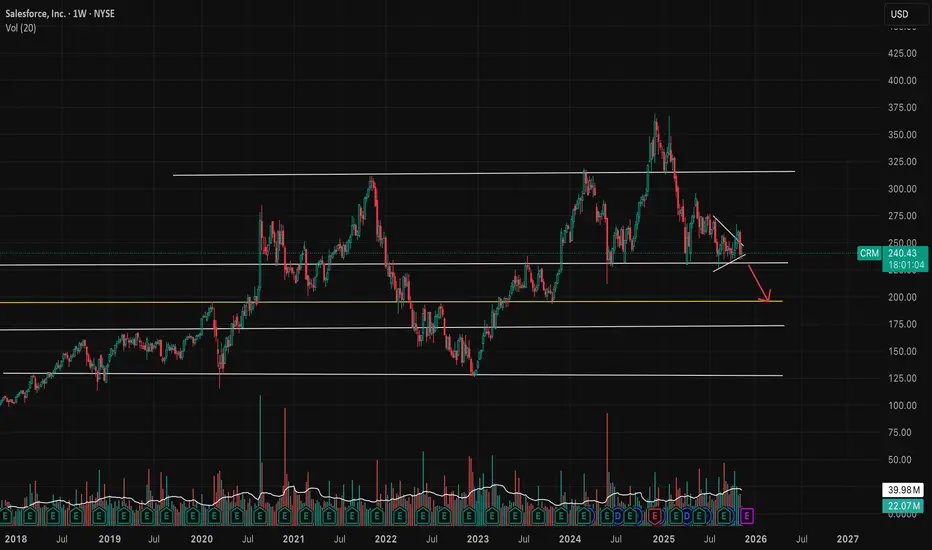
Bear flag on weekly chart, Further breakdown?- NYSE:CRM is forming bear flag on weekly chart.
- It could break down further and test some support underneath around $195
CRM HIGH PROBABILITY LONG SETUP SOON!!!🚨 CRM HIGH PROBABILITY BUY SETUP 🚨
* Here We Can See Clearly The Next Potential Moves For CRM Coming Hours/Days.
* Keep Your Eyes Close On Your Trading Positions.
* Happy PIP Hunting Traders.
FXKILLA.


Quant Signals V3 CRM Call Setup: Riding Post-Earnings MomentumCRM QuantSignals V3 Earnings 2025-12-03
Signal Type: Earnings Trade
Direction: BUY CALLS (LONG)
Strike Price: $225.00
Entry Price: $16.33 (midpoint of $16.10–$16.55)
Profit Target 1: $24.50 (≈50% gain)
Profit Target 2: $32.66 (≈100% gain)
Stop Loss: $11.43 (≈30% risk)
Expiry: 2025-12-05 (2 days)
Position Size: 2% of portfolio (reduced due to Katy AI conflict)
Confidence Level: 65%
Conviction: Medium
Implied Volatility: 129.7% (high, earnings play)
24h Pre-Earnings Move: +4.22%
Options Flow: Neutral; deep ITM calls with high deltas (0.7–0.8) indicate institutional positioning
Risk Notes:
Katy AI shows bearish trajectory (-4.12%) but moderate confidence (50%) → trade overrides due to strong fundamentals and institutional flow.
High volatility and short expiry require tight risk management and monitoring.
Rationale:
Strong pre-earnings rally and revenue growth support bullish outcome.
Institutional options positioning and delta selection favor calls despite AI bearish signal.
Reduced position sizing (2%) mitigates conflict risk.
Salesforce for short-term upside after AI sector enthusiasm
Current Price: $226.15
Direction: LONG
Confidence Level: 58% (Limited but positive sentiment from professional traders; targets tight due to low supporting data volume)
Targets:
- T1 = $229.00
- T2 = $233.00
Stop Levels:
- S1 = $224.00
- S2 = $221.00
**Wisdom of Professional Traders:**
This analysis pulls together the voices of several professional traders who have been highlighting Salesforce as part of a basket of attractive AI software plays. Within larger sector discussions that included Palantir and BigBear.ai, Salesforce was called out for having “bigger long-term moats” and being “a great name” experiencing a larger dip than the infrastructure plays. While the commentary wasn’t filled with granular price levels, the collective tone from these traders leans toward accumulating on weakness, which sets the stage for a short-term LONG bias.
**Key Insights:**
Here’s what’s driving this call — Salesforce is being grouped with momentum AI names by multiple traders, even in a tech environment where sentiment has been choppy. The interest is anchored in the company’s strong positioning in AI-enhanced software solutions for enterprise clients and the belief that it can ride the broader AI adoption cycle. The mention alongside Palantir and others in an "accumulate on dips" context is a bullish tell from trader consensus.
What caught my attention is that Salesforce is not just being picked as a safe legacy software play, but as a growth name that still has significant untapped AI monetization potential. That tone is a notable shift from previous quarters where focus was more defensive. Even without specific short-term catalysts in the snippet data, this kind of thematic inclusion in trader watchlists often precedes a multi-session pop.
**Recent Performance:**
Over the past week, Salesforce eased back from recent highs, falling in sympathy with the broader Nasdaq pullback. Closing last week at $226.15, it has been testing light intraday support levels without breaking down decisively. This gentle consolidation after a broader tech selloff suggests buyers quietly absorbing shares at these levels. The low volatility in recent sessions is creating a coiled-spring setup for a short-term move.
**Expert Analysis:**
Several professional traders I’m tracking mentioned Salesforce favorably in the context of AI software exposure. While they didn’t lay out detailed charts in the snippets, the inclusion in their “buy the dip” lists signals a belief that the short-term downside risk is contained. Technically, this aligns with the chart, which shows price holding above recent minor swing lows and sitting close to an area tested multiple times in November.
Given the absence of significant selling pressure and the thematic AI tailwind, I’m treating the $224-221 range as an attractive risk zone. The short-term upside likely faces its first test around $229, with a stronger move possible toward $233 if momentum picks up quickly this week.
**News Impact:**
There’s no fresh X sentiment push on Salesforce right now, but the broader AI news cycle remains lively, with enterprise AI deployment stories making headlines. Any new Salesforce AI feature announcements, integration news, or analyst upgrades tied to AI capabilities could catalyze the move traders are setting up for. Sector sympathy is key here — if Palantir or other AI software peers rally on news, Salesforce can catch a momentum wave.
**Trading Recommendation:**
Putting it all together, I like a tactical LONG here targeting $229 first, with $233 as a stretch target if AI sentiment continues to firm. Stops are layered tightly at $224 and $221 to protect capital in case of a broader tech selloff. This is not a high-conviction sector-wide breakout trade yet — it’s a measured bet that Salesforce’s placement in the AI narrative will draw short-term buying. Position sizing should reflect the moderate 58% confidence level.

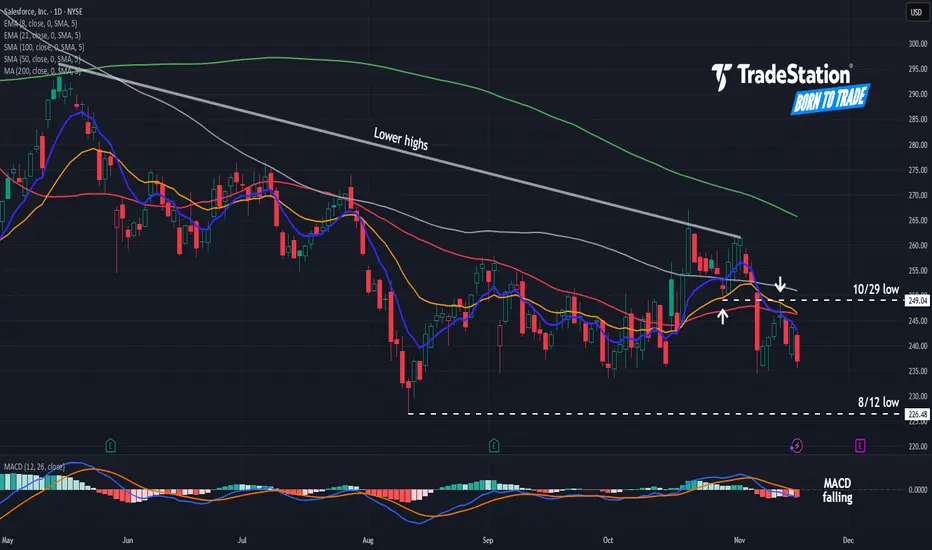
Salesforce May Be SlidingSalesforce has limped despite the broader market climbing. Now some traders may see risk of a bigger slide in the software company.
The first pattern on today’s chart is the series of lower highs since mid-May. That could suggest sellers outnumber buyers.
Second, the 50-day simple moving average (SMA) is below the 100-day SMA. Both are below the 200-day SMA. Such a configuration, with faster SMAs under slower ones, could reflect a long-term downtrend.
Third, the 8-day exponential moving average (EMA) recently crossed below the 21-day EMA. MACD is also falling. Those signals may be consistent with a short-term downtrend.
Fourth, CRM bottomed at $249.04 on October 29 and peaked near that level on November 12. Has old support become new resistance?
Finally, traders may see risk of a move toward the 52-week low below $230 if weakness continues.
TradeStation has, for decades, advanced the trading industry, providing access to stocks, options and futures. If you're born to trade, we could be for you. See our Overview for more.
Past performance, whether actual or indicated by historical tests of strategies, is no guarantee of future performance or success. There is a possibility that you may sustain a loss equal to or greater than your entire investment regardless of which asset class you trade (equities, options or futures); therefore, you should not invest or risk money that you cannot afford to lose. Online trading is not suitable for all investors. View the document titled Characteristics and Risks of Standardized Options at www.TradeStation.com . Before trading any asset class, customers must read the relevant risk disclosure statements on www.TradeStation.com . System access and trade placement and execution may be delayed or fail due to market volatility and volume, quote delays, system and software errors, Internet traffic, outages and other factors.
Securities and futures trading is offered to self-directed customers by TradeStation Securities, Inc., a broker-dealer registered with the Securities and Exchange Commission and a futures commission merchant licensed with the Commodity Futures Trading Commission). TradeStation Securities is a member of the Financial Industry Regulatory Authority, the National Futures Association, and a number of exchanges.
TradeStation Securities, Inc. and TradeStation Technologies, Inc. are each wholly owned subsidiaries of TradeStation Group, Inc., both operating, and providing products and services, under the TradeStation brand and trademark. When applying for, or purchasing, accounts, subscriptions, products and services, it is important that you know which company you will be dealing with. Visit www.TradeStation.com for further important information explaining what this means.
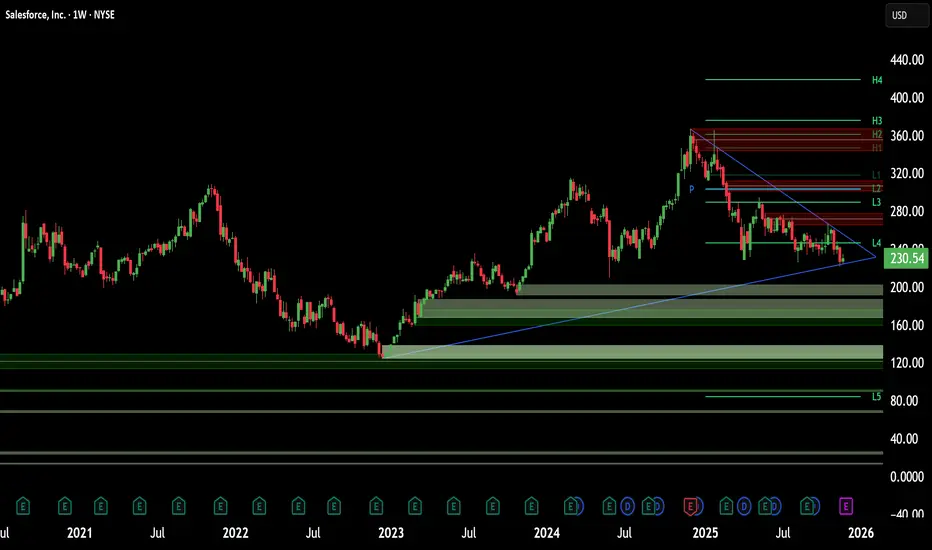
$CRM SALESFORCEA technical examination of Salesforce's ( NYSE:CRM ) price chart reveals a compelling and potentially decisive consolidation pattern currently in play. The prevailing structure points towards a bearish inclination, but it is also setting the stage for a significant breakout move in either direction.
1. The Prevailing Bearish Evidence: Descending Triangle & ABCD Pattern
The primary pattern of note is a Descending Triangle. This is typically considered a bearish continuation pattern, formed by a flat support level at the bottom and a series of lower highs creating a descending trendline at the top. For NYSE:CRM , the key support floor appears to be around the $230 - $235 level, which price has tested and held multiple times. The descending resistance trendline, currently near $260, acts as a ceiling that is progressively lowering.
Adding further weight to the bearish case is the presence of a completed bearish ABCD pattern within the larger triangle. This harmonic pattern signifies a corrective (bearish) move followed by a retracement, suggesting that the path of least resistance prior to the breakout may be to the downside.
2. The Impending Breakout: Two Scenarios
The significance of a descending triangle lies in the eventual breakout, which can be explosive. The market is coiling, and a decisive move above resistance or below support will dictate the next major trend.
Scenario A: Bullish Breakout (Upside Target)
A decisive and high-volume break above the $260 descending resistance trendline would invalidate the immediate bearish outlook and signal a powerful shift in momentum. In this case, the pattern's measuring implications project a move upward. Using Fibonacci extension levels from the pattern's height, the primary upside price targets would be:
First Target (0.382 Fib): $280.92
Second Target (0.5 Fib): $297.74
Extended Target (0.618 Fib): $314.56
A move to the $297 level would also often align with a retest of the triangle's upper boundary, now acting as new support.
Scenario B: Bearish Breakout (Downside Target)
If the bearish implications of the pattern hold true and the crucial support at $230 - $235 is broken with conviction, it would confirm a continuation of the prior downtrend. The measured move target for a descending triangle breakdown is typically calculated by projecting the height of the pattern's widest point downward from the point of breakdown. This projects a significant decline toward the $200 psychological support level. This area represents a key long-term value zone and would likely be a major test for the stock's health.
Conclusion and Key Levels to Watch
In summary, NYSE:CRM is at a critical technical juncture, compressed within a descending triangle. While the internal patterns suggest a bearish bias, the outcome is not confirmed until a breakout occurs.
Bullish Trigger: A break and close above $260. Confirmation would be a follow-through move above this level with strong volume.
Bearish Trigger: A break and close below the $230 - $235 support zone.
Neutral Stance: Until one of these levels is breached, the stock is likely to continue its sideways consolidation within the triangle.
Traders and investors should monitor these key levels closely, as the breakout will likely determine NYSE:CRM 's directional bias for the medium term.

CRMThe 20-day, 50-day, and 100-day moving averages are all below the current price (~US$255), giving “buy” signals under many moving-average systems. Salesforce is a leader in the enterprise cloud-software / CRM market, and it’s pushing into AI and data-cloud initiatives—areas with potential upside if they gain traction.

CRM LONG TO $510 - CALL HAS LEGS, THE NUMBERS JIVE, READ ON!Salesforce (CRM) stands out in the market with strong premium valuations justified by robust financial performance, innovative AI-driven products, and disciplined capital management, all pointing toward a bullish but measured long-term outlook.
First, key valuation ratios reveal Salesforce’s high market premium versus industry averages. The trailing price-to-earnings ratio is about 33 (TTM), with fiscal year P/E near 47, significantly above the industry average of around 22. Price to sales (TTM) is roughly 5.8, versus 1.5 for peers, reflecting strong revenue fundamentals and growth expectations. Price to tangible book is notably high near 37, highlighting investor confidence in intangible assets like proprietary AI and data platforms. Return on equity sits above 11%, further underscoring solid profitability. Free cash flow per share stands at about $11.30, deeply supporting operations, buybacks, and dividends. Monthly share volatility remains elevated at roughly 19%, well above industry norms, suggesting active trading interest and sensitivity to growth news. Salesforce’s balance sheet shows healthy liquidity with a current ratio near 1.12 and modest debt/equity around 14%, indicating capital flexibility and disciplined leverage management.
Recent quarterly results and corporate disclosures strongly validate this valuation. For the first half of fiscal 2026, Salesforce reported $20.1 billion in revenue (+9% YoY), with double-digit subscription and support revenue growth driven by key cloud offerings. Operating margins are expanding steadily, exceeding 34% non-GAAP in the latest quarter. The company forecasts nearly $15 billion in operating cash flow, underpinning continued shareholder returns, including a newly authorized $20 billion share repurchase program.
Salesforce’s transformative AI platform, Agentforce, alongside its Data Cloud revenue line, is a pivotal growth driver. Agentforce bookings surged over 120% year-over-year, with over 6,000 paid deals and rapid adoption by major clients such as FedEx, DirecTV, Amgen, and Under Armour. Forward-looking statements highlighted a vision of "agentic enterprises," integrating AI-powered agents that augment human workflows across sales, customer service, and operational functions. This innovation wave positions Salesforce as a clear leader in AI-native SaaS, accustomed to evolving customer needs with scalability and operational efficiency.
Earnings call transcripts emphasize management's excitement around AI’s role in extending, not replacing, the SaaS model. They note a 60% increase in pilot-to-production conversion rates for AI-powered solutions, growing pipeline strength from big deals over $1 million (+26% bookings YoY), and broad geographic expansion despite pockets of constraints (UK, Japan). The company is also prioritizing profitable growth and high-margin product innovation while closely managing capital allocation with disciplined M&A focused on AI-related acquisitions.
The stock currently trades near $245 (October 2025), carrying a premium P/E over 35. This premium is supported by continuing strong revenue growth guidance (about 8.5-9% YoY for FY2026), operating margin expansion, and significant free cash flow growth (expected 12-13%). Salesforce’s sizable remaining performance obligations of $59.9 billion (CRPO) imply a solid deferred revenue base to fuel future growth.
To summarize: Salesforce’s valuation ratios reflect its leadership in the enterprise software and AI SaaS market, backed by consistent execution, strong subscription revenue streams, growth in AI-driven products, and disciplined capital returns. The premium multiple is justified by ongoing innovation and operational excellence, with the risk profile balanced by strong cash flow and customer retention. Investors should monitor AI adoption rates, margin trends, and competitive dynamics, but current fundamentals and strategic directions point to sustainable long-term value creation.
This rich synthesis integrates raw ratio data, quarterly performance specifics, and qualitative insights from earnings management commentary to present a comprehensive valuation and growth outlook narrative.
Salesforce's intrinsic value computed through traditional Discounted Cash Flow (DCF) models and normalized Free Cash Flow valuation methods generally indicate a fair value range between approximately $320 and $410 per share as of mid-2025. For example, GuruFocus reports an intrinsic DCF-based value near $407, while other analyses range from about $316 to $327. These models rely on assumptions including a high growth stage (capped at 20% annually), a discount rate of around 11%, and terminal growth near 4%, reflecting Salesforce's strong historical free cash flow growth (~24% average) and durable profitability.
However, a forecast valuation exceeding $510 per share suggests a more bullish scenario, which could be justified if Salesforce:
Continues accelerating revenue growth beyond consensus,
Achieves sustained and expanding operating margins above 34%,
Successfully monetizes its AI-driven Agentforce and Data Cloud platforms at scale, surpassing current bookings momentum,
Executes capital allocation optimally, amplifying shareholder value through buybacks and strategic acquisitions,
Maintains and grows its wide competitive moat in SaaS and AI-enabled enterprise software longer than typical market expectations.
While current consensus intrinsic value models provide a strong baseline, such elevated price targets imply that the market should expect Salesforce to become a dominant AI-SaaS platform with enterprise transformation impact driving exceptional free cash flow and earnings growth over the next decade.
This is a reasonable long-term outlook given Salesforce’s demonstrated leadership in cloud and AI innovation combined with consistent execution, but it is critical to monitor key risks including competition, macroeconomic conditions, and integration execution, which could impact growth or margins.
In summary, intrinsic valuation models range from $316 to $410 under mainstream assumptions, supporting a bullish forecast over $510 if Salesforce sustains accelerated growth and margin expansion. This higher target assumes a premium multiple justified by AI-driven transformation and exceptional financial results ahead.

How to Generate More Profits During Earnings SeasonWho is in control of Price on the Day of the Earnings season CEO reports requires studying the stock chart 2-4 weeks ahead of the estimated date of the report.
Smaller Funds activity will disrupt runs intraday.
Professional Trading Companies are very active.
HFTs AI are making huge errors causing whipsaw action.
Buy Side has slowed and paused its accumulation in many stocks.

Salesforce Reinvents Itself with AI and Projects Over $60BSalesforce Reinvents Itself with AI and Projects Over $60B by 2030
By Ion Jauregui – Analyst at ActivTrades
Salesforce (NYSE:CRM) has staged a true comeback in 2025, following the announcement of its ambitious forecast to surpass $60 billion in revenue by 2030. The global leader in CRM software has doubled down on artificial intelligence (AI) and advanced analytics, positioning itself as one of the most resilient technological pillars in the U.S. market.
Informatica and the Shift Toward Smart Data
One of the most talked-about moves of the year was Salesforce’s $8 billion acquisition of Informatica — a strategic operation that strengthens its data integration and management business. This acquisition will enable the company to merge its CRM ecosystem with advanced analytics and generative AI tools, creating more efficient integration across enterprise cloud solutions.
AI Serving Business Needs
Salesforce has signed key partnerships with OpenAI and Anthropic to enhance the capabilities of its Einstein AI platform. The goal is to provide companies with smarter tools to automate processes, personalize customer service, and improve decision-making. In addition, the company has announced a $15 billion investment in San Francisco aimed at expanding its AI infrastructure and technology development centers, reinforcing its role as a major innovation engine on the West Coast.
Share Buyback and Confidence in the Future
The $7 billion share buyback plan approved by the board reflects Salesforce’s confidence in its long-term outlook. The measure seeks to optimize shareholder value and stabilize the stock after a year of significant volatility in the tech sector.
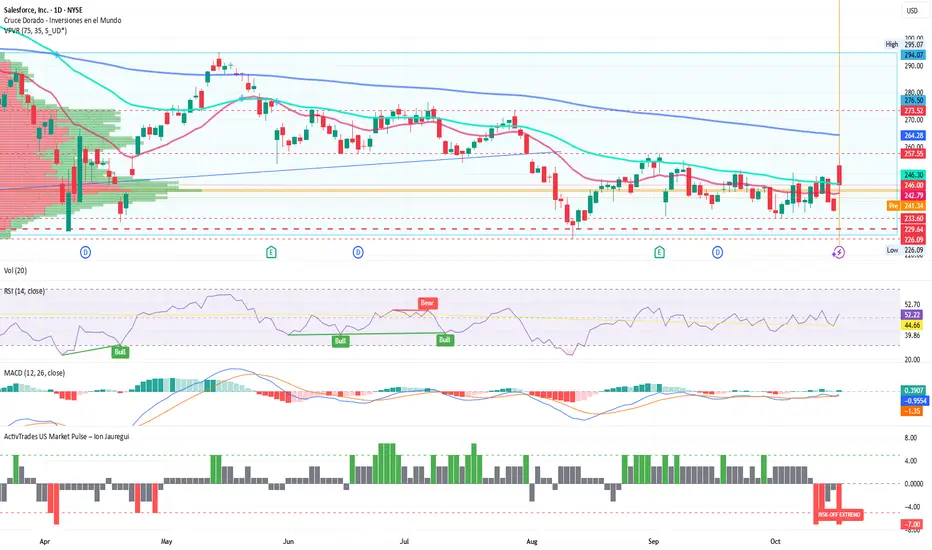
Technical Outlook: Consolidation with a Bullish Bias
Salesforce shares closed yesterday at $240, following a steady recovery from August lows of $226. On the technical side, the stock maintains a solid sideways trend, with support at $233.60 and a current point of control (POC) near $244. Resistance was tested yesterday at $257.55; if that level is broken in the coming sessions, we could see a move toward the $273.52 zone, last seen in July.
The RSI remains around 52.22%, indicating neutrality, while the MACD is positioned below a positive histogram. The bearish moving average crossover initiated in late May remains in place, although the current price holds above the 100-day average, suggesting that bullish pressure could increase in the coming sessions. According to the ActivTrades US Market Pulse indicator, an extreme risk-on environment has dominated U.S. markets throughout the week — reflected in the strong appetite for tech stocks like Salesforce, driven by confidence in AI and the sector’s expansion.
Leader of the Future
Salesforce has shown that its reinvention goes far beyond AI rhetoric: it combines corporate strategy, technological innovation, and investor confidence within an extreme risk-on backdrop on Wall Street. With key acquisitions, strategic alliances, and a solid financial foundation, the company is not only positioning itself to lead the next era of enterprise software but also to become one of the driving forces behind U.S. technological growth heading into 2030.
*******************************************************************************************
The information provided does not constitute investment research. The material has not been prepared in accordance with the legal requirements designed to promote the independence of investment research and such should be considered a marketing communication.
All information has been prepared by ActivTrades ("AT"). The information does not contain a record of AT's prices, or an offer of or solicitation for a transaction in any financial instrument. No representation or warranty is given as to the accuracy or completeness of this information.
Any material provided does not have regard to the specific investment objective and financial situation of any person who may receive it. Past performance and forecasting are not a synonym of a reliable indicator of future performance. AT provides an execution-only service. Consequently, any person acting on the information provided does so at their own risk. Political risk is unpredictable. Central bank actions can vary. Platform tools do not guarantee success.
CRM STOCK ANALYSIS Market Risk
Stock prices can fluctuate due to overall market movements caused by economic changes, political events, interest rate adjustments, or global crises. Even strong companies can lose value during market downturns.
Company-Specific Risk
The performance of an individual company can affect its stock price. Poor management decisions, declining sales, increased competition, or scandals can lead to losses.
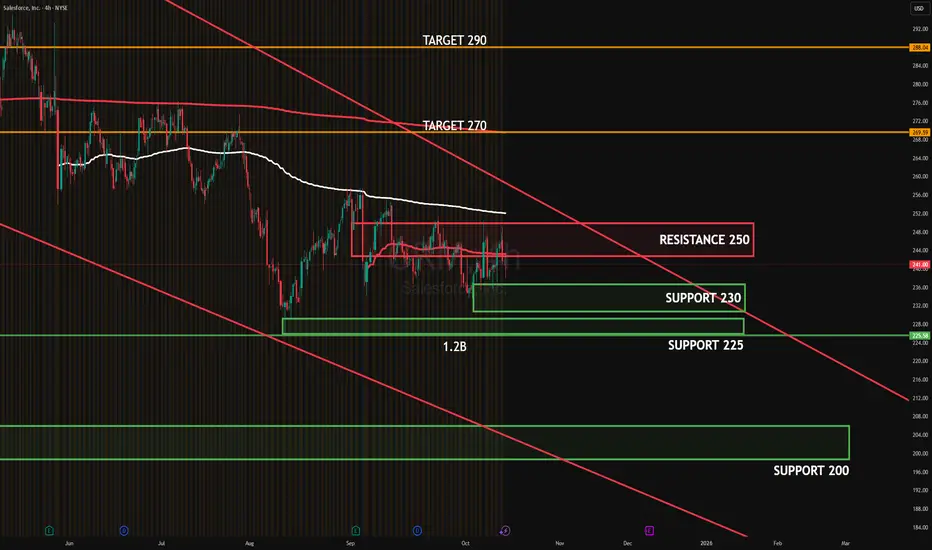
CRM OCT 2025CRM 4H: Price remains capped by 246–250 supply under the descending trendline, while buyers continue to defend 230–225 demand. The 230 test showed notable absorption (~1.2B), suggesting that institutions supported the dip; however, until 250 is reclaimed, that area acts as a distribution point.
Targets
Upside: 250 (range high). If accepted above, 290 (swing target).
Downside: 230 (first support). If lost, 225 (secondary support).
#CRM #globaltrade #investment #investing #stockmarket #wealth #realestate #markets #economy #finance #money #forex #trading #price #business #currency #blockchain #crypto #cryptocurrency #airdrop #btc #ethereum #ico #altcoin #cryptonews #Bitcoin #ipo
CRM – Daily Chart | Holding Key Demand Zone Before Possible Reve⚙️ Key Levels
Zone Level Description
🔴 Major Resistance (Retail Zone) 367.09 Prior structural peak and key distribution area. Any rally back toward this level may face heavy selling pressure.
🟣 Extended Target Zone 451.81 Long-term Fibonacci extension level; full recovery point if momentum re-enters Stage-2 markup.
🟢 Active Support Range (Wholesale Zone) 240.49 – 230.00 Current demand area holding firm; repeated rejections from this zone indicate accumulation. Watch for bullish divergence confirmation.
📈 Chart Structure Notes
Price remains in Stage 1 accumulation, consolidating near prior cycle lows.
A daily close above $250–255 could confirm a breakout attempt toward $282–$314.
Breakdown below $230 opens risk to deeper continuation into the $200–$210 range.

CRM Is A Buy Hello,
CRM is running in an ending diagonal, as last phase of correction.
Targets:
1) $300
2) $330
3) $370

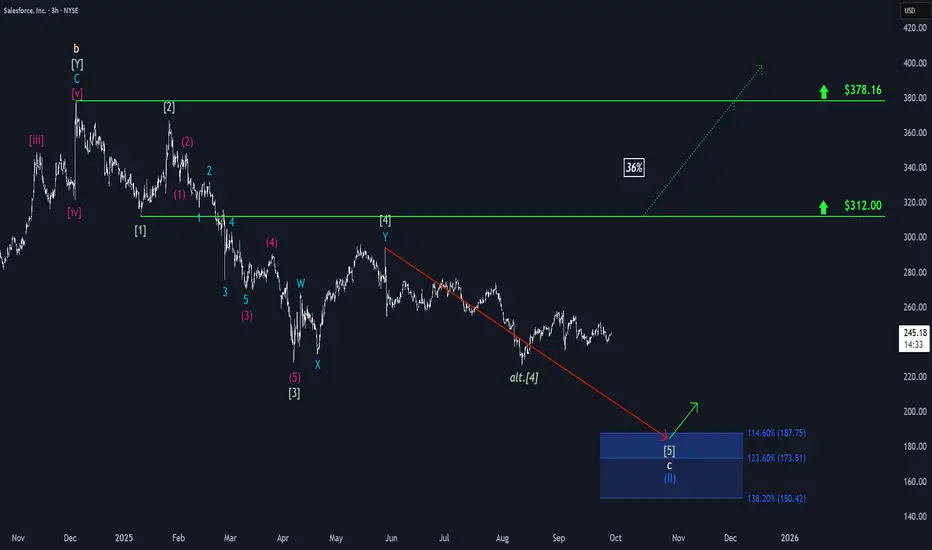
Salesforce: Trading SidewaysSalesforce has struggled to gain clear momentum in either direction over the past two weeks, which has resulted in mostly sideways trading. Looking ahead, we continue to anticipate renewed downward pressure in the near term, which could push the stock into our blue Target Zone between $187.75 and $150.42, thereby completing the broader correction of blue wave (II). After this move, we expect a new upward trend to emerge, which makes the blue zone an attractive entry point for long positions. For risk management, a stop can be placed 1% below the lower boundary of the zone. However, there remains a 36% chance that CRM will not reach our Target Zone and instead will break out directly above resistance at $312, potentially surpassing the higher $378.16 level as well. In that scenario, we would place the stock in a broader (green) upward impulse.
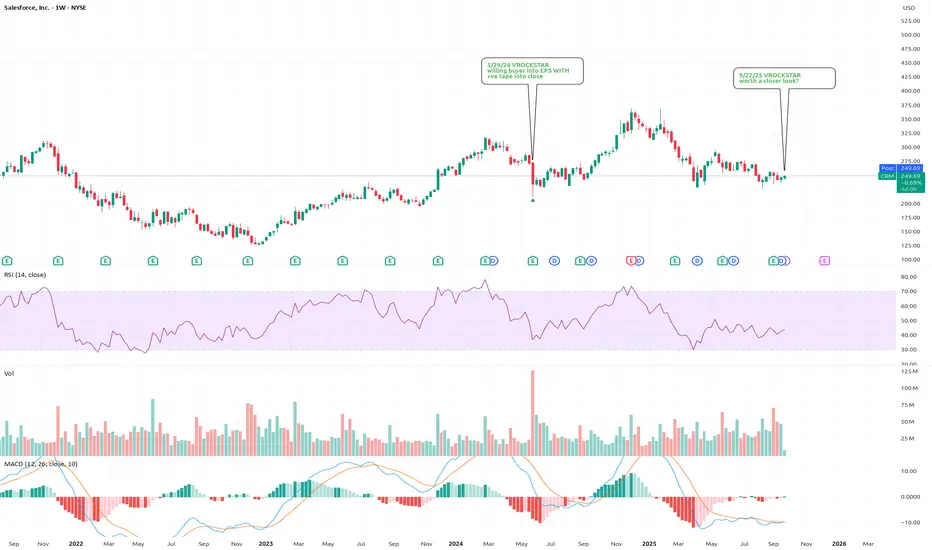
9/22/25 - $crm - worth a closer look?9/22/25 :: VROCKSTAR :: NYSE:CRM
worth a closer look?
- seems like the market wants the mega caps and the micro memes, but nothing in between
- that's what brought me back to NYSE:FI in the last few days (it's about a 20% position or 8% leveraged 2.5-1 on a series of jan '28 ITM leaps)
- now i'm looking at CRM and saying, let's have a look
- anything that's doing >6% fcf (this is even closer to 6.5%) and growing MSD nevermind HSD like this one should get another look
- i get the sense fund mgrs r being "forced" to index toward higher mcap factor and ignore these, despite what actives would prefer
- and you get a really nice setup potentially into YE where one of two things happens (let's use $fi/ NYSE:CRM as similar types - $100 bn one $230 bn other).
a. mkt continues to bleed/ eschew these to chase mag7 performance and in which case you get an easy '26 play esp at end of year into 1H26 as rotation out of megas will inevitably mean they perform weaker and you get a reverse of this momentum
b. these caps actually get a bid - which is my suspicion - as you get highly liquid mega caps that might drip 5-10% at most (we'll get a few bumps along the road - and the longer we go without these... the higher these "alts" that r 100-300bn will run) and if we do take a sneeze, we'll get a nice dip buy entry again, for YE play.
- i do think all roads lead higher here
- and while "AI" might be an issue, sure - for names like NYSE:FI and NYSE:CRM , these co's have serious initiatives that r already showing fruit and i think dominant platforms w HSD momentum in a weak macro (ex-B2B pure-AI) is pretty high quality and gives u booster re-ratings when we do eventually get more substantial cuts. remember - these cuts won't help NVDA as much as they help customers for $fi... $crm... types. and that's where you go from 8-9% growth for both of these toward 15+% and they'll re-rate toward 4-5% fcf yield and stock will be 50% higher.
V