KGC – Gold Miner Swing SetupReasoning:
Part of the strongest group – Gold miners
Pullback to 50-Day MA after a strong run
Late-stage base forming – ideal for a quick swing
Swing Traders (2-6 Week Holds)
Buying rule: Use a buy stop above the breakout level to avoid false moves
Entry: Full position on breakout
Profit Taking: Sell 1/3 at Goal 1
Final Exit: Remainder at Goal 2
Optional: Sell 30% at G1, 30% at G2, 40% at G3 if the trend keeps running
Selling is done partially because we never know what is going to happen — sell as money goes in your favor. – Mark Douglas
Trade ideas

$KGC Gold Mining GaloreSo, I guess there was a major sell off on Friday. Being that Gold is ripping in only one direction I would not bet again this stock. I would be looking to be playing earnings on all GOLD mining stocks they have Earning reports coming up next month NEM Newmont corporation is on the 23 of October so let's pray.

KGC (Kinross Gold Corporation) – Bullish Breakout Play🚀 Trade Idea: KGC (Kinross Gold Corporation) – Bullish Breakout Play
Entry: $16.40 | Stop Loss: $14.90 | Take Profit: $19.45
Risk/Reward Ratio: ~1:2.5
📈 Technical Setup
Trend:
Daily: Strong uptrend (higher highs & higher lows).
4H/1H: Bullish momentum confirmed with SMA(20) > SMA(50).
Key Levels:
Support: $15.90 (recent swing low) / $14.90 (strong demand zone).
Resistance: $16.50 (recent high) → Breakout target: $19.45 (2024 YTD resistance).
Indicators:
RSI(14): 62 (bullish, no overbought signal).
MACD: Positive crossover on daily chart.
Volume: Rising on upward moves (bullish confirmation).
💡 Why KGC?
✅ Fundamentals:
Strong revenue growth (Q2 earnings beat).
Undervalued P/E (~16x vs. industry avg. ~20x).
Low debt (Score 10 in debt analysis).
✅ Catalysts:
Gold price stabilizing above $2,400/oz (sector tailwind).
Upcoming Fed rate cuts could boost gold miners.
🎯 Trade Execution
Entry: $16.40 (break of consolidation).
Stop Loss: $14.90 (below key support, ~9% risk).
Take Profit: $19.45 (20% upside, near YTD highs).
Partial Profit-Taking: Consider scaling out at $17.80 (mid-term resistance).
⚠️ Risk Management
Position size ≤ 2-3% of portfolio.
Adjust SL to breakeven if price reaches $17.00.
🔍 Watch For:
Gold price volatility (Fed speeches, CPI data).
Earnings date (next report: Aug 2025).
📌 Comments? Would you take this trade? Let’s discuss below! 👇
#Gold #MiningStocks #Breakout #KGC #TradingView
(Disclaimer: Not financial advice. Do your own research.)


KGC trade opportunity longHi everyone,
Just wanted to share a new trade I’ve taken on KGC.
The stock recently reacted from the weekly 10 EMA, and on the daily timeframe, it formed a descending wedge followed by a breakout. After that, it created a bullish flag which also broke out — this time with volume behind the move. These are solid confluences, and that's why I believe KGC has growth potential.
I’ve taken the trade and will now let the market play out while managing the position according to my rules.
Always stick to your strategy and trading plan.
Let me know your thoughts — would love to hear how you see it!

LONG on KGCA volume-driven move is developing. It is reacting coincidentally to the 61.8 Fibonacci level, a trend line close to support.
We previously performed a fundamental and technical analysis using a proprietary Python app, which yielded favorable results.

Monitoring MetalsJust a chart of a whole bunch of metal ETFs and stocks. I use it to check their performance in various time periods and to watch for big shifts in the market.

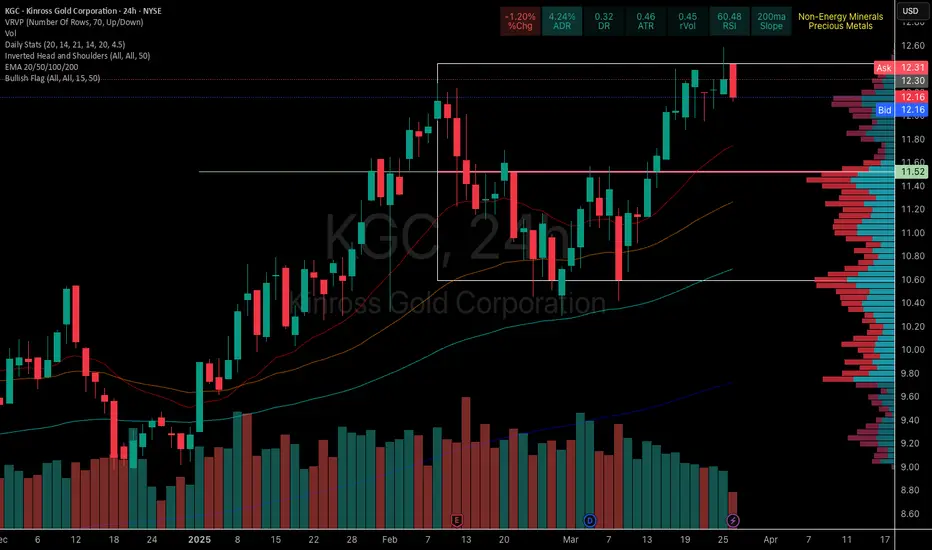
Kinross Gold Bumping top of boxI set the box to fit the current stock situation of Kinross Gold . and yes , you can trade inside of the box. Kinross gold is bumping the top of the current 24hr box. $12.45 ish. I would probly set my stop loss at the 50 percent line or $11.53 ish. the floor is $11.59 . you can use the box to help see where it is at. Happy Trading
Kinross Gold $KGC: Cash Flow King or Gold Risk? Kinross Gold (KGC): Cash Flow King or Gold Risk? 🏅💰
1/10
Kinross Gold NYSE:KGC surged 5.07%, hitting $10.57 per share. Revenue last quarter was $1.432 billion, driven by strong operations. 🔥 The gold sector might be glimmering again...
2/10
Earnings alert! NYSE:KGC releases its Q4 2024 results on February 12, 2025. Last quarter’s EPS beat was impressive: $0.232 vs. $0.178 expected. Will they outperform again? 📈
3/10
Free cash flow is booming: $450 million last quarter. Kinross repaid $650 million of a $1 billion loan. That’s aggressive debt reduction—investors love a clean balance sheet. 💸
4/10
Kinross trades at a P/E ratio of 17.59, relatively reasonable for its sector. Analysts see upside, especially considering the company’s free cash flow yield, outperforming peers like Barrick and Newmont. 📊
5/10
Risks remain. Gold price volatility directly impacts NYSE:KGC 's profitability. A price downturn would hurt margins despite their strong cash flow. ⚖️ Can Kinross hedge against gold’s wild price swings?
6/10
Strengths: NYSE:KGC ’s operational efficiency and strong cash flow allow it to reduce debt aggressively. Its high-quality assets in stable regions offer a defensive advantage. 🛡️
7/10
Weaknesses: Kinross relies heavily on gold prices. Operational issues at key mines like Bald Mountain or Round Mountain could disrupt production guidance. ⛏️ Will mine performance stay strong?
8/10
Opportunities: Kinross can expand production in current and new mining regions. Operational improvements could boost margins, especially with ongoing debt reduction enhancing financial flexibility. 🏆
9/10
Threats: Competition for mining rights, inflationary pressures, and geopolitical risks threaten NYSE:KGC ’s long-term stability. Can they manage rising costs while expanding operations? 🌐
10/10
Is Kinross Gold NYSE:KGC worth the risk or reward in 2025? Vote now! 🗳️
Golden buy opportunity 🏆
Hold for now 🔄
Too risky, avoid ⚠️

LONG KGC?TEST : Stock analysis is the process of evaluating a company’s financial health, performance, and potential for future growth to determine its suitability for investment. This involves assessing both quantitative and qualitative factors, typically categorized into the following approaches:

Options overlay tools that would be awesomeThese ties in with Gann analysis of time and price and implied volitility explosion.
We get to see how far ahead of time a price moves and trade the overextensions.
Perfect to use with Bollinger bands to find stalls and consolidation and monitior the mean reversion for Gamma exposure or pinning of options

Better tools needed for this website that would make it kickasssnip it from Barchart overlayed on you tradeview chart how awesome is this

Kinross Gold ($KGC) Poised for a Move Up Within the Channel NYSE:KGC has held strong within its rising channel, setting up for a potential 14% climb toward the 52-week high at $10.82.
Channel Strength – Respecting the channel boundaries, signaling more room to run.
Blue Support Zones – Solid support below, giving stability if there’s a pullback.
SMA 150 Support – Positioned well to reinforce the trend.
Volume – Steady at 20.5M, showing sustained interest.
CCI Oversold – Severely oversold, hinting it might start moving up from here.
KGC’s setup looks solid if it can keep riding this channel upward!


KGC Mean ReversionOur mean reversion indicator is printing a long setup on KGC. Gold and miners also look to be in a good area for continuation.

KGC Short PositionHi traders,
Taking a closer look at Kinross Gold Corporation, we can observe that it has formed a rising resistance line over the past few weeks, indicating a potential breakdown soon. The price has consistently formed higher lows, while encountering resistance around the same level,
forming the upper trendline.
Additionally, observing the Relative Strength Index (RSI) there can be observed a divergence. When divergence occurs it shows a weakness in the stock's price and potentially signaling a reversal in trend.
As the breakdown seems imminent, preparing for entering a short position at this stage
appears reasonable. The entry point could be slightly above the trendline, once the breakdown is confirmed.
Stop Loss: 7.33
1st Take Profit: 6.22
2nd Take Profit: 5.56
Final Target: 5.18

Short term trade on KGCThis counter has presented a short term LONG position for me. I entered around 5.02.
Please DYODD

$KGCBullish bat pattern.
3 rising valleys
At resistance/support zone.
Weekly HBD on MACD
Targets = structure points/3:1 reward to risk.
Stop = below $4.90

KGC long: end of wave 2Bullish case:
1. End of corrective wave 2
2. Price-RSI Divergence
3. Price-Volume Divergence
4. RSI double bottom

Gold miners are looking good for a rally. Check out Kıinross golNYSE:KGC chart breaking out of a classic cup n handle pattern. Great to see a little shake out at the bottom of the pattern.

KGC short to $4KGC | Kinross Gold Corporation
Short to $4
Technically:
Finishing correction on wave C.
Next strong supporting level - $3.85
Fundamentally:
P/E 156.13
Profit Margin 0.20%
Cash-To-Debt 0.17

Kinross Gold Corporation (KGC) Short Sell? You tell me!Ascending and Falling wedge patterns identified. Without recent news with KGC or really any of the gold industry, this stock leaves us with a TA of what we believe could happen.
By establishing boundaries to protect yourself at the bottom, this stock could see a continued reversal out of the falling wedge established beteween 2020-2022. Or, the ascending wedge could cause a free fall below $4.00.
Let me know everyone's thoughts!

Kinross Gold - 6:1 Long w/ Multiple ConfluencesThe weekly KGC price chart looks juicy for swing traders and position players, or anyone in search of quicker gold-correlated returns than the metal itself offers (+/- 25%).
As always, I strive to render these ideas of mine so obviously that their explanation will require no words, and this forecast is no exception.
My trading tactics - including the beauty of Tradingview and how it makes me look good - are based on identifying the opportunities within VOLUME, VOLATILITY and TREND EXHAUSTION.
This chart was developed on the 1D frame and the entry was made on the hourly, and is here presented in the 1W version to accentuate the Trend Exhaustion Wedge w/in the Fib Space as fully as possible, albeit w/ some loss of detail.
In fact, I generally prefer to trade on lower timeframes, so I execute swing trades like this one directly via my bank, in lieu of a savings account (which is NOT financial advice, by the way). Furthermore, a tighter Stop Loss at $4.71 (instead of the $4.64 shown here) offers a 9:1 Risk-to-Reward ratio.
When it comes to most mining stocks, I tend to rely on pure price action based on tight line-work, with a minimum of indicators. Besides the obvious Harmonic W, a variety of patterns are on display here, including a descending Three Drives followed by an ascending version.
The profit and retracement targets are passively based on Fibonacci ratios, and dynamically based on the VWAPs anchored at the C-point of the harmonic pattern. A volume profile is also anchored there, although it will become less valuable over time on the 1D chart, and is already invisible on hourly charts.
One indicator worth noting, though, is the correlation histogram with First Majestic Silver; the periods of divergence should be especially interesting to lower timeframe prospectors. In fact, especially when I look at mining charts, I prefer to study their correlation either to the underlying asset or, better yet, to some other lesser-correlated asset in the same "genre".
I will discuss both Kinross Gold and First Majestic Silver in forthcoming videos and streams on strategic and/or monetary metals. This will give you an opportunity to see what these charts look like on lower timeframes, and to ask questions.
Until then, be liquid !!!
