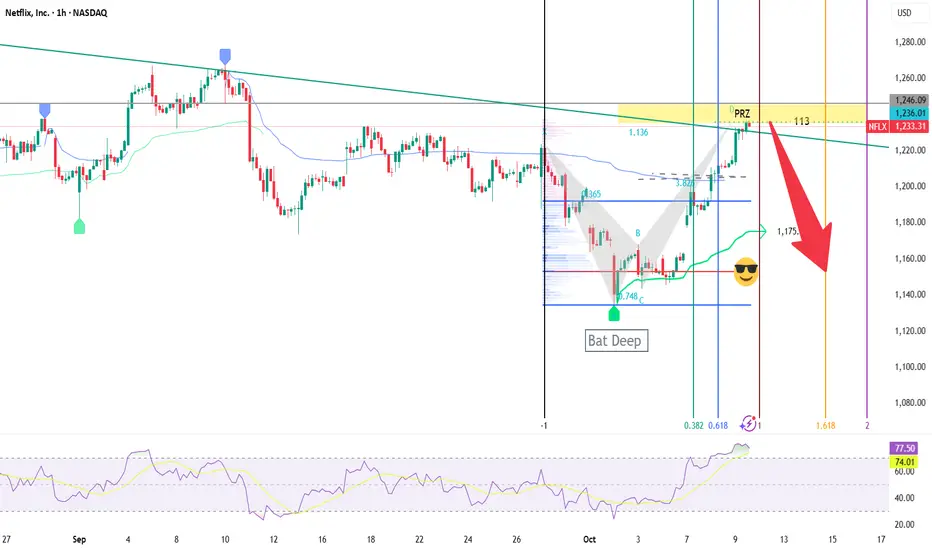
NFLX I did some analysis as per harmonic pattern school and with fibo time to check and it seems time to change direction down. also, i add RSI and volume profile to support. this is not recommendation to buy its just sharing information for learning purpose.
Trade ideas
Netflix Buy Alert!! The Rising 3 Soldiers Candlestick Patterns I did my first stream about two days ago.I was so sacred and nervous.
"This is a public stream, I better make sure I know what am talking about. I better make sure I show the pips my very best setups for trading."
I tell you I was super depressed because I want to be a good trading leader.
So I have been grinding trying to make sure I perfect my trading strategy and system and skills.
Because I want to show you the best of the best trades I can find.
No more just forex...or stocks I just want to be a great
technical analyst.
So today I did another stream and I had one person watching me trade live.
If you watch me trade analysis live you will really enjoy it 👍😊
It was an awesome stream.This is my business goal to become a streamer.
But am hoping for more viewers tomorrow.
Look at Netflix NASDAQ:NFLX
It's
Above the 50 MA
Above the 20 EMA
Above the 200 EMA
Notice the rising 3 soldiers 🟩🟩🟩Bullish candlestick patterns?
Notice how the last green candle
Gaps up? In green 🟢
The candlestick patterns are your confirmation of entry.
Netflix also has an earnings report coming soon.
This makes it's a perfect candidate for what Tim Sykes calls an earnings winner.. according to his book penny stock guide.
They are rumours that Netflix will partner with Warner Music to make movies based on it's artists such as Bruno Mars.
This report hasn't been confirmed yet.
Do you see how pop culture is linked to the financial markets? Like I told you yesterday?
This is a great stock to trade and ride the 🚀.
Rocket Boost This Content To Learn More.
Disclaimer ⚠️ Trading is risky please learn about risk management and profit taking strategies.Also feel free to use a simulation trading account.

Netflix Is -11% Since June's All-Time High. What Its Chart SaysNetflix NASDAQ:NFLX has fallen more than 10% since hitting an all-time high in June, but the streaming giant is still beating the S&P 500 SP:SPX in the year-to-date, one-year and five-year periods. What does technical and fundamental analysis say is going on?
Let's take a look:
Netflix's Fundamental Analysis
NFLX has shed some 11% as of Tuesday afternoon since peaking at $1,341.15 intraday on June 30, easing especially over the four weeks despite little news.
The only recent negative catalyst came last week, when Citigroup analyst Jason Bazinet (rated at five stars out of a possible five by TipRanks) cut the stock's price target to $1,280 from a previous $1,295. Bazinet also reiterated Netflix's "Neutral" rating, which is considered a "hold-equivalent."
Still, the Citi analyst's $1,280 price target represents about a 7.5% move to the upside from where NFLX was trading at Tuesday afternoon.
Meanwhile, Wall Street expects Netflix to report Q3 results in some two weeks (on or about Oct. 21). The Street is looking for the firm to report $6.95 in adjusted earnings per share on about $11.5 billion of revenue.
If those numbers end up being accurate, that would compare favorably with the year-ago period, with a 28.7% gain from the $5.40 in adjusted EPS that NFLX reported in Q3 2024. Revenues would also have risen 17.3% from the $9.8 billion that Netflix saw a year earlier.
In fact, of the 33 sell-side analysts that I know of that cover Netflix, 27 have increased their earnings estimates since the current quarter began. Just five have cut their forecasts, while one estimate remains unchanged.
Netflix's Technical Analysis
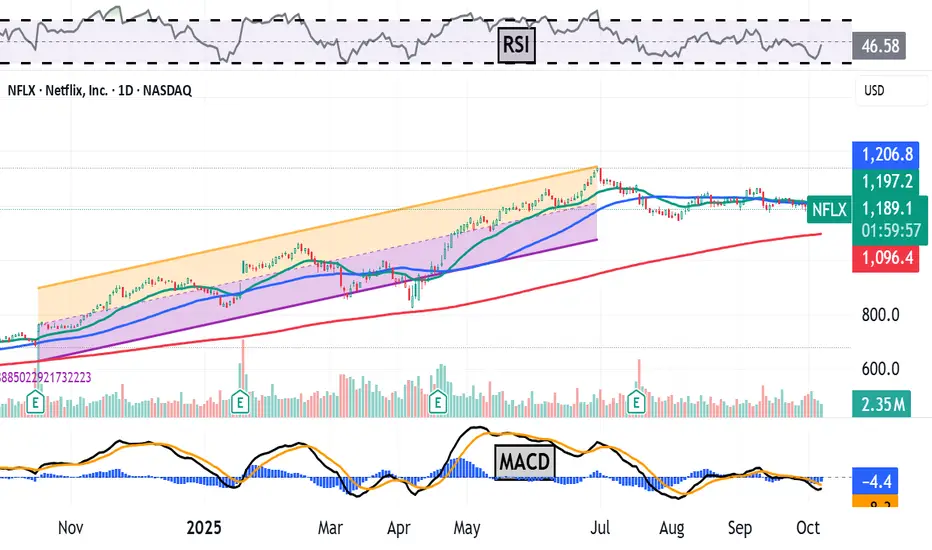
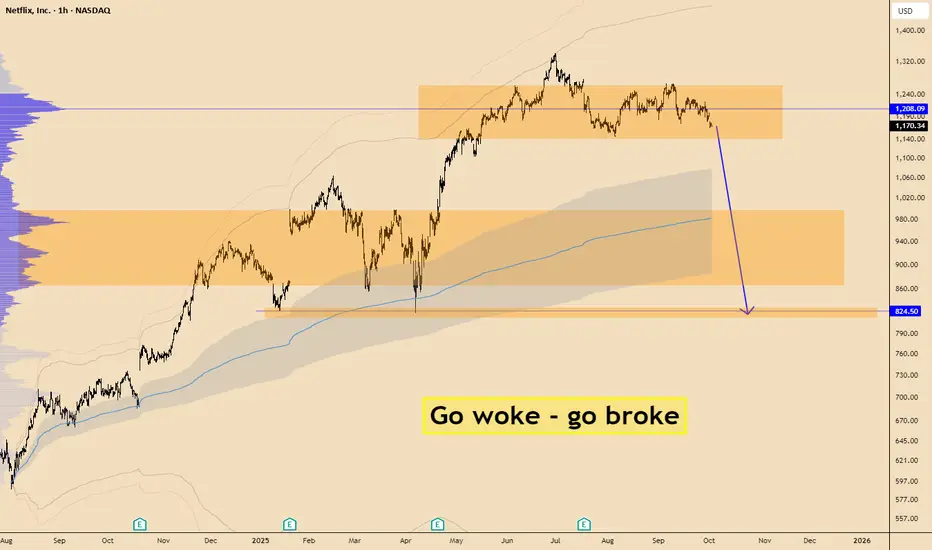
NFLX's one-year chart through Thursday afternoon was telling an interesting story:
Readers will see that the stock benefited from an upward sloping trend that stretched from Autumn 2024 into Summer 2025, as marked with orange and purple fields in the chart above.
This trend ended with NFLX peaking on June 30, with a new trend born the next day. The stock has generally pulled back since July 1 while creating a "falling-wedge" pattern, which is historically a sign of bullish reversal.
Netflix's upsides in the above pattern are the stock's 21-day Exponential Moving Average (or "EMA," marked with a green line) and its 50-day Simple Moving Average (or "SMA," denoted by a blue line). These two lines are running together, so I'll view them as a single pivot.
Now let's zoom in and look at Netflix's chart over just the past eight months:
I've added a "double-bottom" pattern to the above chart above using dotted lines. That's a second pattern of bullish reversal, and it exists inside of Netflix's falling wedge.
Granted, the stock's recent sell-off still has to find support around here. But if it does, NFLX will have just developed two simultaneous bullish patterns.
The double bottom would have a $1,268 pivot, which would be about $60 above the moving averages that we just mentioned. This pivot could produce considerably higher price targets for the stock.
That said, Netflix's other technical indicators above don't agree with such bullishness, or at least don't agree with it just yet.
For example, the stock's Relative Strength Index (the gray line at the chart's top) is relatively weak.
Similarly, Netflix's daily Moving Average Convergence Divergence indicator (or "MACD," marked with gold and black lines and blue bars at the chart's bottom) is close to neutral, as well as closer to bearish than bullish.
The 9-day EMA (the blue bars) is in negative territory, although not far from zero bound. Both the 12-day EMA (the black line) and 26-day EMA (the gold line) are also below zero, with the black line below the gold line. All three of these conditions are typically short- to medium-term bearish signals.
An Options Option
Options traders who want to get NFLX at a "discount" (and get paid to wait for it to potentially go higher) might consider a bull-put spread. This strategy is set up by selling a put while also buying a second put with a lower strike price.
Here's an example:
-- Sell (write) one Oct. 24 NFLX $1,140 put for about $45. This option could expire after Netflix reports earnings.
-- Buy one Oct. 24 NFLX $1,110 put for about $32.
Net Credit: $13
Traders in the above example would pay $1,140 a share for NFLX if forced to buy the stock due to assignment of the short put. However, their net basis would be $1,127 after deducting the net premium collected.
These traders also purchased some downside protection at $1,110 with the second put.
All in, that represents a maximum $30-per-share loss -- the $1,140 strike price on the first put minus the $1,110 strike price on the second.
However, the $13 net premium traders would collect on the entire bull-put spread would reduce the above strategy's maximum theoretical loss to $17 a share at expiration.
(Moomoo Technologies Inc. Markets Commentator Stephen "Sarge" Guilfoyle had no position in NFLX at the time of writing this column.)
This article discusses technical analysis, other approaches, including fundamental analysis, may offer very different views. The examples provided are for illustrative purposes only and are not intended to be reflective of the results you can expect to achieve. Specific security charts used are for illustrative purposes only and are not a recommendation, offer to sell, or a solicitation of an offer to buy any security. Past investment performance does not indicate or guarantee future success. Returns will vary, and all investments carry risks, including loss of principal. This content is also not a research report and is not intended to serve as the basis for any investment decision. The information contained in this article does not purport to be a complete description of the securities, markets, or developments referred to in this material. Moomoo and its affiliates make no representation or warranty as to the article's adequacy, completeness, accuracy or timeliness for any particular purpose of the above content. Furthermore, there is no guarantee that any statements, estimates, price targets, opinions or forecasts provided herein will prove to be correct.
The Analyst Ratings feature comes from TipRanks, an independent third party. The accuracy, completeness, or reliability cannot be guaranteed and should not be relied upon as a primary basis for any investment decision. The target prices are intended for informational purposes only, not recommendations, and are also not guarantees of future results.
Options trading is risky and not appropriate for everyone. Read the Options Disclosure Document ( j.moomoo.com ) before trading. Options are complex and you may quickly lose the entire investment. Supporting docs for any claims will be furnished upon request.
Options trading subject to eligibility requirements. Strategies available will depend on options level approved.
Maximum potential loss and profit for options are calculated based on the single leg or an entire multi-leg trade remaining intact until expiration with no option contracts being exercised or assigned. These figures do not account for a portion of a multi-leg strategy being changed or removed or the trader assuming a short or long position in the underlying stock at or before expiration. Therefore, it is possible to lose more than the theoretical max loss of a strategy.
Moomoo is a financial information and trading app offered by Moomoo Technologies Inc. In the U.S., investment products and services on Moomoo are offered by Moomoo Financial Inc., Member FINRA/SIPC.
TradingView is an independent third party not affiliated with Moomoo Financial Inc., Moomoo Technologies Inc., or its affiliates. Moomoo Financial Inc. and its affiliates do not endorse, represent or warrant the completeness and accuracy of the data and information available on the TradingView platform and are not responsible for any services provided by the third-party platform.
From Distribution to Defense Reading the Market’s MessageHello TradingView family, One thing about price it never forgets. Here’s how smart money distribute defends, tests, and retests the same levels to shape every trend.
So In this post we’ll explore how market structure evolves through repeated interactions with the same zones and why smart money often revisits prior levels to confirm or reject market direction.This phenomenon, often called reconfirmed demand and supply, offers valuable insight into how institutions defend, test, or abandon positions during structural transitions.
Understanding the Sequence--::
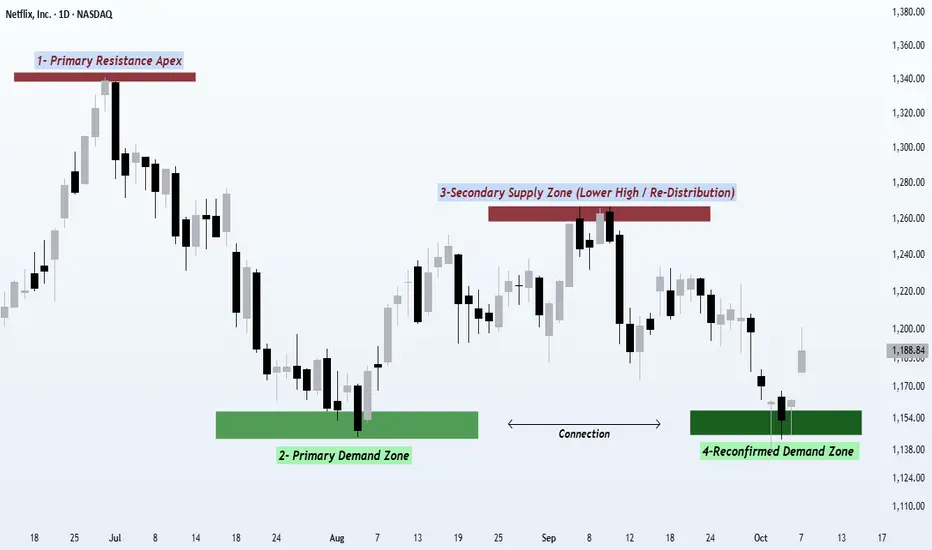
The price action we’re looking at highlights how an all-time high can transform into a repeating cycle of supply and demand a classic story of how the market moves in waves of distribution and accumulation.
Let’s walk through the four stages of this evolving structure 👇
1️⃣ Primary Supply Zone (Distribution High)--::
The first rally culminates in a zone where aggressive buying starts to weaken. Volatility increases, candles become larger, and momentum slows. This area represents smart money distributing positions where liquidity is abundant because breakout traders are still buying, and institutions can quietly sell into that strength. This phase often sets the benchmark high that defines the rest of the structure.
2️⃣ Initial Demand Zone (Accumulation Response)--::
After the distribution, price declines until new demand emerges. The downtrend pauses here, forming a clear demand base a level where institutional buyers see value and start building exposure again. This level often becomes the anchor of the upcoming structure, as it’s where the first response from buyers is confirmed by noticeable rejection and strength.
From here, the market begins to rebound.
3️⃣ Secondary Supply Zone (Lower High Confirmation)--::
The rally from the demand base faces resistance before reclaiming the prior high a lower high. This lower-high reaction is a crucial sign that supply remains dominant and that the recent buying was likely re-distribution rather than new strength. This is the zone where smart money offloads again, using the recent bounce to re-sell into liquidity. It also marks a Change of Character (ChoCH) and a potential trend transition.
It’s not a new high it’s the confirmation of a shift.
4️⃣ Reconfirmed Demand Zone (Previous Support Retest)
The final swing shows price declining back into the same demand zone from Stage 2. This zone isn’t new it’s a reconfirmation of prior institutional activity. When the same level holds again, it signifies that the same participants are defending the zone, maintaining the structure and keeping the market in balance. If the level breaks, however, it signals distribution completion the moment when prior demand can’t hold, and the market transitions into a markdown phase.
💡 The Bigger Picture--::
This repeating interaction between supply and demand is a snapshot of market psychology where the big players constantly test the same levels to validate whether the market still agrees with the prior valuation. Each touch, rejection, or breakthrough reveals who’s winning the battle between smart money and retail momentum.
By recognizing this pattern — distribution ➜ accumulation ➜ re-distribution ➜ retest — traders can better understand where the true liquidity zones are and how the market’s behavior constantly revolves around these zones.
This is not just about recognizing patterns it’s about understanding why these patterns form and how they reflect the business of smart money as they manage risk, scale positions, and trap liquidity.
🚀 Takeaway--::
When a previous level reacts again, the zone itself becomes part of the story not just a random reaction, but a confirmation of intent from bigger players. If you can read how the same zones behave on the second touch, you can anticipate where the next impulsive move or breakdown may occur. Mastering this pattern doesn’t just improve your entries it helps you think like the pros.
Regards- Amit.
Temporary relief, NFLX DOWNShort NFLX – October 6, 2025 📉
I’m taking a short position on Netflix (NFLX) today. While profits are higher, subscriber growth is slowing, which could put pressure on the stock in the near term, especially given market expectations and competitive streaming pressures.
Target Levels: $950–$925 for initial profit-taking
Catalysts:
Slower subscriber growth despite strong earnings
Competitive streaming landscape increasing long-term risk
Market sentiment turning cautious after recent headlines
Discipline is key—watch price action and volume closely.
Is Netflix Stock Headed Toward $1,100?Netflix shares are going through a difficult period, as the streaming giant has posted five consecutive losing sessions, with a decline of around 4.5% in recent trading days. For now, the selling bias has become dominant, driven by the viral "Cancel Netflix" campaign circulating on social media, where many users have decided to cancel their subscriptions following a recent controversy involving the company. As long as this negative sentiment fueled by the campaign remains in place, selling pressure is likely to continue playing a key role in the stock’s short-term movements.
Bearish Trend Emerges
Since early July, a series of lower highs has formed, establishing a solid downward trendline. In addition, price oscillations below the 100-period moving average reinforce the outlook for a consistent bearish bias. Unless a significant bullish correction occurs in the near term, selling pressure could continue to dominate, allowing the bearish trend to become more pronounced in the coming sessions.
RSI
The RSI line continues to show downward oscillations below the neutral 50 level, confirming that bearish momentum remains dominant over the past 14 trading sessions. However, the indicator is approaching the oversold zone, marked by the 30 level, and reaching this area could signal a market imbalance, potentially opening a window for short-term corrective rebounds.
MACD
The MACD histogram continues to display negative oscillations below the zero line, indicating that bearish directional strength remains dominant in the short-term moving averages. As the histogram continues to post lower values, selling pressure is expected to remain a key factor in the coming sessions.
Key Levels to Watch:
1,221 – Major Resistance: Corresponds to the area marked by the 100-period simple moving average. Price action breaking above this level could trigger a relevant bullish bias, putting the current downtrend at risk.
1,155 – Nearby Support: Represents the area of the latest price pullbacks. If price breaks below this level, the bearish trend could extend further in the short term, leading to sustained selling pressure. It may also act as a technical barrier capable of producing temporary bullish corrections.
1,097 – Critical Support: Corresponds to the zone marked by the 200-period simple moving average. A sustained break below this level could activate a more aggressive downtrend, likely defining the stock’s movements over the next few weeks.
Written by Julian Pineda, CFA – Market Analyst

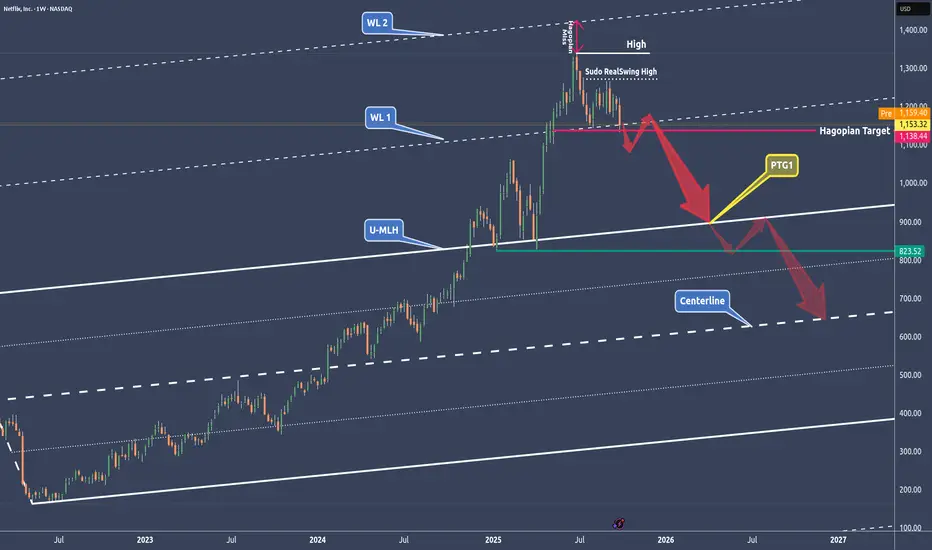
NFLX - NetFlix done after the run?🔱 A break of the WL1 could be the technical short signal 🔱
NetFlix had a monster run.
✅ Here’s a grounded fundamental breakdown of risks that could push Netflix downward. None of these are certainties, instead think of them as warning signs, not predictions.
👉 Slowing subscriber growth – growth in mature markets may plateau, and churn could rise if hit shows underperform.
👉 Rising competition and costs – rivals like Disney+ and Amazon force Netflix to spend more on content, squeezing profit margins.
👉 High valuation risk – expectations are lofty, so even a small earnings miss could trigger a sharp sell-off.
✅ Chart analysis
After missing WL2, we’ve got a Hagopian in play, which I’d say still hasn’t been fulfilled. The line was touched by a few ticks, but usually these lines break more decisively.
🔨 If we open and close below WL1, I’m stalking a pullback to it, just to hit the market on the head. If this break really happens, we’ll also have a clean structure for our stop, placed above the last RealSwing high.
🎯 The target is set in stone for me: It's the U-MLH and beyond, down to the Centerline.
Let’s stay focused and keep our cool.
Happy new week!
Netflix Investment Outlook Volume 2Top called July 27th, 2021, months prior. No surprises/remorse here! The idea is linked below.
Moving forward, Netflix's price action will be choppy and downward facing. ABC correction in progress; B wave recovery expected soon. Bottom of the historical channel - end game. Fundamentally, increased competition will continue the downtrend in subscriptions. Conclusion: Bear!

NFLX OCT 2025NFLX (4H): Price is hovering near the rising channel support after repeated rejections from the 1,300 supply. The 5.5B sell zone shows clear institutional distribution; bulls need absorption and a reclaim of the EPS line (~1,250) to regain momentum. Green support block at 1,100–1,050 remains the key demand—lose it and the path lower opens.
Target al alza:
1,250 (EPS reclaim) → 1,300–1,325 supply
Target a la baja:
1,100 → 1,050
#NFLX #globaltrade #investment #investing #stockmarket #wealth #realestate #markets #economy #finance #money #forex #trading #price #business #currency #blockchain #crypto #cryptocurrency #airdrop #btc #ethereum #ico #altcoin #cryptonews #Bitcoin #ipo

Netflix short the woke setup Looking to short Netflix next week. It had a blatant swing high at over valuation and then the FUD bomb hit. Turns out they are potentially paying people to groom small children, we will see. Technically I’m looking for the breakdown of OBV momentum (bottom indicator). We note blue flashed low volatility in falling volume.
When I looked for my PT it matched perfectly with the golden pocket of the entire move from a fib perspective.
My plan:
1,100$ puts November maybe December
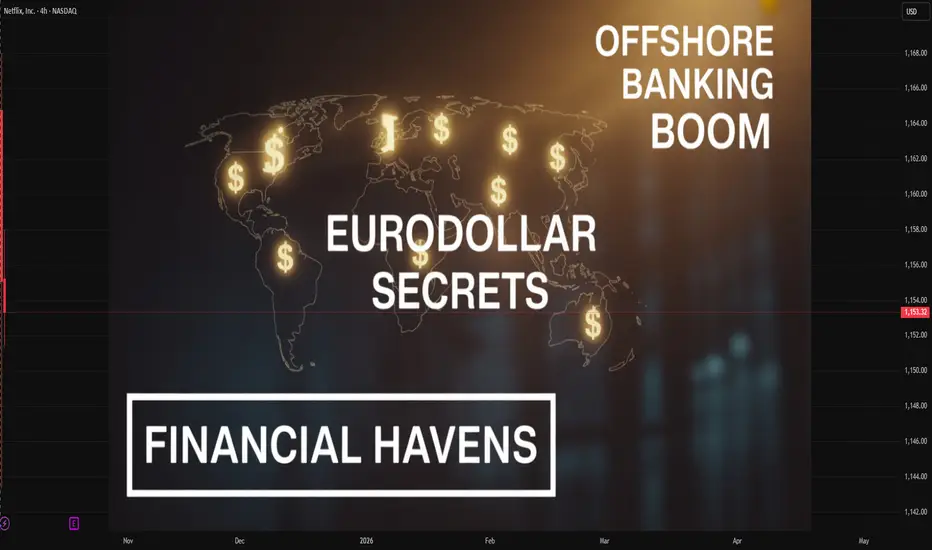
Eurodollar Secrets: The Hidden Engine of Global Finance1. Origins: The Birth of the Offshore Dollar System
The Eurodollar market began almost accidentally in the 1950s. During the Cold War, the Soviet Union and other nations feared their U.S. dollar deposits held in American banks could be frozen by Washington. To avoid that risk, they began placing their dollar deposits in European banks — primarily in London.
These dollars, though denominated in U.S. currency, were held outside the United States and therefore outside U.S. regulatory jurisdiction. Thus, the term “Eurodollar” was born — not because it was related to the euro currency, but because the dollars were deposited in Europe.
Soon, non-European financial centers like Singapore, Hong Kong, and the Cayman Islands joined the network, expanding the reach of Eurodollars across the globe. What began as a political workaround became a vast, unregulated financial ecosystem that allowed banks, corporations, and governments to borrow and lend U.S. dollars freely.
2. What Are Eurodollars, Really?
Eurodollars are simply U.S. dollar deposits held in foreign banks or in overseas branches of U.S. banks. These are not “physical dollars” but electronic bank liabilities — IOUs — that circulate globally among institutions.
Unlike domestic U.S. deposits, Eurodollar accounts are not subject to Federal Reserve reserve requirements, FDIC insurance, or U.S. banking regulations. This freedom made them attractive for banks and corporations seeking higher returns and lower costs.
In essence, the Eurodollar market represents a shadow dollar system, where private banks create dollar credit outside the official oversight of U.S. authorities. The result is a parallel monetary system that finances trade, investments, and even entire economies.
3. The Mechanics: How Eurodollars Work
Here’s how the system typically operates:
A corporation deposits U.S. dollars into a London bank account.
The London bank, in turn, lends those dollars to another corporation or financial institution.
The borrowing bank may relend the funds again, creating layers of interbank liabilities, similar to how fractional reserve banking multiplies money.
These transactions are recorded electronically — no physical dollars move across borders.
This process means Eurodollar banks can effectively create dollar liquidity just like U.S. banks, but without the Federal Reserve’s control. As a result, the Eurodollar market serves as a global money supply engine, often larger and more flexible than the domestic U.S. system.
4. Why Eurodollars Matter: The Global Liquidity Engine
The true secret of the Eurodollar system lies in its role as the world’s main source of dollar liquidity. Since the U.S. dollar is the global reserve currency, international trade and finance depend heavily on dollar funding.
For instance:
Oil and commodities are priced in U.S. dollars.
Emerging markets borrow in dollars to fund infrastructure.
Banks use dollar funding to back loans and securities.
When the Eurodollar market expands, global liquidity increases — financing booms, rising asset prices, and economic growth. Conversely, when Eurodollar credit tightens, liquidity dries up, leading to market selloffs, funding crises, and recessions.
Thus, many financial crises — from the 2008 Global Financial Crisis to the 2020 COVID liquidity shock — were actually Eurodollar shortages rather than traditional banking crises.
5. London: The Heart of the Eurodollar Market
London became the central hub of Eurodollar activity due to its unique regulatory flexibility. British authorities allowed banks to conduct dollar transactions without the restrictions faced in the United States.
By the 1970s, London’s financial institutions were offering higher interest rates on dollar deposits than U.S. banks could legally provide under domestic rate caps. This “Regulation Q arbitrage” attracted massive inflows of U.S. dollars offshore.
The result was a financial revolution: London turned into the “money capital of the world”, with Eurodollars as its primary fuel. To this day, the City of London remains the nerve center of offshore dollar finance, supported by a network of global branches from New York to Singapore.
6. The Rise of Eurodollar Instruments
The Eurodollar system gave birth to an array of financial instruments that expanded global finance:
Eurodollar deposits: Time deposits held in offshore banks.
Eurodollar loans: Dollar-denominated loans made between international banks or to corporations.
Eurodollar futures: Contracts traded on the Chicago Mercantile Exchange (CME) that allow hedging against changes in short-term interest rates.
Eurobonds: Bonds issued in dollars (or other currencies) outside the jurisdiction of the issuing country.
These instruments transformed Eurodollars from a simple deposit market into a complex web of global derivatives and debt markets, connecting every corner of the financial world.
7. Eurodollars and the Federal Reserve: A Complex Relationship
Although the Eurodollar market operates outside U.S. borders, it remains deeply intertwined with the Federal Reserve’s policies. When the Fed raises or lowers interest rates, Eurodollar borrowing costs often adjust in tandem.
However, during financial stress, the Fed’s lack of direct control over offshore dollar creation becomes a problem. To prevent global liquidity collapses, the Fed has often extended swap lines — agreements to lend dollars to foreign central banks — especially during crises like 2008 and 2020.
In short, the Fed is the ultimate backstop for a system it does not officially regulate — a paradox that reveals how interdependent the global monetary system truly is.
8. The Secret Power of Eurodollar Futures
Among the many innovations in this market, Eurodollar futures hold special importance. Traded on the CME since 1981, these contracts allow investors to bet on or hedge against future U.S. interest rates.
Each contract represents a three-month, $1 million deposit in the Eurodollar market, settled at the London Interbank Offered Rate (LIBOR). These futures became a benchmark for global interest rates, influencing everything from corporate loans to mortgage rates.
For decades, LIBOR reflected the cost of borrowing dollars in the Eurodollar market — effectively serving as the “global price of money.” Although LIBOR has now been phased out and replaced by SOFR (Secured Overnight Financing Rate), the Eurodollar market’s influence persists in other derivative and funding instruments.
9. The Eurodollar Market and Global Crises
The Eurodollar system’s opacity and leverage have often played central roles in global financial crises.
In 2008, many European and international banks had borrowed heavily in Eurodollars to fund investments in U.S. mortgage-backed securities. When those assets collapsed, these banks faced a dollar funding shortage, triggering a global liquidity freeze.
The Fed had to inject trillions of dollars into the system through emergency swap lines to restore stability.
In 2020, during the COVID-19 pandemic panic, corporations and investors worldwide rushed to hoard dollars, causing another Eurodollar squeeze. Once again, the Fed’s global dollar facilities saved the system.
These events reveal a hidden truth: the world runs on Eurodollars. When offshore dollar liquidity tightens, the entire global economy feels the shockwaves.
10. Eurodollars vs. Petrodollars
While both terms involve U.S. dollars, Eurodollars and Petrodollars are distinct concepts:
Eurodollars are offshore dollar deposits and loans, part of the global banking system.
Petrodollars are the proceeds oil-exporting nations earn by selling oil priced in U.S. dollars.
However, the two are closely linked. Oil revenues often flow into Eurodollar banks, reinforcing the system’s liquidity. The recycling of Petrodollars into Eurodollar markets during the 1970s and 1980s financed developing nations and global trade expansion.
11. The Eurodollar Market Today
Despite tighter regulations after 2008, the Eurodollar market remains enormous — estimated at tens of trillions of dollars in size. Offshore dollar deposits, loans, and derivatives continue to power trade finance, global investments, and cross-border banking.
Moreover, digital banking and fintech have introduced new dimensions to the Eurodollar world. Digital dollar transfers, stablecoins, and blockchain-based settlements are essentially the modern evolution of the same concept — dollar liquidity outside U.S. borders.
The Eurodollar market’s reach now extends into Asia, with Hong Kong, Singapore, and Tokyo serving as major centers for dollar funding. Its shadow influence continues to define credit cycles, capital flows, and even central bank policies.
12. The Hidden Risks and Future of Eurodollars
While the Eurodollar system provides global liquidity, it also carries hidden dangers:
Lack of Transparency: No central authority fully tracks Eurodollar flows, making it hard to measure real global dollar liquidity.
Credit Chain Fragility: The system relies on trust between banks; a loss of confidence can quickly freeze funding.
Dependence on the Fed: Despite being offshore, the system ultimately depends on the Federal Reserve for crisis rescue operations.
Shift to Digital Dollars: With the rise of central bank digital currencies (CBDCs) and stablecoins, the Eurodollar market may evolve or fragment further.
Going forward, the key challenge will be how global policymakers handle this vast, unregulated dollar shadow system without stifling the liquidity it provides.
13. The Secret of Its Endurance
Why has the Eurodollar market survived for over seven decades despite regulatory scrutiny and crises?
Because it fulfills a global need that no domestic system can: a flexible, efficient, and universal dollar credit market.
As long as the U.S. dollar remains the world’s dominant currency, offshore dollar demand will persist. The Eurodollar market, invisible to most, will continue to lubricate the wheels of world trade, finance, and investment.
It is the hidden heart of the global financial system — unregulated, essential, and immensely powerful.
Conclusion: The Invisible Dollar Empire
The Eurodollar market is not just a financial curiosity; it is the foundation of the modern global economy. It determines how money flows, how credit expands, and how crises unfold. While central banks and policymakers appear to control global liquidity, the truth is that much of the real money creation happens offshore, beyond their reach.
Understanding Eurodollars is understanding how the world really works. The next time you hear about a liquidity crisis, rate hike, or currency shock, remember: behind every movement in global finance lies the silent pulse of the Eurodollar system — the world’s most powerful and least understood monetary network.
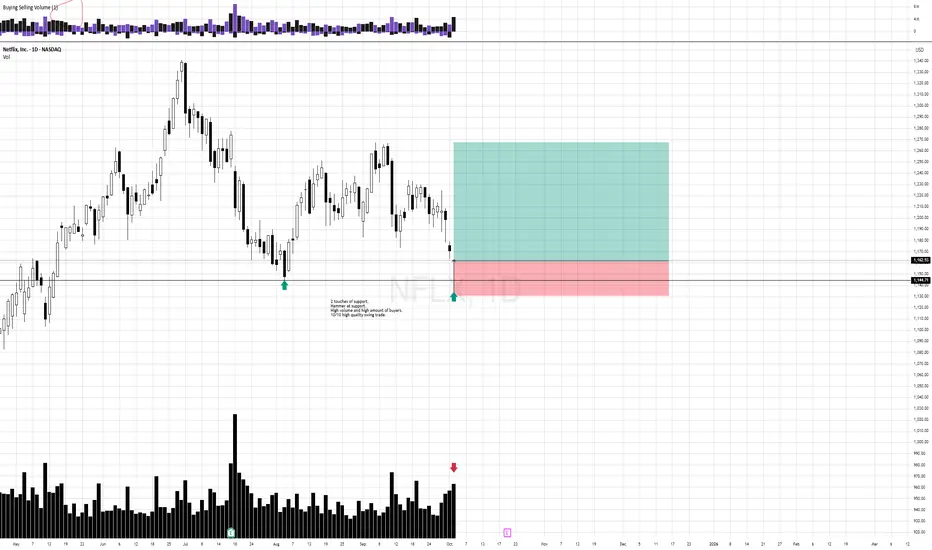
Not Cancelling NFLX... but it is looking a little weak still. Will we flush the recent lows today? Or is this a bottoming space. This could be the buy zone for investors.
+ Earnings 10/21
+ Wide range after a strong move up (at bottoms)
**I'll be Netflixing & chilling this weekend. There is a broad selection of content to entertain a variety of interests. I will watch what informs and/or entertains me. I hope you find time to do the same.

Looking like an immediate buy on NFLX!Thank you as always for watching my videos. I hope that you learned something very educational! Please feel free to like, share, and comment on this post. Remember only risk what you are willing to lose. Trading is very risky but it can change your life!
NFLX Technical Outlook: A Head and Shoulders PlayNetflix Technical Outlook
Structure and Pattern Recognition
Netflix has broken down from its ascending channel, confirming a break of structure (BoS) to the downside. Price failed to sustain at prior support, with the current setup resembling a potential head and shoulders pattern. The neckline sits just above $1,160, and further weakness could accelerate downside momentum.
Key Catalysts
Several developments could weigh on Netflix’s price action in the near term:
Tariff Concerns: Reports of the Trump administration exploring tariffs on foreign films present a potential headwind. Given that a significant portion of Netflix’s catalog comes from international productions, such a policy could increase costs or limit content availability.
Catalog Composition: Foreign films and shows have grown to represent a large share of Netflix’s offering, both in terms of content hours and global subscriber engagement. Any disruption could alter growth expectations.
Public Sentiment: Recent viral discussions and trending cancellations, fueled in part by tweets from Elon Musk criticizing Netflix’s content choices, add a sentiment-driven layer of volatility. While short-term reactions can fade, they underscore the platform’s exposure to cultural and political narratives.
These catalysts highlight risks around both fundamentals and perception, and traders should remain neutral when evaluating their potential impact on price direction.
Key Levels and Setups
Immediate resistance sits in the $1,200–$1,220 zone (bearish order block). A clean rejection here keeps sellers in control. On the downside, the first target lies near $1,050–$1,040 (bullish order block), with deeper potential into the $820–$840 range if the head and shoulders structure fully plays out.
Momentum and Volume
Momentum indicators confirm sustained selling pressure, with RSI holding in a bearish range. Volume spikes during breakdowns suggest institutional participation, adding conviction to the bearish structure.
Outlook and Scenarios
Bearish Case: Continuation of the breakdown leads to a retest of $1,050, and if breached, could confirm the larger head and shoulders, targeting $820–$840.
Bullish Case: A sharp reclaim of $1,220 and close back into the prior range would invalidate the bearish setup and shift focus back toward $1,280+.
Conclusion
Netflix sits at a vulnerable point, with technicals and sentiment leaning bearish. Macro catalysts—from trade policy to public perception—could amplify volatility around these levels. Traders should monitor the $1,200–$1,220 zone as the key pivot between recovery and deeper correction.

NFLXCancel NFLX trending and for good reason...
~77% decrease a la 2021-2022 isn't outside of the realm of possibilities...
Even if not such a dramatic decrease, seems like could pullback significantly and still retain "bullish" structure higher time frame...

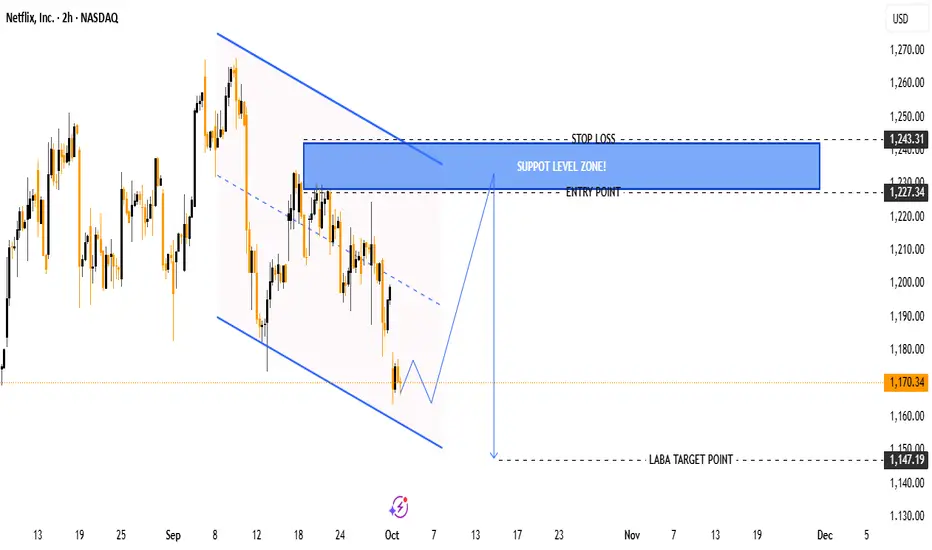
NFLX Bearish Trading Setup – Entry $1,227 | Target $1,147Ticker: Netflix (NFLX)
Timeframe: 2H (2-hour chart)
Current Price: $1,170.34
Chart Pattern: Descending channel (bearish trend continuation setup).
📉 Key Levels
Entry Point: $1,227.34
Marked as the level where price might retrace before resuming downward.
Stop Loss: $1,243.31
Positioned above the support/resistance flip zone to protect from false breakouts.
Target Point (LABA): $1,147.19
Expected downside target if the bearish move continues.
🧩 Technical Structure
The chart shows price moving within a descending channel.
The current price ($1,170.34) is near the lower boundary of the channel.
The analysis suggests a possible retracement (pullback) upward toward the support zone (blue area) before continuing the downtrend.
The blue box zone ($1,227 – $1,243) is a critical liquidity zone / resistance area, expected to reject price lower.
📊 Trading Plan (as per chart)
Sell/Short Setup:
Wait for retracement into the blue resistance zone ($1,227 – $1,243).
Enter short around $1,227.
Place Stop Loss above $1,243.
Take Profit near $1,147.
Risk/Reward:
Risk = ~ $16 (1,243 – 1,227).
Reward = ~ $80 (1,227 – 1,147).
Approx. R:R ratio = 1:5 (highly favorable).
✅ Summary:
This chart suggests Netflix (NFLX) is in a downtrend within a descending channel. A pullback to the $1,227–$1,243 zone could offer a shorting opportunity targeting $1,147, with a strong risk/reward ratio.
Elon Musk started a compane against Netflix Elon Musk started a compane against Netflix
i think it could lead to significat loss in user base
Honestly i also canceled my subssricption. Too much of woke propaganda there/
if price lose VWAP - it could lead to big loss
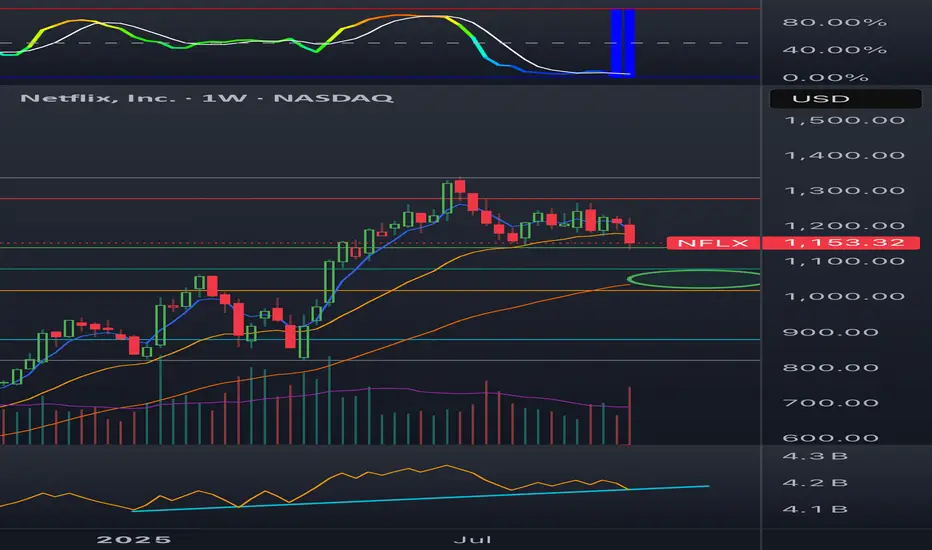
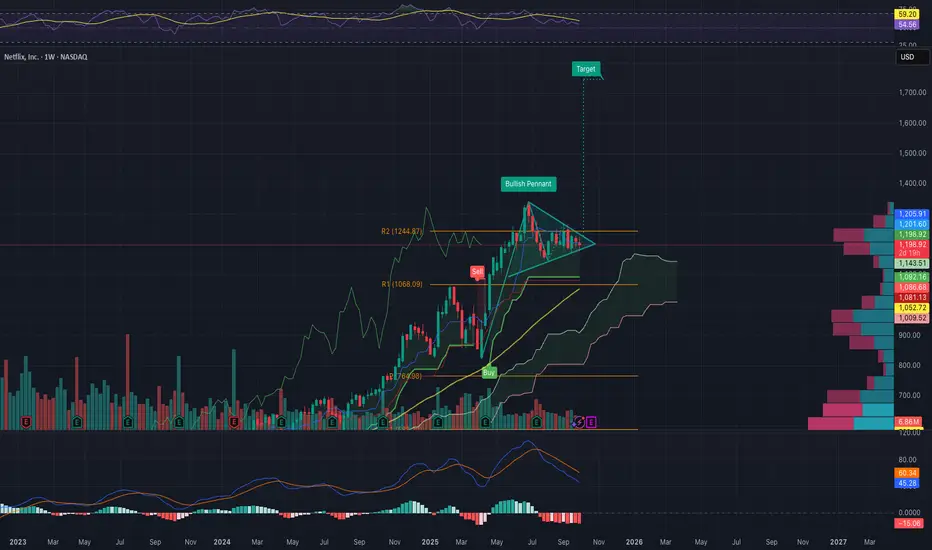
Bullish Pennant on the Weekly?Weekly looks good. Broader market stability and the volume profile on the daily scare me a bit. What do you guys think?
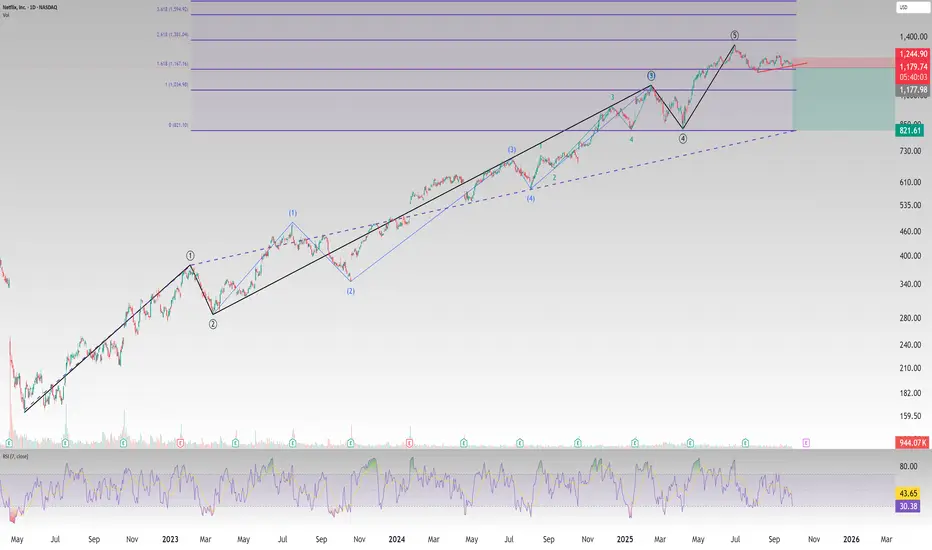
Netflix Short: Breakdown from trendlineOver in this chart, I present the big picture Elliott Wave counts and also the breakdown from a trendline that triggers this short idea.
The stop loss is set at 1245 and the take profit is set at the bottom of wave 4 around $822.
Good luck!
Risk, Psychology, and Performance in World Trading1. Understanding Risk in World Trading
Risk is the potential for loss or variability in trading outcomes. Every financial instrument carries inherent risks, which can be broadly categorized:
1.1 Market Risk
Market risk refers to the potential loss from adverse price movements in financial markets. Examples include:
Equity risk: Stock prices fluctuate based on corporate performance, macroeconomic conditions, and market sentiment.
Forex risk: Exchange rate movements affect international portfolios and trading strategies.
Commodity risk: Prices of oil, metals, and agricultural products are influenced by supply-demand imbalances, geopolitical tensions, and weather events.
Key concepts:
Volatility: A measure of price variability.
Beta: The sensitivity of an asset to broader market movements.
1.2 Credit Risk
Credit risk arises when a counterparty fails to meet obligations. In global trading, this includes:
Default risk in corporate bonds.
Counterparty risk in derivative contracts, particularly in OTC markets.
1.3 Liquidity Risk
Liquidity risk occurs when an asset cannot be quickly bought or sold without significantly affecting its price. Emerging markets and certain commodities often exhibit high liquidity risk.
1.4 Operational and Systemic Risk
Operational risk: Errors, system failures, or fraud within trading platforms or institutions.
Systemic risk: Market-wide events, such as financial crises, which impact multiple assets simultaneously.
1.5 Measuring and Managing Risk
Traders use quantitative and qualitative methods to manage risk:
Value at Risk (VaR): Estimates potential loss over a defined period with a given confidence interval.
Stress testing: Simulates extreme market scenarios to evaluate vulnerability.
Position sizing and leverage management: Controlling exposure to limit potential losses.
Global perspective: Risk management strategies differ across developed and emerging markets due to variations in liquidity, regulation, and market transparency.
2. The Psychology of Trading
Trading is as much a mental game as a technical one. Psychological factors influence risk perception, decision-making, and ultimately, performance.
2.1 Cognitive Biases in Trading
Traders are prone to systematic thinking errors, including:
Overconfidence bias: Overestimating one's skill or market knowledge.
Confirmation bias: Seeking information that supports pre-existing beliefs while ignoring contrary evidence.
Anchoring bias: Relying heavily on initial information, such as entry price, when making decisions.
Recency effect: Giving undue weight to recent market events.
These biases can lead to impulsive decisions, poor risk management, and losses.
2.2 Emotional Influences
Emotions such as fear, greed, and hope strongly impact trading behavior:
Fear: Fear of loss may prevent profitable trades or lead to premature exits.
Greed: Overexposure and chasing trends due to potential gains can magnify losses.
Hope: Holding onto losing positions in expectation of a rebound often exacerbates losses.
Case study: During the 2008 financial crisis, irrational fear led to widespread panic selling, amplifying market declines.
2.3 Stress and Cognitive Load
High-pressure trading environments increase stress levels, impairing decision-making. Studies show that traders under stress are more likely to:
Overtrade
Ignore risk management rules
Make emotionally-driven rather than rational decisions
2.4 Psychological Resilience and Performance
Successful traders cultivate resilience through:
Mindfulness and meditation to reduce emotional reactivity
Systematic routines to reduce cognitive load
Reflection and journaling to learn from mistakes
Global variation: Cultural factors also influence risk tolerance and emotional responses in trading. For example, traders in collectivist cultures may be more risk-averse than those in individualistic societies.
3. Risk-Reward and Decision Making
Trading performance depends on the ability to balance risk and reward while maintaining psychological control.
3.1 Expected Value and Probabilities
Understanding the expected value (EV) of trades helps in rational decision-making:
𝐸
𝑉
=
(
𝑃
𝑟
𝑜
𝑏
𝑎
𝑏
𝑖
𝑙
𝑖
𝑡
𝑦
𝑜
𝑓
𝐺
𝑎
𝑖
𝑛
×
𝐴
𝑣
𝑒
𝑟
𝑎
𝑔
𝑒
𝐺
𝑎
𝑖
𝑛
)
−
(
𝑃
𝑟
𝑜
𝑏
𝑎
𝑏
𝑖
𝑙
𝑖
𝑡
𝑦
𝑜
𝑓
𝐿
𝑜
𝑠
𝑠
×
𝐴
𝑣
𝑒
𝑟
𝑎
𝑔
𝑒
𝐿
𝑜
𝑠
𝑠
)
EV=(Probability of Gain×Average Gain)−(Probability of Loss×Average Loss)
Consistent focus on positive EV opportunities reduces reliance on luck.
3.2 Risk-Reward Ratio
The risk-reward ratio is critical for trade planning:
Acceptable ratio: Typically 1:2 or higher (risking $1 to potentially gain $2)
Integration with stop-loss and take-profit levels ensures disciplined execution
3.3 Position Sizing and Portfolio Diversification
Position sizing: Determines the amount of capital allocated per trade based on risk tolerance.
Diversification: Reduces portfolio risk by spreading exposure across instruments, sectors, and geographies.
3.4 Behavioral Pitfalls in Risk-Reward Assessment
Loss aversion: Overemphasis on avoiding losses can lead to missed opportunities.
Chasing losses: Attempting to “win back” money increases exposure to high-risk trades.
4. Performance Metrics in Trading
Performance evaluation combines objective and subjective metrics:
4.1 Financial Metrics
Return on Investment (ROI): Measures profitability relative to capital employed.
Sharpe Ratio: Risk-adjusted performance metric.
Drawdown: Measures peak-to-trough decline; critical for risk management.
4.2 Psychological Metrics
Discipline adherence: Following trading rules and strategies
Emotional regulation: Maintaining composure during market volatility
Decision quality: Avoiding impulsive or biased choices
4.3 Case Studies in Trading Performance
Hedge fund traders: Often combine quantitative analysis with psychological profiling to enhance consistency.
Retail traders: Performance heavily influenced by psychological factors due to limited risk management tools.
5. Risk and Psychology in Global Trading Environments
Different markets present unique challenges:
5.1 Developed Markets
High liquidity, transparency, and regulation
Psychological challenges: Information overload and high competition
Risk management: Advanced hedging strategies and derivatives use
5.2 Emerging Markets
Higher volatility and lower transparency
Psychological challenges: Fear of sudden market swings and limited access to reliable data
Risk management: Conservative position sizing and reliance on local expertise
5.3 Algorithmic and High-Frequency Trading
Machines execute trades with minimal emotional influence
Human oversight is still critical to manage unexpected market events
Traders need to adapt psychologically to new roles, focusing on system monitoring rather than traditional execution
6. Strategies to Improve Trading Performance
Integrating risk management and psychological training can enhance performance:
6.1 Risk Mitigation Techniques
Stop-loss orders: Automatic exit to limit losses
Hedging: Using derivatives to offset potential losses
Dynamic risk assessment: Adjusting exposure based on market conditions
6.2 Psychological Training
Mental conditioning to manage fear and greed
Cognitive behavioral strategies to counter biases
Visualization and simulation of trading scenarios
6.3 Continuous Learning and Adaptation
Regular review of trading logs to identify patterns
Staying informed about macroeconomic trends and geopolitical risks
Flexibility to adapt strategies when market conditions change
7. Interplay Between Risk, Psychology, and Performance
Effective trading requires harmonizing three elements:
Risk awareness: Knowing potential losses and managing them systematically
Psychological control: Maintaining discipline, focus, and emotional regulation
Performance optimization: Translating analysis, risk control, and mental resilience into consistent profitability
Key insight: Even the best strategies fail if psychological weaknesses dominate decision-making. Similarly, disciplined traders without robust risk frameworks are exposed to catastrophic losses.
8. Conclusion
Trading in world markets is a complex interplay of objective analysis, risk management, and human psychology. While quantitative models, technical tools, and global market insights provide a foundation, human factors ultimately dictate success or failure. Traders who understand and integrate risk management, psychological resilience, and disciplined decision-making are more likely to achieve sustainable performance.
In essence:
Risk is unavoidable, but manageable.
Psychology influences every decision, often more than market data.
Performance emerges from the synthesis of risk control and mental discipline.
Global trading is both a science and an art. Mastering it requires continuous learning, emotional intelligence, and strategic risk-taking. The traders who thrive are those who respect both the unpredictability of markets and the limits of their own psychology, creating a balance between caution and opportunity.
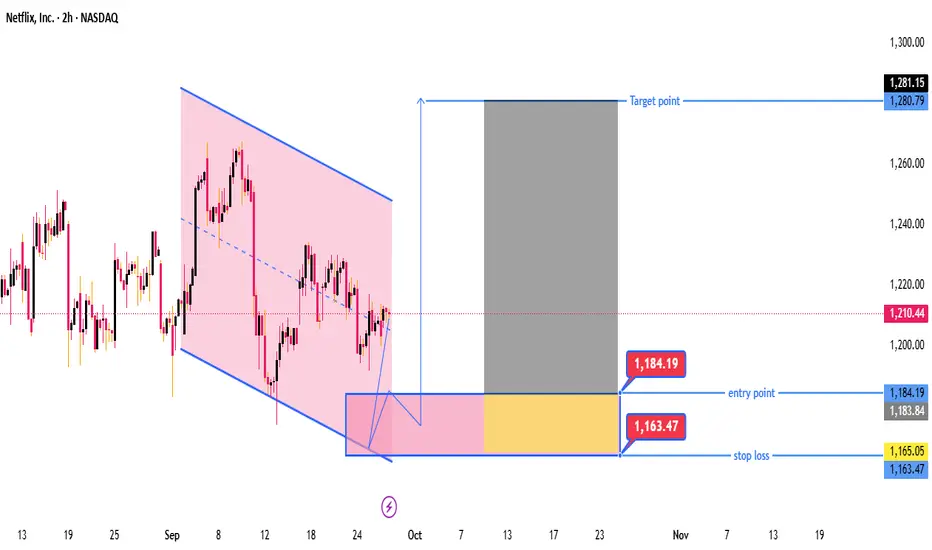
NFLX 2H Chart – Bullish Breakout with 4.68:1 RRR Trade SetupTicker: NFLX (Netflix, Inc.)
Timeframe: 2-hour
Current Price: $1,210.44
Trend: Price was moving in a downward channel (pink shaded area), but there's a potential breakout forming to the upside.
📉 Pattern Recognition
A falling channel is drawn (marked in pink).
The price appears to have broken out of this falling channel or is testing the breakout.
A bullish reversal is suggested, as there's a highlighted buy zone below the current price.
💡 Trade Setup
Element Value Description
Entry Point $1,184.19 Suggested buy zone
Stop Loss $1,163.47 Risk management level
Target Point $1,281.15 Projected upside target
🟨 Entry Zone
The blue box around $1,184.19 represents a demand zone (possible retracement buy area).
Yellow shaded area = refined zone of interest for buyers.
🟥 Stop Loss Zone
Stop loss below the demand zone, set at $1,163.47 (just below support structure).
Provides cushion against false breakouts.
🟦 Target Zone
Projected target at $1,281.15, aligned with previous resistance or measured move.
Expecting a trend continuation after the breakout.
⚖️ Risk-to-Reward Ratio (RRR)
Entry: $1,184.19
Stop: $1,163.47
Target: $1,281.15
Risk: $1,184.19 - $1,163.47 = $20.72
Reward: $1,281.15 - $1,184.19 = $96.96
📈 RRR ≈ 4.68:1 — very favorable.
🧠 Conclusion
This chart suggests a bullish breakout trade setup on Netflix.
The trade is designed to capitalize on the breakout from a downward channel.
High risk-to-reward setup.
Wait for price action confirmation in the entry zone before initiating a trade.
Watch for volume and overall market sentiment to confirm the breakout strength.
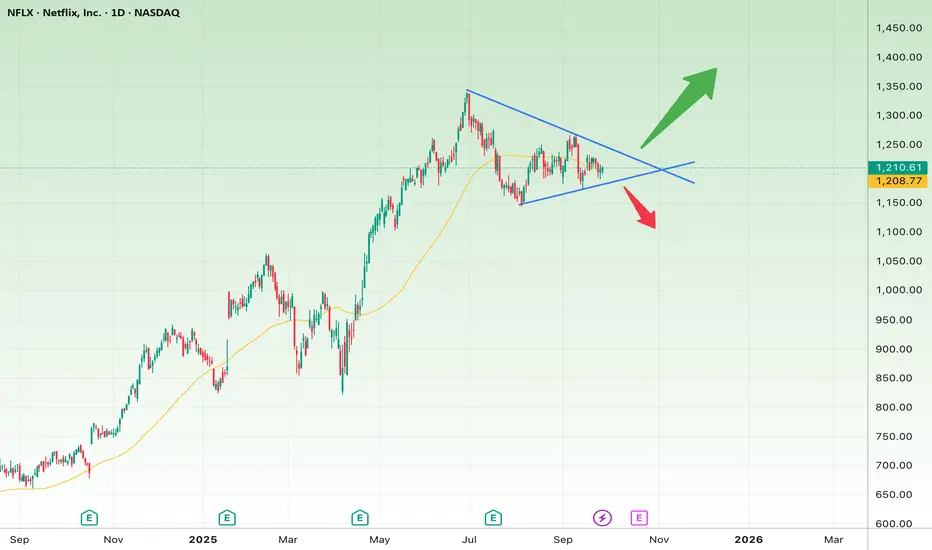
Netflix’s Make-or-Break Moment in a Symmetrical TriangleThe Netflix (NFLX) daily chart is showing a symmetrical triangle pattern. This usually forms before a strong breakout, and right now price is sitting at a decision point.
🔎 Short-Term Outlook (1–3 weeks)
Pattern: Symmetrical triangle around $1,200
Bullish Scenario:
A breakout above the upper trendline ($1,230–$1,240) could trigger strong buying momentum.
Targets:
First target: $1,300
Second target: $1,350
Stop-loss: Below $1,180
Bearish Scenario:
A breakdown below the lower trendline ($1,190) may lead to increased selling pressure.
Targets:
First target: $1,120
Second target: $1,050
Stop-loss: Above $1,240
🔎 Long-Term Outlook (2–6 months)
The overall trend since late 2024 has been bullish, with the 50-day moving average still supporting price action.
Bullish Scenario:
A confirmed breakout and consolidation above $1,240 could pave the way toward:
First target: $1,400
Second target (long-term): $1,500
Bearish Scenario:
If the triangle breaks downward and price holds below $1,150, the medium-term bullish structure could collapse.
Targets:
$1,050
$950 (key long-term support)
Stop-loss (long-term): Below $1,150
📌 Summary:
In the short term, the $1,190–$1,240 range is the key decision zone.
In the long term, the bias remains bullish unless price loses $1,150.
The Role of the WTO in the World Trade Market1. Historical Background of the WTO
1.1 Pre-WTO Era: The Need for Trade Rules
After World War II, countries realized that protectionism and trade wars had contributed to economic collapse during the Great Depression. To prevent such instability, the GATT (1947) was created as a provisional framework to reduce tariffs and promote multilateral trade.
GATT was successful in lowering average tariffs from around 40% in 1947 to under 5% by the early 1990s. However, it had limitations:
It was temporary and lacked a solid institutional foundation.
It focused mainly on goods, ignoring services, intellectual property, and investment.
It had weak enforcement mechanisms.
1.2 The Uruguay Round and the Birth of the WTO
The Uruguay Round of Negotiations (1986–1994) addressed these shortcomings. It expanded trade rules to cover services, agriculture, textiles, and intellectual property. Most importantly, it established a permanent organization — the WTO — on January 1, 1995.
Thus, the WTO became the central authority of global trade governance, providing stronger enforcement, a broader mandate, and a legal framework for international trade.
2. Objectives of the WTO
The WTO’s objectives are clearly stated in its founding agreement:
Promote Free and Fair Trade – by reducing tariffs, quotas, and other barriers.
Ensure Predictability – trade rules should be transparent and stable.
Promote Non-Discrimination – through the Most Favored Nation (MFN) and National Treatment principles.
Encourage Economic Growth and Employment – trade as a tool for development.
Protect the Environment and Social Standards – trade should be sustainable and responsible.
Resolve Trade Disputes Peacefully – ensuring stability in the global trade system.
3. WTO’s Core Principles in World Trade
3.1 Non-Discrimination
Most Favored Nation (MFN): Any trade concession given to one member must be extended to all.
National Treatment: Imported goods must be treated the same as domestically produced goods.
3.2 Free Trade through Negotiation
The WTO provides a platform for multilateral trade negotiations, reducing tariffs and barriers over time.
3.3 Predictability and Transparency
Trade rules are binding and published, ensuring businesses can plan with certainty.
3.4 Fair Competition
The WTO prohibits dumping, subsidies that distort trade, and other unfair practices.
3.5 Development and Inclusivity
Special provisions exist for developing and least-developed countries (LDCs), giving them longer transition periods, technical assistance, and preferential market access.
4. Functions of the WTO in the Global Trade Market
4.1 Trade Negotiations
The WTO provides a permanent forum where member nations negotiate trade liberalization. The most ambitious ongoing negotiation is the Doha Development Round (2001–present), aimed at making global trade fairer for developing countries.
4.2 Trade Regulation and Monitoring
The WTO enforces trade agreements like:
GATT (goods)
GATS (services)
TRIPS (intellectual property rights)
It regularly monitors trade policies through the Trade Policy Review Mechanism (TPRM).
4.3 Dispute Settlement Mechanism (DSM)
Perhaps the WTO’s most powerful role is as a global trade court. If countries believe their trade rights are being violated, they can bring a case before the WTO. The Dispute Settlement Body (DSB) provides binding rulings, preventing trade wars.
4.4 Capacity Building for Developing Nations
The WTO helps developing countries by:
Providing technical assistance
Offering special market access
Extending deadlines for compliance
4.5 Cooperation with Other Institutions
The WTO collaborates with the IMF, World Bank, and UNCTAD to align trade with global economic stability and development.
5. WTO’s Role in Shaping the World Trade Market
5.1 Liberalizing Global Trade
The WTO has reduced average global tariffs, promoting greater market access. World trade in goods and services has expanded significantly since its creation.
5.2 Promoting Fair Competition
Through rules on subsidies, anti-dumping, and intellectual property rights, the WTO ensures a level playing field.
5.3 Dispute Resolution as a Stabilizer
By preventing trade conflicts from escalating, the WTO has maintained global economic stability. Examples include disputes between the US and EU over aircraft subsidies (Boeing vs Airbus) and India’s export subsidies.
5.4 Encouraging Globalization and Integration
The WTO’s rules-based system has been a driver of globalization, integrating emerging markets like China, India, and Brazil into the global economy.
5.5 Addressing Non-Tariff Barriers
The WTO regulates behind-the-border issues such as technical standards, sanitary measures, and licensing requirements.
6. WTO and Developing Countries
6.1 Benefits for Developing Economies
Preferential treatment under Special and Differential (S&D) provisions.
Technical assistance to build trade capacity.
Improved access to global markets.
6.2 Criticisms
Some argue the WTO favors developed countries that dominate negotiations.
Compliance costs can be high for poor nations.
Agricultural subsidies in developed nations hurt farmers in developing countries.
7. Criticisms and Challenges Facing the WTO
7.1 Stalled Negotiations
The Doha Round has been deadlocked for years due to disagreements on agriculture, services, and intellectual property.
7.2 Rise of Regional Trade Agreements (RTAs)
Mega trade deals like the EU, CPTPP, and USMCA sometimes bypass WTO rules, weakening its central role.
7.3 Dispute Settlement Crisis
Since 2019, the WTO’s Appellate Body (final court of appeal) has been paralyzed due to the US blocking judge appointments. This threatens the credibility of its dispute system.
7.4 Protectionism and Trade Wars
The US-China trade war showed how unilateral tariffs challenge the WTO’s authority.
7.5 New Global Issues
The WTO has struggled to fully address e-commerce, digital trade, climate change, and sustainable development, which are becoming central to the global economy.
8. WTO and the Future of Global Trade
8.1 Digital Trade and E-Commerce
With cross-border e-commerce booming, the WTO is negotiating rules for digital trade.
8.2 Sustainable Trade
Balancing trade with environmental protection and carbon regulations will define the WTO’s next phase.
8.3 Inclusivity and Development
Ensuring developing countries are not left behind will remain a priority.
8.4 Reform of the Dispute Settlement System
Restoring the Appellate Body is essential for the WTO’s credibility.
8.5 Global Cooperation in a Multipolar World
As geopolitical rivalries rise, the WTO’s challenge is to remain the anchor of multilateralism in trade.
9. Case Studies of WTO’s Impact
9.1 China’s Entry into the WTO (2001)
China’s accession transformed global trade, making it the world’s largest exporter and integrating it into global supply chains.
9.2 Trade Dispute: US vs EU on Bananas
The WTO resolved disputes over banana trade, highlighting its role in balancing regional trade interests.
9.3 India’s Pharmaceutical Industry
Through TRIPS, India balanced intellectual property protection with access to affordable medicines.
10. Achievements of the WTO
Established a rules-based system for trade governance.
Expanded global trade, benefiting consumers with cheaper goods.
Created a functioning dispute settlement system.
Promoted development and inclusivity for weaker economies.
Prevented large-scale trade wars in the post-Cold War era.
11. Limitations of the WTO
Decision-making is slow due to consensus-based processes.
Developed nations still dominate negotiations.
Limited ability to enforce reforms in areas like climate change or labor rights.
Vulnerability to geopolitical tensions.
Conclusion
The World Trade Organization is both a cornerstone and a battleground of globalization. Its role in reducing trade barriers, promoting fairness, resolving disputes, and integrating developing nations has been monumental. Yet, its relevance is being tested by stalled negotiations, rising protectionism, and emerging challenges like digital trade and sustainability.
For the world trade market to remain stable and inclusive, the WTO must reinvent itself — reforming its dispute settlement system, addressing new trade realities, and strengthening the balance between developed and developing countries.
In essence, while imperfect, the WTO remains indispensable for maintaining order and fairness in the global trading system. Without it, international trade could easily revert to chaos, harming economies worldwide.
