Prudential Financial, Inc. (PRU) Benefits From Retirement DemandPrudential Financial, Inc. (PRU) provides insurance, retirement solutions, and investment management to millions of customers who want long-term financial stability. The company leans on steady demand for life insurance, growing retirement needs, and its broad global footprint. Growth comes from expanding annuity offerings, strong asset management flows, and people looking for dependable financial planning in every cycle.
On the chart, PRU printed a confirmation bar with increasing volume as price moved above the 0.236 Fibonacci level and into the momentum zone. A trailing stop can sit just under that 0.236 line using the Fibonacci snap tool, keeping risk tight while letting the trend develop.
Prudential Financial, Inc.
No trades
What traders are saying

$PRU with a Bearish outlook following its earnings #Stocks The PEAD projected a Bearish outlook for $PRU after a Positive over reaction following its earnings release placing the stock in drift B with an expected accuracy of 25%.

PRUDENTIAL PLCMonday, 14 November 2022
12:50 PM (WIB)
Prudential Plc is a holding company, which engages in the provision of insurance and financial services. It operates through the Asia and U.S. geographical segments. The Asia segment consists of health and protection, other life insurance, mutual funds, selected personal lines property and casualty insurance, group insurance, and institutional fund management. The U.S. segment includes fixed annuities, fixed index annuities, variable annuities (VA), and institutional product offerings. The company was founded on May 30, 1848, and is headquartered in London, United Kingdom.

$PRU with a Bullish outlook following its earnings #Stocks The PEAD projected a Bullish outlook for $PRU after a Negative over reaction following its earnings release placing the stock in drift C with an expected accuracy of 88.89%.

#PRUEntry = 112 - 113.5
Stop loss = 104
Take profit = 120 - 130
#PRU break out the side way zoon and try to achieve higher targets.

$PRU with a Bullish outlook following its earnings #Stocks The PEAD projected a Bullish outlook for $PRU after a Positive Under reaction following its earnings release placing the stock in drift A with an expected accuracy of 66.67%.


Long | PRUPRU
Possible Scenario: LONG
Evidence: Price Action
TP: 109$
Call options, Strike 120$, 06/18/21
* This is my idea and could be wrong 100%.

PRU: Contracting TriangleContracting Triangle
Please don't forget to FOLLOW, LIKE, and COMMENT ...
If you like my analysis:)
Thank you and Good Luck!

PRU 1W, Continuation To Gap-fill And Higher?Technical:
PRU has a lot of upside potential over the next few months with several clean areas of liquidity on the chart. The first target I'm looking for is the 91.00 area to fill that gap. If we get up there, we may see a pullback depending on whether price moves to that point in a thin way or a slower, more efficient way. The next targets after that will be 98.00 above old highs, followed by 107.00 above the next old clean highs. However, I'd like to see a good pullback before pushing higher. This week created a big gap and I'd like to see price pull back towards 64.00, or even a healthy pullback just below 60.00, but not much further.
Fundamental:
I'm bullish on the overall market as we look closer to a gradual recovery and I'm especially bullish on companies that sell life insurance. Shortly after previous epidemics, life insurance companies saw their stock prices rise because a lot of sick and elderly people died within a short time span, while at the same time a lot more people started buying life insurance because it suddenly seemed more relevant, and there were less sick and elderly for insurance companies to make payouts too. They added a lot of customers and paid out less than they normally would.

PRUDENTIAL FINANCIAL Opportunity DailyHey traders, PRUDENTIAL FINANCIAL is in a fake downtrend with a large buying volume traded. Looking at the TIMEFRAME M1 we see a dragon bear candle with a large purchase volume. There is a good chance that we go on the last previous high that we can well notice on the TIMEFRAME H1. This title allows to know the motivation of buyers currently.
Please LIKE & FOLLOW, thank you!


LAST CHANCE TO ACCUMULATE .WILL ADD MORE IF IT COMES DOWNLAST CHANCE TO ACCUMULATE .WILL ADD MORE IF IT COMES DOWN.LONG TERM

GOOD STOCK FOR LONG TERM .IF IT CLOSES BELOW 57 NEXT SUP @ 48 GOOD STOCK FOR LONG TERM TGT ABOVE 120 .IF IT CLOSES BELOW 57 NEXT SUPPORT @ 48 -50


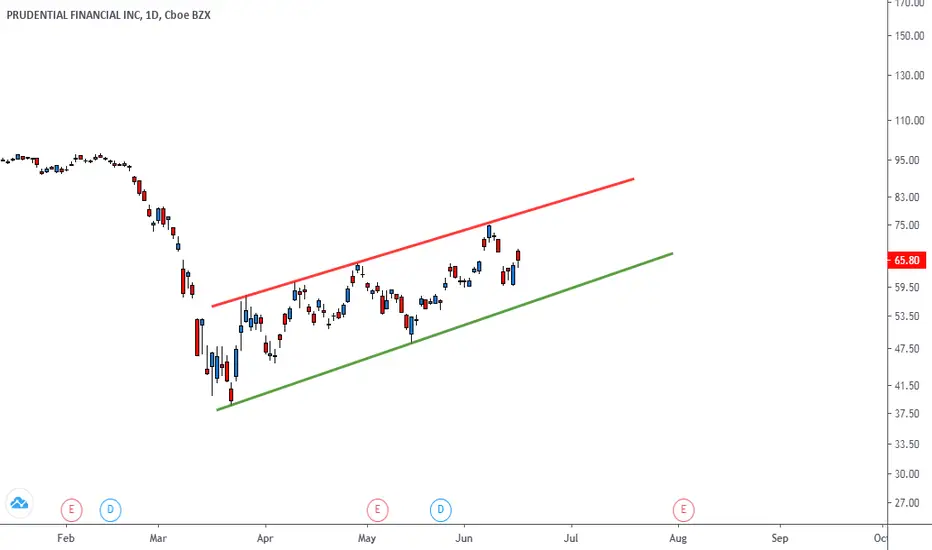
The wedge will be broke to the upside?I just discover PRU and they seem to me like a promising opportunity.
The company has currently a fair PE of 9.5. A positive sales and earnings per share growth during the last 5 years. A debt/equity under 1, institutional ownership over 60% and positive insider transactions.
They also have an active presence in social networks and a decent amount of followers.
From my point of view, the stock will continue revaluing. The price is recovering and the resistance wedge will be broke to the upside. There will be maybe a retest over the wedge and the price will continue ascending. The historical maximum will be tested and probably won by the bullish trend, going from here toward higher prices before a correction.
Best regards.

PRU and their LinesWARNING:
This is Probably crazy enough to Work
A ) When the yellow line is descending or ascending, and the strong trend line (White Line) is rising, and the bottom dollar trend line(Green Line) is rising, if the green line passes the middle White line first, it followed the red arrow.
B ) When the yellow white and red lines are ascending, and the middle white line crosses with the yellow line... It followed the green arrow.
I went back to similar movements, and mapped out similar lines, with similar time lines.
I know it's weird, but
I like to draw lines on charts.
Sometimes I don't even know what the company does.. But their lines talk to me

Pru pushPru to push to 97, 100 if it can pass 95.5
Trade 96/96.5 C
Trigger line in blue
Target lines in green
Positive EMA convergence on daily with 20 crossing 200 and 50 crossing 100
Stochastic looking strong too


