DR Reddy Laboratories Swing TradeHello,
Trend-Based Analysis. Buy the Dips, Sell The Rallies, Also Following the Trend. Let's see where the Price Action takes us, Riding the wave. Potential trade setups based on trend momentum.
Technical analysis based on trend identification and momentum, Looking for high-probability setups within the prevailing trend.
Analyzing the current market trend and potential future price movement. Focusing on risk management and reward-to-risk ratios.
Details is Mentioned in Chart, Read carefully.. .
Trade ideas
Dr. Reddy | Exited Short | Taken Long | BTSTAs I mentioned in my earlier post today, there was an inherent risk in shorting Dr. Reddy and that came true. Since the price was above the Daily Pivot, the bias was indeed bullish.
A long trade has now been initiated for a target to the above resistance zone. This would be a BTST type trade.

DR Reddy | Short | STBTThis price structure is similar to my earlier post about Bajaj Auto.
Clear rejection from the highs after a gap up opening.
Short position can be initiated for a target to 1230.
This however could be slightly more riskier than Bajaj Auto because the price is above the Monthly Pivot. So that risk element needs to be taken into consideration.

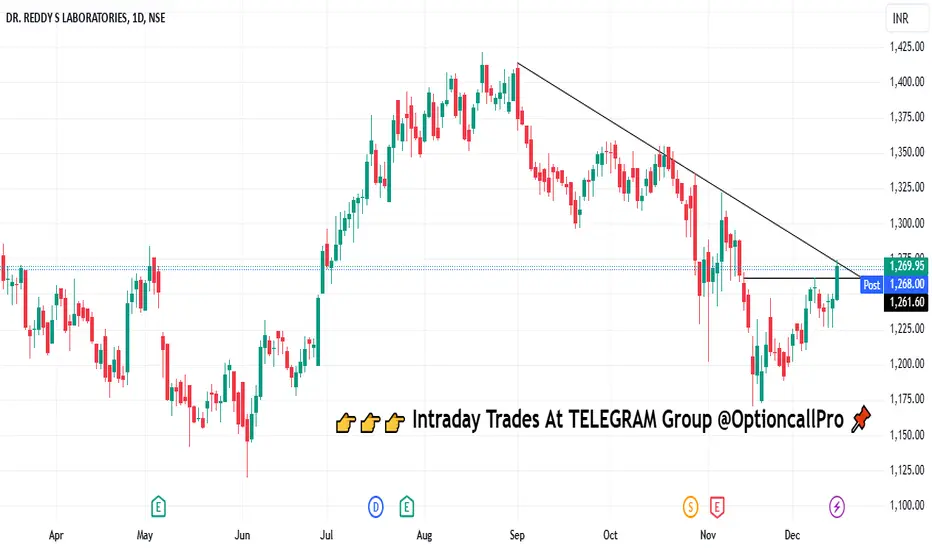
Dr reddy 1W time frame Buy @ 1268 target @ 1408, 1419,1454 Dr reddy 1W time frame
Buy @ 1268 target @ 1408, 1419,1454
Risk reward 1:1
Ascending channel
Its just a view trade@ your own risk


Triple top chart weekly Triple top chart weekly suggests bearish reversal trend with neckline 1251
Entry Any high near to 1251
Target 1040

Triple top chart weekly Triple top pattern suggests bearish reversal trend with neckline 1251.
Breaked out done .
Entry -Any high near to neckline
Target - 1039


Bearish Flag Pattern on Dr. Reddy's LaboratoriesThe 1-hour chart for Dr. Reddy's Laboratories (NSE) indicates a bearish flag pattern forming after a recent downtrend. The price is currently consolidating within a small upward channel, suggesting a continuation of the previous bearish move.
Current Price: 6,600.00 INR
Resistance Level: Around 6,600.00 INR
Support Level: 6,526.05 INR
The volume is relatively low, which is typical during consolidation phases. A break below the support level of 6,526.05 INR could confirm the bearish continuation, potentially leading to further downside.

drreddy foe swing
buy near 6380
avg at near 6280
sl 6150 4%sl
use capital / 15%of averall capital
tgt4%8%12%

DRREDDY- Analysis for Swing and Long TermOne's looking to buy DRREDDY at a better price can wait and buy around 6200 levels as marked on chart.
This level is a good support, so can be useful for both swing traders to open new positions and for Investors to add on dips.
We need a strong bullish momentum at the support to consider this analysis.
Keep an alert and watch the price movement.
Please do LIKE and FOLLOW if you need more analysis like this.

DR. REDDY LABThe Structure looks good to us, waiting for this instrument to correct and then give us these opportunities as shown on this instrument (Price Chart).
Note: Its my view only and its for educational purpose only. Only who has got knowledge about this strategy, will understand what to be done on this setup. its purely based on my technical analysis only (strategies). we don't focus on the short term moves, we look for only for Bullish or Bearish Impulsive moves on the setups after a good price action is formed as per the strategy. we never get into corrective moves. because it will test our patience and also it will be a bullish or a bearish trap. and try trade the big moves.
we do not get into bullish or bearish traps. We anticipate and get into only big bullish or bearish moves (Impulsive Moves). Just ride the Bullish or Bearish Impulsive Move. Learn & Know the Complete Market Cycle.
Buy Low and Sell High Concept. Buy at Cheaper Price and Sell at Expensive Price.
Please keep your comments useful & respectful.
Keep it simple, keep it Unique.
Thanks for your support
Tradelikemee Academy
Saanjayy KG

Dr Reddy Next Target 7200Dr Reddy will see good momentum in the coming sessions. It is expected that the stock can give returns of 5 to 10 percent in a short period. The stock is moving to new highs after hitting another breakout on the monthly, weekly and daily charts.


Review and plan for 29th July 2024Nifty future and banknifty future analysis and intraday plan in kannada.
Stocks to watch - included.
This video is for information/education purpose only. you are 100% responsible for any actions you take by reading/viewing this post.
please consult your financial advisor before taking any action.
----Vinaykumar hiremath, CMT

DR REDDYS LABS S/R for 15/7/24Support and Resistance Levels: In technical analysis, support and resistance levels are significant price levels where buying or selling interest tends to be strong. They are identified based on previous price levels where the price has shown a tendency to reverse or find support.
Support levels are represented by the green line and green shade, indicating areas where buying interest may emerge to prevent further price decline.
Resistance levels are represented by the red line and red shade, indicating areas where selling pressure may arise to prevent further price increases. Traders often consider these levels as potential buying or selling opportunities.
Breakouts: Breakouts occur when the price convincingly moves above a resistance level (red shade) or below a support level (green shade). A bullish breakout above resistance suggests the potential for further price increases, while a bearish breakout below support suggests the potential for further price declines. Traders pay attention to these breakout signals as they may indicate the start of a new trend or significant price movement.
20 EMA: The yellow line denotes 20 EMA, to interpret the 20 EMA, you need to compare it with the prevailing stock price. If the stock price is below the 20 EMA, it signals a possible downtrend. But if the stock price is above the 20 EMA, it signals a possible uptrend.
Disclosure: I am not SEBI registered. The information provided here is for learning purposes only and should not be interpreted as financial advice. It is important to consult with a qualified financial advisor before making any investment decisions. Tweets neither advice nor endorsement.

Dr. Reddy's Laboratories Limited - Breakout Setup, Move is ON...#DRREDDY trading above Resistance of 6474
Next Resistance is at 7803
Support is at 5786
Here are previous charts:
Chart is self explanatory. Levels of breakout, possible up-moves (where stock may find resistances) and support (close below which, setup will be invalidated) are clearly defined.
Disclaimer: This is for demonstration and educational purpose only. This is not buying or selling recommendations. I am not SEBI registered. Please consult your financial advisor before taking any trade.

Pharma in focus - DrReddy close to breakoutDrReddy is forming a good ascending triangle.
Pharma/Hospital companies are rising lately with some good earning calls.
A close above 6000 would lead to new highs.
SL: 5500
Targets: 6450/7200

DR REDDY'S LABS S/R for 29/624Support and Resistance Levels: In technical analysis, support and resistance levels are significant price levels where buying or selling interest tends to be strong. They are identified based on previous price levels where the price has shown a tendency to reverse or find support.
Support levels are represented by the green line and green shade, indicating areas where buying interest may emerge to prevent further price decline.
Resistance levels are represented by the red line and red shade, indicating areas where selling pressure may arise to prevent further price increases. Traders often consider these levels as potential buying or selling opportunities.
Breakouts: Breakouts occur when the price convincingly moves above a resistance level (red shade) or below a support level (green shade). A bullish breakout above resistance suggests the potential for further price increases, while a bearish breakout below support suggests the potential for further price declines. Traders pay attention to these breakout signals as they may indicate the start of a new trend or significant price movement.
Disclosure: I am not SEBI registered. The information provided here is for learning purposes only and should not be interpreted as financial advice. It is important to consult with a qualified financial advisor before making any investment decisions. Tweets neither advice nor endorsement.

plz suggest ase wale setups chelte h kyacup and hundle pattern plz tell if this is work in such a way

Dr Reddy's Dr Reddy's can give a good INTRADAY to SWING trade with a decent stoploss and good Targets
ENTRY - 6060
STOPLOSS - 6025
TARGETS - 6180, 6240, 6300++
Note- if any trade or value that's gone from the marked levels then that's not our trade just let it go or wait for it to come back
I'm not sebi registered this is my personal view
Please like or boost my idea if you like it or traded it
Thankyou

DR.REDDY'S LAB - CUP AND HANDLEDr Reddy's Lab has formed a long-term Cup & Handle pattern and has reached a resistance level. A breach of this resistance shall entail a rise in price level by another INR 1500 from current levels. Let us keep track of it.
#drreddylab #drreddy #drreddy'stechnicalstudy #drreddy'scup&handlepattern #drreddy'spricelevel #drreddy'slabpricetarget
