Reliance Intra day shortReliance as it is likely to test around 1500 levels.
Intraday short opportunity can be seen from the marked levels for 1:2
Entry to be done if 15 mins candle closes below the previous candle or when it leaves the zone.
Maintain proper position size.
Trade ideas

Reliance Industries – Key Weekly Chart Setup | Strong SupportReliance Industries – Key Weekly Chart Setup | Strong Support Zone & Rebound Potential 🚀
Ticker: RELIANCE (NSE)
Timeframe: Weekly
Current Price: ₹1,299.50
Technical Indicators: 200W MA, Fibonacci Retracement, MACD Divergence
🔍 Technical Analysis Insight:
Reliance Industries is currently hovering around its 200-week moving average (MA) (~₹1,220–₹1,225 zone), which has historically acted as a strong long-term support. This confluence with the 61.8% Fibonacci retracement from the previous rally (₹1,608.55 to ₹1,121.55) makes this zone crucial.
Support Zone: ₹1,220–₹1,225
Immediate Resistance: ₹1,362–₹1,380 (near 38.2% retracement & 50W MA)
MACD: Showing bullish crossover on the weekly, along with a positive divergence — signaling potential trend reversal.
📌 If broader markets continue in a rebound phase, Reliance could rally up to 20% in a relatively short span. Targets could be ₹1,460 (23.6% retracement) and ₹1,600 (previous swing high).
🛑 Risk Management Note:
Keep an eye on volume confirmation. A weekly close below ₹1,200 could invalidate the bullish setup and warrant re-evaluation.

RIL S/Rsanthosh
Support and Resistance Levels:
Support Levels: These are price points (green line/shade) where a downward trend may be halted due to a concentration of buying interest. Imagine them as a safety net where buyers step in, preventing further decline.
Resistance Levels: Conversely, resistance levels (red line/shade) are where upward trends might stall due to increased selling interest. They act like a ceiling where sellers come in to push prices down.
Breakouts:
Bullish Breakout: When the price moves above resistance, it often indicates strong buying interest and the potential for a continued uptrend. Traders may view this as a signal to buy or hold.
Bearish Breakout: When the price falls below support, it can signal strong selling interest and the potential for a continued downtrend. Traders might see this as a cue to sell or avoid buying.
MA Ribbon (EMA 20, EMA 50, EMA 100, EMA 200) :
Above EMA: If the stock price is above the EMA, it suggests a potential uptrend or bullish momentum.
Below EMA: If the stock price is below the EMA, it indicates a potential downtrend or bearish momentum.
Trendline: A trendline is a straight line drawn on a chart to represent the general direction of a data point set.
Uptrend Line: Drawn by connecting the lows in an upward trend. Indicates that the price is moving higher over time. Acts as a support level, where prices tend to bounce upward.
Downtrend Line: Drawn by connecting the highs in a downward trend. Indicates that the price is moving lower over time. It acts as a resistance level, where prices tend to drop.
Disclaimer:
I am not SEBI registered. The information provided here is for learning purposes only and should not be interpreted as financial advice. Consider the broader market context and consult with a qualified financial advisor before making investment decisions.
1290-1220 : if come then Investment is good to startReliance : 1290-1220 ideal buy levels.
Till then wait n watch only from my side.
Target : 1700-2000
SL : 1165
Manage Your Risk

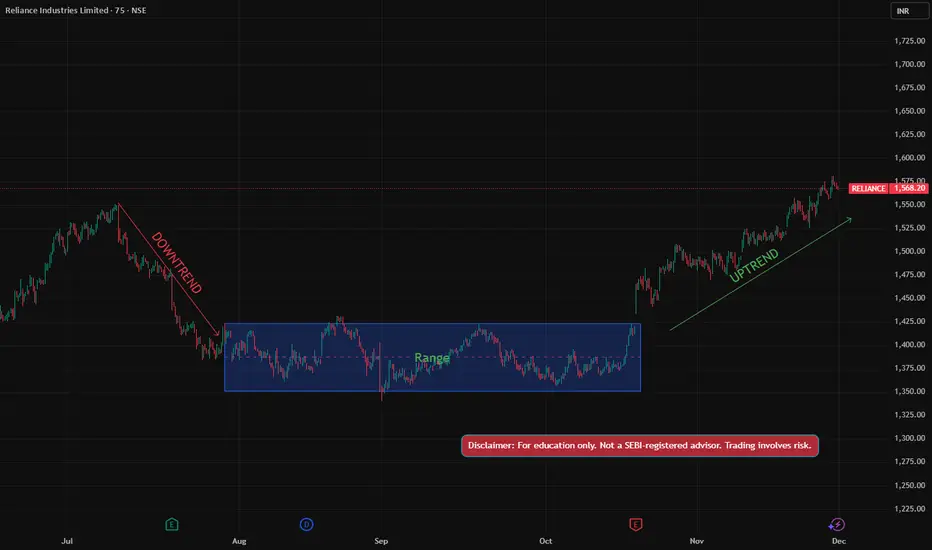
Understanding Market Structure – The Foundation of Price Action📌 Description
Market Structure defines the direction and strength of price.
• Uptrend → Higher Highs & Higher Lows
• Downtrend → Lower Highs & Lower Lows
• Range → Balanced market between support & resistance
Key concepts:
• BOS (Break of Structure) → Trend continuation or reversal confirmation
• CHoCH (Change of Character) → Early warning of trend shift
✅ Mark structure first
✅ Align entries with volume & levels
✅ Trade with the trend, not predictions
Structure controls everything. Indicators only support it.
Disclaimer:
This content is for educational purposes only.
I am not a SEBI registered investment advisor or research analyst.
Views expressed are personal and based on technical analysis.
Trading involves risk. Please consult a SEBI registered advisor before trading.
I am not responsible for any financial losses.
Reliance Looking Good...Buy REL at current level and all dips
Target1 - 3000
Target2 - 3200
Target3 - 3627 (if close above 3210)
Disclaimer :-
I am not SEBI registered. The information provided here is for education purposes only.
I will not be responsible for any of your profit/loss with this channel suggestions.
Consult your financial advisor before taking any decisions

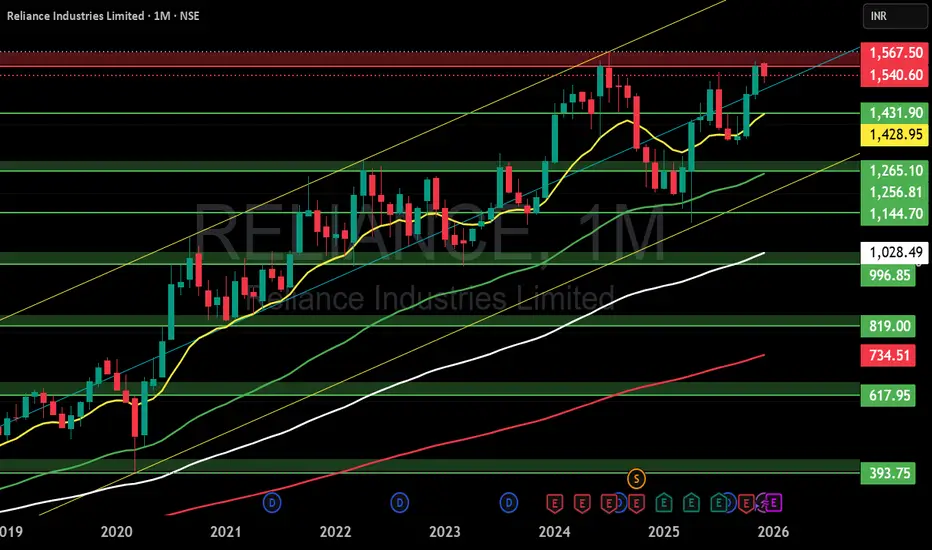
REL Inds : Major Red Band Resistance vanished. REL Inds : important milestone achieved.
Major stubborn Red Band Resistance vanished Momentum continues after a Buy Signal.
Next important level : 1600
( Not a Buy / Sell Recommendation
Do your own due diligence ,Market is subject to risks, This is my own view and for learning only .)

RELIANCE | Buy if weekly Close above 1545RELIANCE | Buy if weekly Close above 1545 | SL below 1500 on closing basis | 1st Target 1880
Disclaimer (Please Read Carefully):
This is not investment advice. The stocks shared here are purely for educational and informational purposes. Please do your own research or consult with a financial advisor before making any investment decisions.
******************************************************************************************************************
Stock market में सिर्फ risk ही risk होता है। Market में survive करने का एक ही तरीका है, stop loss को पूरी discipline के साथ accept करना। अपनी capital को protect करने का इससे बेहतर कोई तरीका नहीं है।
मैं जो भी stock यहाँ शेयर करता हूँ, वो या तो मेरी existing holding में होता है, या फिर मैं उसी level पर fresh buying या add on करता हूँ जिसे मैं mention करता हूँ।
मैं हमेशा buy करते समय अपने system में stop loss ज़रूर लगा देता हूँ, और मेरे लिए stop loss, target से भी ज़्यादा important होता है।
Target achieve होने के बाद मैं पहले profit book करता हूँ और फिर retest या fresh breakout का इंतज़ार करता हूँ।
मैं सिर्फ breakouts पर buy करता हूँ, कभी भी support पर नहीं। और मैं resistance पर sell भी नहीं करता।
******************************************************************************************************************
The stock market involves risk, risk, and only risk. To survive in the market, accepting stop-loss with discipline and without hesitation. There is no other way to protect you capital.
Any stock I share is either already part of my existing holding or I take a fresh entry at the same level I mention. I always place the stop-loss in my system at the time of buying, and I give the highest importance to stop-loss more than the target. Once the target is achieved, I usually book profit once and then wait for either a retest or a fresh breakout.
I buy only on breakouts, never on supports. I also do not sell at resistance levels.
That is simply my trading style.


Reliance Industries_16.11.20251520 to 1550 to 1600 soon possible, Index directional influence may rule.

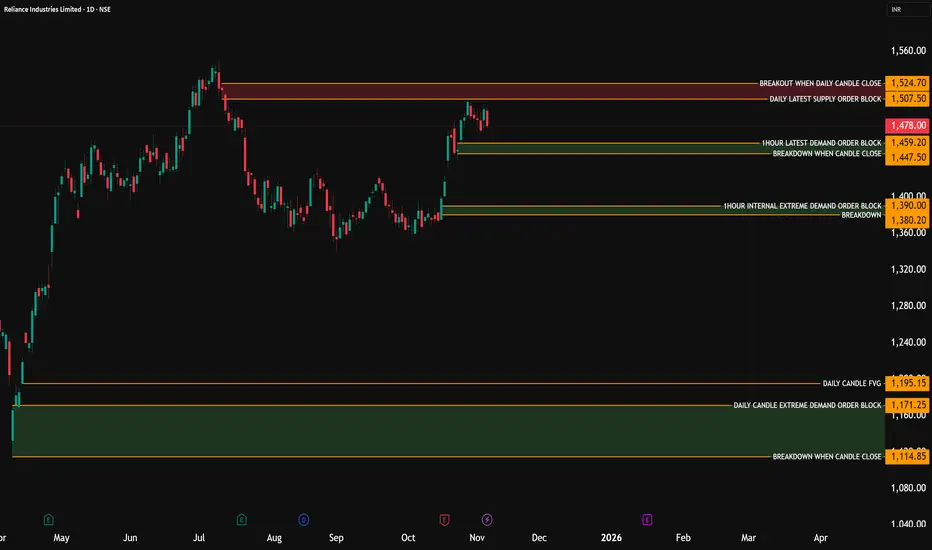
RIL: Navigating Key Supply & Demand Zones for Future MovementIntroduction:
This analysis focuses on the daily chart of Reliance Industries (RIL), highlighting critical supply and demand zones that are likely to dictate its price action in the coming weeks and months. We observe a recent uptrend followed by a pullback, and the current price action is situated at crucial junctures.
Key Observations & Zones:
Daily Latest Supply Order Block (Resistance):
Zone: 1,507.50 - 1,524.70 (highlighted in red)
Significance: This is a formidable resistance area. A daily candle closing above 1,524.70 would signal a strong bullish breakout, potentially targeting higher price levels. Until then, this zone acts as a ceiling, where sellers have historically stepped in. We've seen a recent rejection from this area, confirming its strength.
1-Hour Latest Demand Order Block (Immediate Support):
Zone: 1,447.50 - 1,459.20 (highlighted in yellow)
Significance: This is the immediate support zone identified from a lower timeframe (1-hour chart). For bulls to maintain control in the short term, RIL needs to hold above 1,447.50. A breakdown below this level could trigger further downside pressure.
1-Hour Internal Extreme Demand Order Block (Strong Support):
Zone: 1,360.00 - 1,390.00 (highlighted in green)
Significance: This represents a much stronger demand zone, likely to attract significant buying interest if the price reaches it. This is a key area for potential reversals or strong bounces. A breakdown below 1,360.00 would be a significant bearish development, suggesting a deeper correction.
Daily Candle Extreme Demand Order Block (Long-Term Support):
Zone: 1,160.00 - 1,195.15 (highlighted in a broader green box)
Significance: This is a crucial long-term demand zone. If RIL experiences a substantial correction, this area is expected to provide very strong support. A daily candle close below 1,114.85 (the lowest yellow line beneath this zone) would invalidate this demand and indicate a major shift in the long-term trend.
Current Price Action & Outlook:
RIL is currently trading within the proximity of the 1-hour latest demand order block. The stock is attempting to find support here after being rejected from the daily supply zone.
Potential Scenarios:
Bullish Scenario: A strong bounce from the current levels or the 1-hour internal extreme demand order block (1,360-1,390), followed by a decisive daily close above 1,524.70, would confirm renewed bullish momentum.
Bearish Scenario: A daily close below 1,447.50 could lead to a test of the 1-hour internal extreme demand order block. A breakdown below 1,360.00 would open the doors for a deeper correction towards the long-term daily candle extreme demand order block.
Conclusion:
RIL is at a critical juncture. Traders should closely monitor how the price reacts to these identified supply and demand zones. The levels of 1,524.70 on the upside and 1,447.50 (short-term) / 1,360.00 (medium-term) on the downside will be pivotal in determining its near to medium-term trajectory.


Reliance - Cup & Handle Pattern on Weekly Time FrameReliance is setting up for a major breakout after long consolidation.
Weekly structure & macro sentiment support an 8–15% up-move in coming 3–4 months if ₹1,500+ holds.
Bias: Bullish
Accumulation zone: ₹1,480–1,525
Breakout zone to watch: ₹1,540–1,600

RELIANCE Industries Ltd for 30th Oct #RELIANCERELIANCE Industries Ltd for 30th Oct #RELIANCE
Resistance 1510 Watching above 1513 for upside momentum.
Support area 1490 Below 1500 gnoring upside momentum for intraday
Watching below 1487 for downside movement...
Above 1500 ignoring downside move for intraday
Charts for Educational purposes only.
Please follow strict stop loss and risk reward if you follow the level.
Thanks,
V Trade Point

RELIANCE — The MONSTER WAVE 3 Isn’t Over Yet!📈 Summary:
Reliance isn’t done yet — the structure shows a powerful Wave 3 still unfolding with institutional strength behind it.
Expect a controlled Wave 4 retracement (₹800–₹500) before the next super rally — Wave 5 toward ₹10,000 (3.618%) .
📈 Elliott Wave count + SMC + Fundamentals all scream continuation!
Smart money is accumulating , not distributing — this is the calm before the storm.
🔥 Wave 3 builds wealth. Wave 5 creates history.
📊 Elliott Wave Confluence:
The stock remains within Wave 3 , unfolding with strong impulsive momentum and clean internal sub-waves.
Wave 3 is expected to mature around the 2.618 extension (~₹2,875) , but structure still supports further upside before exhaustion.
A Wave 4 correction will likely retrace toward the 0.382–0.5 Fib zone (₹800–₹500) , forming a deep yet healthy reset.
The grand finale — Wave 5 — targets the 3.618 Fibonacci extension (~₹10,000) , aligning with long-term macro growth and structural expansion. 🚀
💰 Smart Money Concept (SMC) Insight:
Institutional order flow remains bullishly displaced — no evidence of full distribution yet.
Expect Wave 4 to be the “smart money re-entry zone,” with liquidity sweeps and accumulation before the final push.
Wave 5 could trigger the euphoric phase where late retail chases and institutions start scaling out at premium valuations. 🧠💵
📈 Price Action Perspective:
Trend remains structurally bullish — higher highs and higher lows dominate.
A break above ₹1,600–₹1,700 confirms Wave 3 continuation.
Once the market consolidates into Wave 4, watch for equal lows, demand absorption, and BOS confirmations to catch early Wave 5 entries.
Wave 5 is expected to be sharp, emotional, and momentum-driven — classic of late-cycle impulsive waves. ⚙️📊
🌍 Fundamental Confluence:
Reliance’s expansion across energy, telecom, AI, green tech, and retail supports this wave count perfectly.
The next decade’s growth catalysts — digital ecosystem scale-up, Jio financial inclusion, and renewables — align with Wave 5’s “valuation explosion” narrative.
Fundamentals mirror Elliott psychology: Wave 3 = justified growth, Wave 4 = consolidation, Wave 5 = euphoria-driven expansion . 💹🌏
🔮 Expectations Ahead:
📍 Wave 3 Target: ₹2,800–₹3,000 range (2.618 fib).
⚠️ Wave 4 Retracement: ₹800–₹500 (accumulation & re-entry zone).
🚀 Wave 5 Target: ₹10,000 (3.618 extension — the ultimate cycle peak).
💎 Final Thought:
Reliance is still in the driver’s seat of its Wave 3.
Wave 4 will give patient bulls one final golden entry before Wave 5 — the ₹10,000 super cycle — rewrites market history.
Traders & Analysts
"This might be the mega move of the decade — and it’s happening right in front of us. 🔥
Reliance (RELIANCEIND) is still charging through a powerful Wave 3, and there’s plenty of air above before any major correction even begins. 🚀
Our Elliott Wave models show Wave 3 has not peaked yet — momentum, structure, and institutional flow all confirm that the current rally could still extend toward the ₹2,800–₹3,000 zone before any Wave 4 cooldown.
But here’s the big picture: after Wave 4’s healthy reset, the final Wave 5 explosion could drive prices to a massive ₹10,000 target (3.618 extension) — a potential super-cycle top years in the making. 💎
📈 Smart money isn’t exiting — it’s riding Wave 3 and preparing for the ultimate Wave 5 payoff.
Timing this phase could define your decade in trading. ⚡
So, traders — how far do you think Wave 3 can run before the big reset?
Drop your targets below 👇 and let’s see who rides this wave all the way to ₹10,000! 💰🌊”
— Team FIBCOS
#Reliance #ElliottWave #NSE #SmartMoney #PriceAction #WaveTheory #TechnicalAnalysis #TradingView #Investing #StockMarketIndia #RelianceIndustries #SwingTrading #LongTermInvesting #Wave3 #Wave5 #BullishIndia #ChartAnalysis #WealthBuilding #MarketStructure #Fibonacci #Wave4Accumulation

Reliance Industries Ltd for 27th Oct #RELIANCEReliance Industries Ltd for 27th Oct #RELIANCE
Resistance 1460 Watching above 1462 for upside momentum.
Support area 1440 Below 1440 gnoring upside momentum for intraday
Watching below 1437 for downside movement...
Above 1460 ignoring downside move for intraday
Charts for Educational purposes only.
Please follow strict stop loss and risk reward if you follow the level.
Thanks,
V Trade Point

Reliance Industries Ltd for 23rd Oct #RELIANCE Reliance Industries Ltd for 23rd Oct #RELIANCE
Resistance 1470-1475 Watching above 1476 for upside momentum.
Support area 1450 Below 1450 gnoring upside momentum for intraday
Watching below 1448 for downside movement...
Above 1470 ignoring downside move for intraday
Charts for Educational purposes only.
Please follow strict stop loss and risk reward if you follow the level.
Thanks,
V Trade Point

RELIANCE INDUSTRIES-EMA Golden Cross OverReliance Power :Trading at 1465.
In daily chart trading above all its critical EMA Viz 20/50/100/200 and moreover 20 DEMA crossed all other moving averages-GOLDEN CROSS OVER.
Momentum and Golden crossover suggests a possible move towards 1480/1500+(For educational purpose only)

REL Inds : Buy Triggered on Friday REL Inds: Buy triggered on Friday 17th Oct 2025.
Be mindful of a major Red Band Resistance Level as displayed on the chart.
( Not a Buy / Sell Recommendation
Do your own due diligence ,Market is subject to risks, This is my own view and for learning only .)

Reliance !! Breaking out !!Reliance, a fresh Breakout can be seen in next trading days. Let's see how it works.

Reliance Industries Ltd for 17th Oct #RELIANCEReliance Industries Ltd for 17th Oct #RELIANCE
Resistance 1400 Watching above 1404 for upside momentum.
Support area 1380 Below 1380 gnoring upside momentum for intraday
Watching below 1377 for downside movement...
Above 1400 ignoring downside move for intraday
Charts for Educational purposes only.
Please follow strict stop loss and risk reward if you follow the level.
Thanks,
V Trade Point

Reliance Industries Ltd for 16th Oct #RELIANCEReliance Industries Ltd for 16th Oct #RELIANCE
Resistance 1390 Watching above 1393 for upside momentum.
Support area 1365 Below 1380 gnoring upside momentum for intraday
Watching below 1364 for downside movement...
Above 1380 ignoring downside move for intraday
Charts for Educational purposes only.
Please follow strict stop loss and risk reward if you follow the level.
Thanks,
V Trade Point
