“Goldman’s $1B Headline vs. Market Structure — The Crown Point L📊 Crown Point Research – Market Structure Proven in T. Rowe Price (NASDAQ: TROW)
📅 Date: 4th September 2025
When Goldman Sachs announced a $1B equity commitment in T. Rowe Price, headlines screamed “massive bullish breakout.”
Retail traders rushed in above $116, believing momentum would never fade.
But Crown Point Research took a different view:
🔹 Our Analysis (Before the Move):
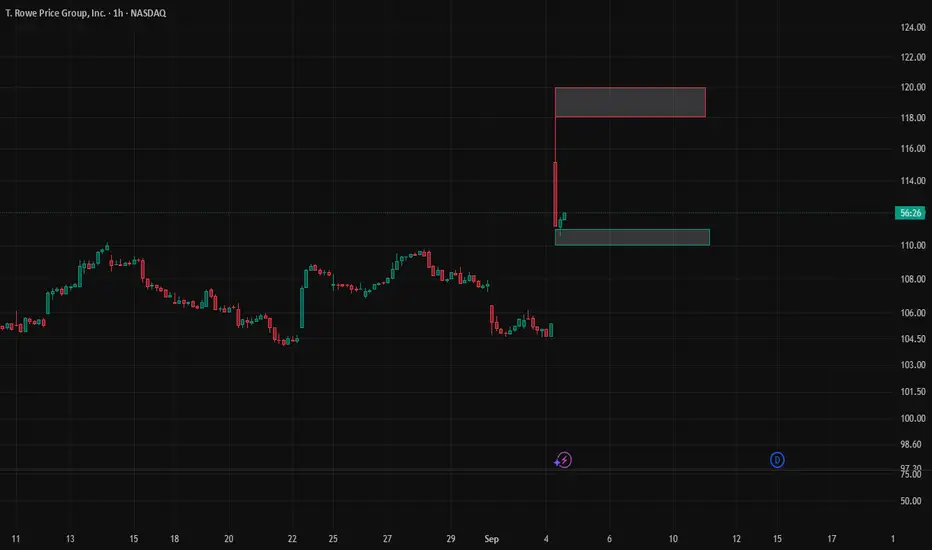
Macro Resistance: $118–120 → flagged as the upper ceiling.
Macro Support: $104–106 → defined as the institutional base.
Micro Range: $110–115 → expected consolidation zone.
Projection: Pullbacks were opportunities, not reversals, as long as $104 held.
🔹 What Happened:
Price spiked on the news, retail bought late.
Institutions booked early, letting the stock rebalance.
Pullbacks exactly respected the $110–115 consolidation before settling.
🔹 Result:
Crown Point Research correctly mapped the institutional behaviour.
We showed how news-driven rallies often mask distribution at the top — while the real play lies in understanding structure, levels, and psychology.
⚡ Lesson for Traders:
“Retail follows headlines, institutions follow structure. Every spike carries opportunity, but only if you see the gates before they open.”
📖 At Crown Point Research, our goal is to turn chaos into structure and prove—time and again—that precision outperforms hype.
#crown_point_research
#marketstructure
#usstocks
#institutionalstrategy
#tradingpsychology
Trade ideas

“T. Rowe Price Rockets on Goldman’s $1B Backing — Structure Reve📖 Crown Point Research – Social Market Update
Stock: T. Rowe Price (NASDAQ: TROW)
Date: 4th September 2025
Time: 09:10 PM IST
🔹 Fundamental News
Goldman Sachs commitment: Up to $1B equity purchase in T. Rowe Price → a rare institutional backing headline.
This triggered a 7%+ intraday surge, before settling lower.
Broader U.S. market moved on jobs data and tech resistance levels.
🔹 Public Sentiment & Human Behaviour
Retail: Chased the initial breakout above $116, buying late into the spike.
Institutions: Entered early, now letting pullbacks rebalance before next leg.
“T. Rowe rockets on Goldman deal” — but Crown Point notes this was a retest of an upper ceiling, not a breakout.
🔹 Current Structure
Macro View
Support: $104–106
Resistance: $118–120
Structure: Growth → Maturity stage. Controlled pullback after institutional spike.
Micro View
Support: $110–111
Resistance: $114–115
Behaviour: Intraday pullbacks forming, rebalancing after the surge.
🔹 Projection
Primary Path (65%): Hold $110–111 base → retest $114–115.
Alternate Path (25%): If $110 breaks, drift toward $104–106 macro
Low Path (10%): A fresh breakout above $120 requires extraordinary momentum or further institutional buying.
🔹 Pullback Levels
Shallow: $111–112
Medium: $110
Deep: $104–106
🔹 Final View
Bias (Macro): Bullish, as long as $104 holds. Swing path open toward $118–120.
Bias (Micro): Short-term consolidation between $110–115; pullbacks are opportunities, not reversals.
🔹 Essence (Philosophy Line)
“Macro shows a top at 120 and a bottom at 104. Micro waves are rebalancing between 110 and 115. In structure, pullbacks are gates to re-entry, not collapse — unless the sea gives way.”
⚠️ Disclaimer
“This analysis is shared for educational and research purposes only. It is not financial advice, trading advice, or investment recommendation. Market decisions are entirely your own responsibility.”
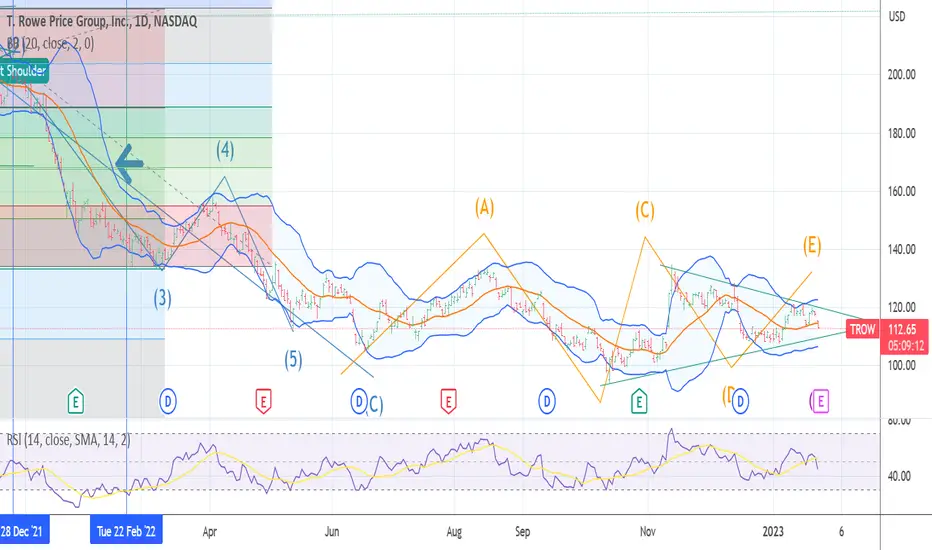
Quick View: $TROW- The daily chart sees a bullish crossover with a consolidation area. A Break above with a new relative high will lead the price higher

TROW overreaction selloff: time to buyI believe that NASDAQ:TROW screams oversold, as real estate is by far not he most affected sector from tariffs and potential trade wars, which can even not happen at all. Current price levels look like a good entry.
Short-term we can see further downside.
Mid-term return to $100-$105.
Long-term - perfect real estate bet, that will easily go to 200 as printer is restarted.

T. Rowe Price Analysis 9/10Disclosure: As of 09/10/2024 I am long T. Rowe Price shares ticker NASDAQ:TROW
T. Rowe Price is an investment management company operating in the mutual funds, retirement plans, and investment management business areas.
Management Effectiveness: T. Rowe Price has been around for many years and management has consistently managed to grow assets under management, and provide good returns for the firm as well as their clients.
The company's return on assets is very good, never dropping below 10% even in the financial crisis of 2008. The company has minimal debt, and an excellent balance sheet. With a business like this the concern is valuation, all the fundamentals and the trend of growing assets as workers contribute to retirement plans will continue well into the future.
With a company like this a very long holding period should be expected. As a holding in a retirement, or tax advantaged account T. Rowe Price is very attractive at the right valuations. The idea is to let the earnings compound over a period of decades. Please keep this in mind if you decide to add this company to your portfolio.
Looking at the current valuations the combined earnings and dividend yield is nearly 13%. With stable revenue growth, asset growth, and very little downside in the way of tail risks this business is a buy for me at anything below $110 per share. My personal expected return on this is between 15%-17% annually with a holding period of 20-50 years to allow the returns to compound internally with the business.

TROWTo me TROW is undervalued as I'm looking at the charts.
Price has a good support level around $90 as we can see in December 2018 and again March 2020, once price hit those levels we saw a quick bullish run afterwards. So fastforward to October 2023 and we see that support level being tested again.

TROW Follow the Real MONEY wave e of B ending The chart posted is and has been a chart to which I have felt the real underlying market moves are true!! We are now fast approaching the final move up in wave E to end the B wave that started in SUPER CYCLE decline from My forecast 12/8 2021 the BULL MARKET ENDED from 1974 and maybe 1932 . So what next well the golden ratio spirals and cycles oct 10th to 20th focus on the 10th dec turn on the 24th and march 10/23 turns have been working well or should I say I been trusting my judgement of the cycles . What is a head we are now coming into the May 9th +or - 1 date then then the GRANDDADDY june 10 to the 23 this is the BIG one it is 6.5 to 7 spirals infact the peak sept 1929 and aug 25th 1987 as well as the other 5 all that week.

TROWStock Price has decreased 48.6% to date from all time high. Price level has retraced near consolidation where most transacted price level took place over last 5 years period near $ 109 level.
TROW has strong fundamental with high net margin/ cash flow margin & high ROE/ROIC .
Good dividend yield at this price level , worthwhile to build position to reap the benefit of high DY while waiting for the stock price to rally .

TROW LOOKING FOR THE RETEST AT 94 MIN . RAISE CASH THE CHART below is that of the TROW it has been key to the BIG picture for me and my view over the last 18 months longterm positioning is nearing a good rate of return and pays a great dividend
TROW: Capitulation incomingLooks like fancy titles like Dividend Aristocrats, Kings, Zombies, etc. don't mean much when everything is nosediving off a cliff. Looking for the end of a 5 wave impulse and a buy entry at ~$83 where 200M MA, 2020 bottom, High Volume Node, .618 and .786 fib are located.

$TROW with a Bullish outlook following its earnings #Stocks The PEAD projected a Bullish outlook for $TROW after a Positive Under reaction following its earnings release placing the stock in drift A with an expected accuracy of 25%.

RectanglePrice is above top trendline of the channel.
A lot depends on Mr. Market and how long this rally continues.
No recommendation.
Short interest is over 7% which is bit higher than I expected.
EPS (FWD)
8.44
PE (FWD)
15.39
Div Rate (FWD)
$4.80
Yield (FWD)
3.66%
Short Interest
7.51%
Market Cap
$28.14B
T. Rowe Price Group, Inc. is a publicly owned investment manager. The firm provides its services to individuals, institutional investors, retirement plans, financial intermediaries, and institutions. It launches and manages equity and fixed income mutual funds. The firm invests in the public equity and fixed income markets across the globe. It employs fundamental and quantitative analysis with a bottom-up approach. The firm utilizes in-house and external research to make its investments. It employs socially responsible investing with a focus on environmental, social, and governance issues. It makes investment in late-stage venture capital transactions and usually invests between $3 million and $5 million. The firm was previously known as T. Rowe Group, Inc. and T. Rowe Price Associates, Inc. T. Rowe Price Group, Inc. was founded in 1937 and is based in Baltimore, Maryland, with additional offices in Colorado Springs, Colorado; Owings Mills, Maryland; San Francisco, California; New York, New York; Philadelphia, Pennsylvania; Tampa, Florida; Toronto, Ontario; Hellerup, Denmark; Amsterdam, The Netherlands; Luxembourg, Grand Duchy of Luxembourg; Zurich, Switzerland; Dubai, United Arab Emirates; London, United Kingdom; Sydney, New South Wales; Hong Kong; Tokyo, Japan; Singapore; Frankfurt, Germany, Madrid, Spain, Milan, Italy, Stockholm, Sweden, Melbourne, Australia, and Amsterdam, Netherlands.

Buy $TROW - NRPicks 13 MayT. Rowe Price Group, Inc. is a publicly held investment manager. The firm serves individuals, institutional investors, retirement plans, financial intermediaries and institutions. It launches and manages equity and fixed income mutual funds.
Revenue TTM 7.7B
Net Income TTM 2.9B
EBITDA TTM 3.9B
Net Margin TTM 37.6%
Margin EBITDA TTM 51%
Total Debt/EBITDA TTM 0.08x


TROW DO NOT BE SHORT OR BEARISH Five waves down. the low was wave 5 or B I think after something that has been working for over 40 plus years you would trust it . have a good weekend mmmmm took profits last week in vix and now 50 in all the indexes .

TROW - Up Channel ContinuationWeekly chart for TROW showing price within an ascending parallel channel
Price is currently emerging from an expanding wedge formation
Once finished it will likely just continue through the channel on this timeframe, as indicated by the arrow

T. Rowe Finds Support on the Yearly Base LineJust an observation: T. Rowe (TROW) appears to have found support on the yearly base line (red line) of the Ichimoku Cloud. Which has proven to be a bottom in past years (2020). I believe that price will try to recover to at least the conversion line (blue line) $140s by the close of the year (if not much sooner). This will also bring the price back above the 5-year moving average. Caution though: the yearly oscillators are indeterminate and it is very possible that the price could drop back down and try to test the 10-year moving average ($100) before the close of the year. Does anyone have strong thoughts about TROW?
Not financial advice.

$TROW with a Neutral outlook following its earnings #Stocks The PEAD projected a Neutral outlook for $TROW after a Negative Under reaction following its earnings release placing the stock in drift D with an expected accuracy of 42.86%.

T ROW PRICE WILL RECOVER AT THIS SUPPORT LEVELT. Rowe Price is currently at a very attractive price, historically speaking, after its recent selloff. From its recent high, the stock is down 43%, but the financials are not worrying at all. The dividend yield is approaching 4%, the company's debt levels and margins are within normal bounds. PE ratio is now at around 9.82.
Aside from the financials, it can be seen that the stock is in a healthy price channel going back to the mid-1990s. The red channel being the stricter version which incorporates when bubbles occur and market-wide crashes like 2008 and 2020. However, these are the exceptions over the last 30 years, more often TROW will stay inside the gold channel, the same one it is resting on right now as support. Earnings came out today which showed that it underperformed, but no severely bad news came out. A 2% negative move is the current daily price action.
My forecast is that TROW rebounds from this gold support line in the next year and reaches the gold resistance line sometime in 2023-24, with a peak around $200-$250. I opened a small position today planning to hold onto it for 1-2 years and I will double my position if either 1) the price declines further to the red trendline or 2) if the gold trendline holds for a few months.

TROW DO NOT BE SHORT OR BEARISH I view this as a very strong move to the upside in the near term back to a .382 in an abc rally this should be rather bullish for ALL THE INDEXES .I wanted to post this at 7 am but had to be a doctor for 8 am today

FRACTAL TIME golden ratio .618 1962 2021 war cycle open your eyes and mind and not the tv or youtube the answer starts with all things are connected . all things have a natural law

lovely entry here! loving this risk reward TROW making a higher low bounce off strong support zone, great risk reward entry for longs her imo.
targeting 172.69-186.99-221.38

