UBER completes correction before wave 5A good buying opportunity is coming to Uber. As my analysis shows, we shall have nice entry point within Feb-March this year.
Buy area is $70-64. While 70 is 23.6% fib retracement of wave 3, 64 is the support that shall not be broken to prove the correct count.
SL shall be below $59.
Uber Technologies, Inc.
No trades
What traders are saying

UBER Bearish: Bear-Flag Pressure Toward 67UBER is trading with a clear bearish tone after the post-earnings reaction: revenue beat, but the EPS miss and cautious Q1 2026 guidance shifted the tape back to “sell the rallies.” The narrative is still constructive long-term (autonomous partnerships and AI grocery features), but near-term sentiment is being dominated by margin/investment concerns and the break in structure.
On the chart, the daily trend remains decisively below the MA20/60/120 cluster, and the $78–$80 base has flipped into a Supply zone. As long as price stays capped beneath $78.28 (daily MA20 + breakdown area), the path of least resistance points lower, with $70 acting as a fragile pivot and $67.00 as the next meaningful Demand/support from prior structure.
The trigger that keeps this idea in control is continued weakness under $70 (bear-flag continuation), which exposes deeper downside toward the $56–$60 region (monthly MA60 zone). The alternative is a reclaim: a sustained push back above the $73–$76 band improves odds of a gap-fill attempt toward $83–$86, but that would be counter-trend until the market proves it can hold reclaimed levels

100 soon?Its sitting close to its support price. Most likely it should test its all-time highs in next 3 months. All the best!!

UBER Great Returns Ahead!!!Uber has been trading within a clearly defined rising wedge. If price manages to hold above wedge support, we expect it to resume trending higher toward the upper resistance zone marked in blue. This move would likely represent the final impulsive leg (Wave 5) of the current structure, as shown on the chart.
On the daily timeframe, Uber is currently sitting right on the Point of Control (POC) of the VRVP. With the right confirmation, this area could act as strong support and trigger a bounce, offering attractive risk-to-reward and strong upside potential.
If you enjoyed this read and it helped with your trades please follow us for more and boost to support the idea!!!

UBER Pre-Earnings Analysis: Quant-Backed Bull Call SpreadUBER QuantSignals V4 Earning 2026-02-03
Bias: Bullish
Event: Earnings (binary, high risk)
Implied Move: ±$5.7 (~7.4%)
IV Rank: 32% (low → limited IV crush)
Trade Idea:
Bull Call Spread: Buy $77 Call / Sell $80 Call
Expiry: Feb 7, 2026
Cost: ~$1.40
Max Profit: ~$1.60
Max Loss: ~$1.40
What needs to happen:
Stock opens above ~$78.4 to profit
Best outcome is a gap toward $80–83
Risk:
Miss or weak reaction → full premium loss
Exit quickly after earnings; don’t hold hoping
Defined-risk bullish bet on an earnings pop in a low-IV setup.


UBER ORDERS FEB 2025UBER (1D) remains in a sell-side structure after failing to reclaim the 84.6 pivot. That level is acting as overhead supply/distribution, and price acceptance below it keeps downside pressure active. The current base around 74–75 looks like absorption (buyers defending the lows), but it’s still a countertrend hold until 84.6 is reclaimed and held.
Key zones:
Resistance / supply: 84.6 (major), then 98.3 (next expansion level).
Support / demand: 74–75 first line, then 70.0 (breakdown trigger), with 63.9 as the deeper magnet/next support.
Targets:
Target up: 84.6 → 98.3
Target down: 70.0 → 63.9
Execution read:
Bull case: hold 74–75, reclaim 84.6, then run toward 98.3.
Bear case: lose 74–75, accelerate into 70; below 70 opens 63.9.

UBER 4H UBER, On the 4 hour chart looking in we can see a potential multiple bottom setting up this is an excellent place for uber to catch a bid.

UBER Holding Trendline Support – Bullish Rebound SetupUber is respecting a long-term ascending trendline and has recently bounced from this key support area. RSI is also recovering from lower levels, indicating improving momentum. As long as price stays above the trendline, bullish bias remains valid; a clean break below it would invalidate this setup.

$UBER isn't cheap!- NYSE:UBER shouldn't trade more than $65 until they start improving EPS
- Fundamentally,
Year | 2026 | 2027 | 2028
EPS | 3.49 | 4.46 | 5.32
EPS% | -34.92% | 27.77% | 19.35%
2026 : we are getting big reduction in EPS yoy and next year it's increasing by 27% and then moderating to high teens.
Price target ( base case 20x multiple) should be:
Year | 2026 | 2027 | 2028
Price | $68 | $88.9 | $106
Conservative Case ( 15x multiple )
Year | 2026 | 2027 | 2028
Price | $52 | $66 | $79
Bear Case ( 10x multiple )
Year | 2026 | 2027 | 2028
Price | $34 | $44.6 | $53.3

UBER 4H TECHNICAL ANALYSIS So here we have the 4h chart and as you can see uber seems to be forming a reversal bottom. I'm targeting the cherry at or above previous highs. Questions and comments are welcome, i do reply with generosity and kindness'

UBER- Uber Technologies, Inc. touched the bullish trend line
- Support aligned with trend line and Fibonacci levels
- I'm looking at $117 to $128 price soon

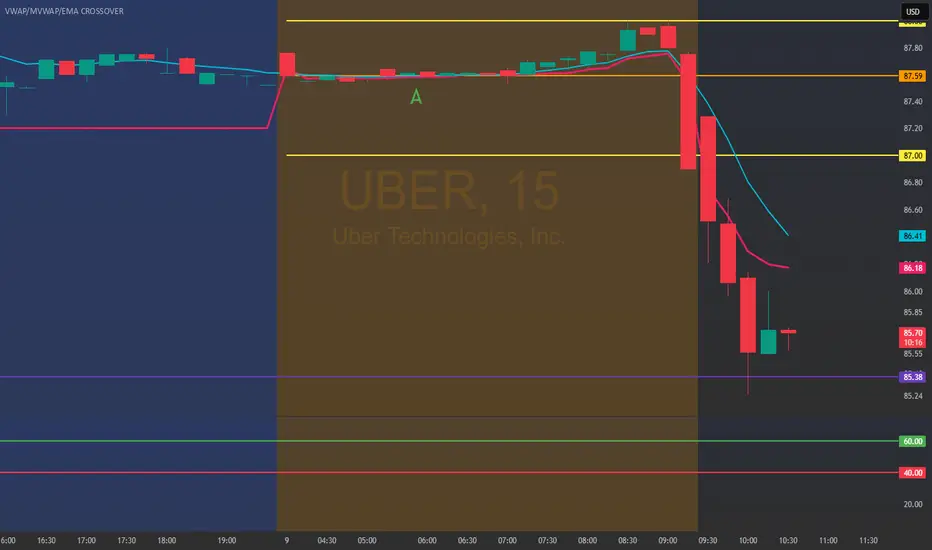
Hello Trader, part #2 UBER: 85.85 result. As we mentioned #1www.tradingview.com
the bullish entry point was above 89.00 with a possible profit target of 92.50.
The bearish entry point was below 87.00 with a reversal point quite far away, but the stock went to reach it. This was today's result; I hope you took advantage of it.
Uber’s "Hybrid" Pivot: Why Robotaxi Threat is Now an OpportunityTime Horizon: Long-term, Bias: Bullish (Long)
The "Big Picture" (Summary) For years, the biggest fear for Uber investors was that autonomous vehicles (like Tesla or Waymo) would make the company obsolete. However, the newly confirmed partnership with Lucid and Nuro changes the story completely. Instead of being a victim of the robotaxi revolution, Uber is effectively "hedging" its future by securing its own fleet of 20,000 autonomous Lucid vehicles. This pivot transforms Uber from a simple marketplace into a resilient "Hybrid Network," making the current share price a compelling value for long-term holders.
The Analysis:
The Trend Uber is currently trading in a consolidation phase (moving sideways) in the low $80s after dropping about 20% from its 52-week highs. While the stock has been stuck due to fears about the future of driving, the actual business is accelerating—total trips grew 22% last year, faster than in previous quarters. The trend remains upward in the long term, but the stock is currently taking a breather.
Key Price Areas:
"Cheap" (Support): $75 – $80. This area has established itself as a "floor" where buyers step in. The recent news of on-road testing starting in San Francisco has reinforced this support level.
"Expensive" (Resistance): ~$102. This is the previous high. If the price breaks above this, it signals that the market has fully accepted Uber's new strategy.
The Catalyst The game-changer is the CES 2026 announcement of the Uber-Lucid-Nuro alliance. This isn't just a promise; Uber has invested $300 million and committed to deploying 20,000 vehicles. This proves Uber has a "Plan B" if other partners (like Waymo) try to squeeze them out. It removes the "existential risk" that has been holding the stock price down.
Investment Plan:
Buy Zone: $78.00 – $82.00 - Accumulating shares in this range allows you to enter while the market is still skeptical, offering a favorable entry point before the broader market reprices the stock.
Risk Level (Invalidation): Close below $65.00 - If the price drops below $65, our thesis is likely wrong. This would suggest the "Bear Case" is unfolding—where autonomous tech fails to scale or competitors like Tesla successfully cut Uber out of the market.
Target: $112.00 - We are targeting a move to $112, which represents roughly 37% upside from current levels. This valuation reflects Uber's successful shift to a "Hybrid Network" and its continued dominance as a "Super App."
Disclaimer: This content is for educational purposes only and does not constitute financial advice. All investments carry risk. Please do your own due diligence before making any investment decisions.

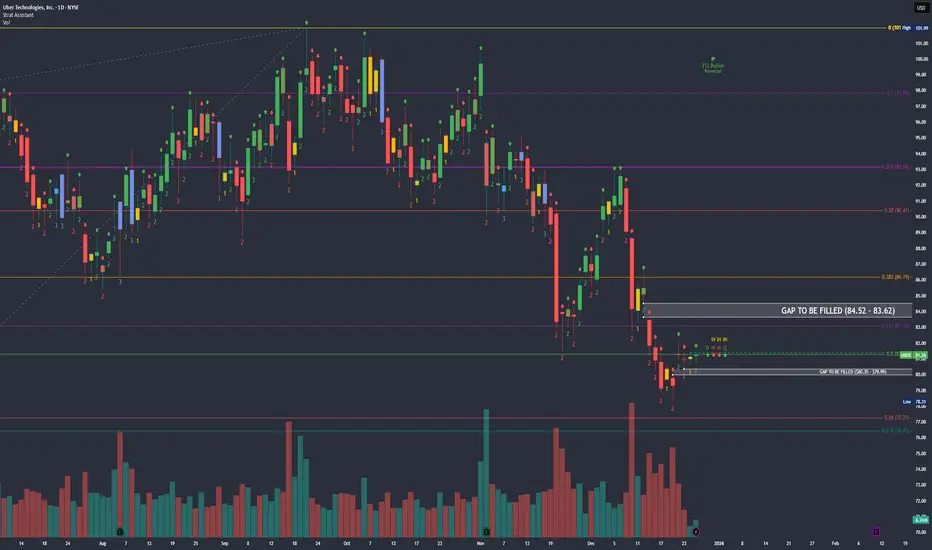
$UBER Daily: 2u Continuation Above $81.50 Resistance Break📊 POSITION: $85c 03/20/26 @ $4.28 | Current Stock Price: $81.26
🎯 PT: $8.56 (+100%) | SL: Below $80.68
━━━━━━━━━━━━━━━━━━━━━━━━━━━━━━━━━━━━
📈 MULTI-TIMEFRAME STRUCTURE
WEEKLY: 3-2d-1 Inside Week (Consolidation)
- Bullish trigger: Break above $82.25
- Bearish invalidation: Close below $80.35 → Target $78.30
- Status: Coiling for directional move
2-DAY: 3-1-2u Pattern
- 2u continuation setup above $81.50
- Watching for confirmation candle
DAILY: 2d-1-2u Structure (CHART SHOWN)
- Key resistance: $81.50 (Previous Day High) - breakout = continuation
- Critical support: $81.09 (previous day midpoint)
- Below $81.09 on multiple timeframes → Bearish to $80.68 (Previous Day Low)
- Further downside: $80.50 → $80.00
- Upside gap-fill target: $83.62-$84.52
━━━━━━━━━━━━━━━━━━━━━━━━━━━━━━━━━━━━
🎯 FIBONACCI ANALYSIS
Long-Term Fib (ATL → ATH):
- Swing: $13.71 (03/18/20) → $101.99 (09/22/25)
- Current zone: 0.214-0.28 retracement ($77.27-$83.10)
- Holding bullish all-time Fibonacci support
Recent Swing Fib:
- Swing: $60.63 (04/07/25) → $101.99 (ATH)
- Current: 0.5-0.618 golden pocket ($76.43-$81.31)
- Price finding support at key retracement zone
━━━━━━━━━━━━━━━━━━━━━━━━━━━━━━━━━━━━
📍 KEY LEVELS
Resistance:
$81.50 (PDH - breakout trigger)
$82.25 (weekly bullish confirmation)
$83.62-$84.52 (gap fill zone)
Support:
$81.09 (daily midpoint)
$80.68 (PDL - stop-loss level)
$80.00 (psychological support)
━━━━━━━━━━━━━━━━━━━━━━━━━━━━━━━━━━━━
💡 TRADE THESIS
Price consolidating at confluence of multiple Fibonacci support zones while forming a 1-2u-2u continuation pattern. Clean risk/reward with defined invalidation below $80.68. Break above $81.50 triggers 2u continuation toward gap fill at $83-84.
Entry rationale:
✓ Multi-timeframe alignment (Weekly inside bar, 2D/Daily 2u setup)
✓ Golden pocket Fibonacci support (0.5-0.618)
✓ Long-term Fibonacci support holding
✓ Clear upside gap to fill
✓ Defined risk below $80.68
━━━━━━━━━━━━━━━━━━━━━━━━━━━━━━━━━━━━
⚠️ RISK MANAGEMENT
- Contract: 81 DTE (03/20/26 expiry)
- Stop-loss: Price close below $80.68
- Profit targets: Breakeven at +25% of contract price, trailing half at +50%, exit at +100%
- Position size: Appropriate for 81 DTE timeframe
*Not financial advice.
*Trade at your own risk.
Hello UBER trader: 80.55www.tradingview.com
This is part #2. This was the result: we set the entry point below 81.00 with a possible exit at 79.00 (reversal price).
The bullish entry point is above 83.00 with a possible exit in the 86.00 area.
I hope you took the trade.
The other trades we set up for META and AMD are still in progress, as the market is going through a difficult, very choppy period.
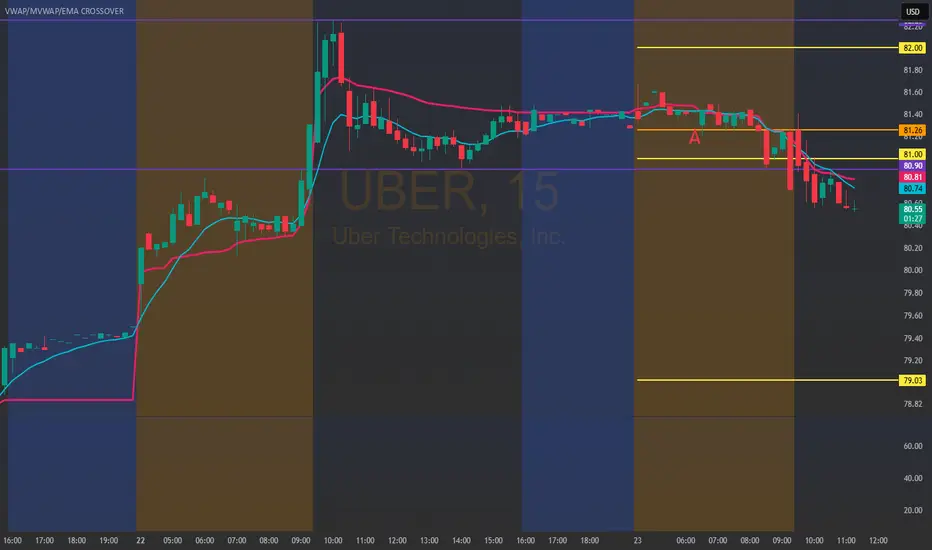
Hello UBER trader: 81.26www.tradingview.com
Below are the marked prices or lines; this is just to give you a better understanding of the price levels.
The stock's opening price is around the closing price and its technical price (81.00)
Bullish entry at 83.00/ up to 86.00 (possibly).
The 82.00 price only represents a possible rebound for the stock.
Bearish entry below 81.00 until the possible reversal at 79.00.

Lets go UBERI´m looking at a bullish RSI divernece, while volume has been decreasing as the stock goes down. I thinkg the 100day EMA will be met soon

1W technical analysis I'm anticipating a bounce to possibly gap fill on the daily chart due to oversold weekly conditions. But ultimately as outlined on the chart i see where the big cats want to eat. And as always time will tell us more

UBER shortSupply Zone had been confirmed
Looks like ABC Pattern.
Stop 93,
Short entry 91
Target 82, 75
Risk management is much more important than a good entry point.
I am not a PRO trader.
In my trading plan, the Max Risk of each short term trade should be less than 1% of an account.

1D technical analysis So looking at the 1D chart for UBER we have a unconfirmed bullish setup in a three bar gap down, Trading in a tight inside day, I have a short term target at the gap fill.

UBER Pressured by FTC Lawsuit as Uptrend Faces Key TestUber Technologies (NYSE: UBER) is facing renewed regulatory pressure after the Federal Trade Commission, joined by 21 U.S. states and the District of Columbia, filed an amended lawsuit accusing the company of deceptive billing and cancellation practices tied to its Uber One subscription service. The complaint alleges that some users were charged without proper consent, failed to receive promised savings, and encountered difficulties canceling their subscriptions.
While the lawsuit adds headline risk, it does not fundamentally alter Uber’s long-term growth narrative. Uber One has been a key pillar in driving user retention, higher trip frequency, and improved unit economics across mobility and delivery. However, increased regulatory scrutiny could lead to fines, operational changes, or tighter oversight around subscription disclosures — all of which may weigh on near-term sentiment.
From a broader fundamental perspective, Uber continues to benefit from strong demand across ride-hailing, delivery, and advertising. The company has also been positioning itself for the future of mobility through partnerships in autonomous vehicles, even as regulatory developments create intermittent volatility. Historically, similar legal challenges have produced short-term pressure rather than lasting damage to Uber’s business model.
Technically, UBER remains in a well-defined long-term uptrend despite the recent pullback. Price has retraced from the $100–$102 resistance zone and is currently consolidating above the rising trendline that has guided price higher since 2023. This area, near the low-to-mid $80s, represents a key technical support region.
A successful defense of this trendline could set the stage for a rebound and another attempt toward the $100 psychological level. Conversely, a decisive break below trend support would expose deeper downside toward the $65–$70 demand zone, which previously acted as a major accumulation area.
Overall, Uber’s fundamentals remain intact, but regulatory headlines are likely to continue driving short-term volatility as the stock tests critical technical levels.
