Trade ideas

Axis bank ascending triangle in 4 hour chartAxis bank ascending triangle in 4 hpur chart final level for downside is 402 if main tained then 560+

BREAK OUT HAPPENED IF SUSTAINS ABOVE REDLINE GO LONGBREAK OUT HAPPENED IF SUSTAINS ABOVE REDLINE CLOSE @ RESPECTIVE TARGET


Bullish after 477.Axis bank is ready for swing trading with an ascending wedge with breakout at 477.


AXISBANK448-449 levels seems to be reversal levels, if sustains it ll see 456 462 and maybe 468
******************************************************************************************************************************************************************
Hi all,
Its pleasure to have you all here.
I have started putting these charts as a contribution from my side to all people who are new to business, as I had to struggle a lot without any sources at disposal. So please consider this a just small contribution from my side.
Few Honest Disclosures:
1. Any idea shared is my personal view, its not a recommendation, neither any kind of paid propaganda, so please
do your bit of research.
2. Ideas shared does not mean that I trade all or have position in them, this is just a helping hand to all.
3. I expect no comments or like nor any negativity, as I said its just a small helping hand from my side, please plan your risk and trade as per your capacity.
4. To trade in Cash, options or futures is your sole choice and your own risk
5. I am no expert in Tech Indicators, I believe in support resistance and trendline theory, you may use this as a supplement theory for better results.
6. I work for my own living, this is a hobby which I do sincerely to help anyone who might come across my charts.
***********************************************************************************************************************************************


inverted Head & sholder bullish pattern on AXIS BANK inverted Head & sholder bullish pattern on AXIS BANK wait for bullish entry signal


AXIS BANK 30mnBEARISH Shark@1.13XA as PRZ ..Clearly when considered Shark@1.0XA as prz hit both Targets
BLACK HORIZONTAL LINE is WEEKLY RESISTANCE Pattern completed at this level so strong zone
Horizontal BLACK DOTTED lines r High & Low of ULTRA HIGH Volume CANDLE .Vertical dotted line is ULTRA HIGH VOLUME i.e SMART MONEY
ULTRA HIGH VOLUME for going SHORT we need LOW VOLUMES in the area of ULTRA HIGH VOLUME BAR. as High volume shows interest to the upside from “Smart Money” so prices may go higher.
SET UP BECOMES VALID ONLY when RSI is below 70 and IF Price breaks ULTRA HIGH VOLUME Candle LOW with LOW VOLUMES & with NO DEMAND l.e place for short
POTENTIAL SELL

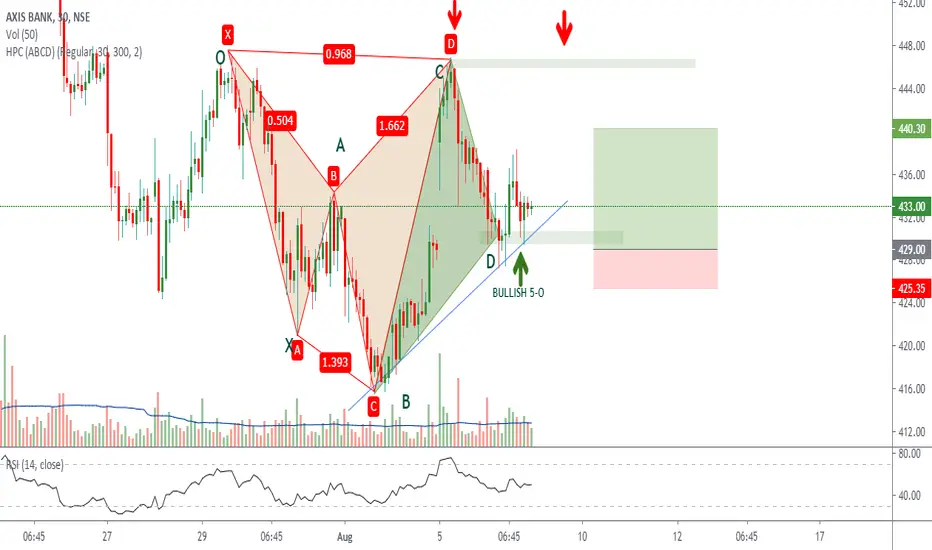
AXIS BANK 30MNBULLISH 5-O
Clearly on Type 1 Entry i.e on 1st green Arrow Bullish 5-O Pattern hit Target 1, as now price again came into zone its TYPE 2 Entry
Low volumes so professionals not interested to Downside .. RSI above 30
POTENTIAL BUY


AXISBANKNSE:AXISBANK
It has broken its downside support, now below 415 if it sustains get ready for 402 and 390.
******************************************************************************************************************************************************************
Hi all,
Its pleasure to have you all here.
I have started putting these charts as a contribution from my side to all people who are new to business, as I had to struggle a lot without any sources at disposal. So please consider this a just small contribution from my side.
Few Honest Disclosures:
1. Any idea shared is my personal view, its not a recommendation, neither any kind of paid propaganda, so please
do your bit of research.
2. Ideas shared does not mean that I trade all or have position in them, this is just a helping hand to all.
3. I expect no comments or like nor any negativity, as I said its just a small helping hand from my side, please plan your risk and trade as per your capacity.
4. To trade in Cash, options or futures is your sole choice and your own risk
5. I am no expert in Tech Indicators, I believe in support resistance and trendline theory, you may use this as a supplement theory for better results.
6. I work for my own living, this is a hobby which I do sincerely to help anyone who might come across my charts.
***********************************************************************************************************************************************


AXIS BANK 30MNBULLISH BAT
Price need to follow Green Trend line & hit target
If price Breaks Red Trend line is where EXIT before SL hits
POTENTIAL BUY

AXISBANK.....Long above 435AXIS Bank forming cypher pattern....confirmation is awaited....
Once this stock will move above 435...it will enter in channels (accumulation) and will move towards 460 zone....
Lets see how stock behave within these 2-3 days
But long above 435 only....
