Short XOM because at heavy resistance and looks overextendedShorting XOM since it touched the upper trend line, which serves as resistance. The chart also looks heavily overextended and is in for a pullback to at least 104-106.
Trade ideas

XOM Regression- zone pulls back to this zone as a buy current position I am short to the 105 level. From there I will be long.

Elliott Wave View:Exxon Mobil (XOM) Looking to End 5 Waves RallyShort Term Elliott Wave structure of Exxon Mobil (ticker: XOM) suggests cycle from 9.26.2022 low is unfolding as a 5 waves impulse Elliott Wave structure. Up from 9.26.2022 low, wave 1 ended at 89.36 and pullback in wave 2 ended at 87.13. The stock then extends higher in wave 3 towards 103.32 and pullback in wave 4 ended at 96.75.
Wave 5 is now in progress with subdivision as an impulse in lesser degree. Up from wave 4, wave ((i)) ended at 99.76 and dips in wave ((ii)) ended at 97.06. Stock then extended higher in wave ((iii)) towards 111.21 as the 45 minutes chart below shows. Stock then pullback in wave ((iv)) towards 108.12. Near term, expect wave ((v)) of 5 to complete soon with a marginal high. This should also complete wave (1) and end cycle from 9.26.2022 low. Stock should then pullback in wave (2) to correct cycle from 9.26.2022 low before the rally resumes. Wave (2) dips should unfold in the sequence of 3 ,7, or 11 swing before the rally resumes. Near term, while above 108.12, expect the stock to extend marginally to end wave ((v)) of 5 of (1).

$XOM swing puts - Indicators show higher probability of sellingSimple chart here that makes a likely case for a downward directional trade. There are 4 simple moving averages - 10, 20, 50, 200. Yellow arrow mark major tops which also line up with RSI over 70 (orange circles) and directional movement (DMI) peaks.
Directional movement is a less popular volume indicator, but it has saved me many times on a 5m chart from entering a trade at the wrong time. The green line (DI+) indicates buying and red line (DI-) indicates selling. The gray line shows total directional movement for a 7-period setting. This is the important one, as it indicates when movement in one direction (in this case buying) has become extreme so buyers will be exhausted and then selling ensues.
Based on this I suggest 11/4 or 11/18 puts.

XOM Exxon Mobil | Joe Biden: 'Exxon Made More Money Than God'Want to play the earnings of the company that makes more money than God himself? :)
If you haven`t bought my last call, at $75:
than you should know that before he see this Double Top Bearish chart pattern fulfill, there is still some upside left for XOM.
Looking at the XOM Exxon Mobil options chain, i would buy the $110 strike price Calls with
2022-12-16 expiration date for about
$4.00 premium.
Looking forward to read your opinion about it.

Exxon hits all time highThis chart shows that recently XOM reached an all time high price in what could be a breakout from a very long term channel. However, I think it would be prudent to wait for confirmation that this is not a false breakout. The chart of oil is currently in a down trend.
Will $XOM pullback after earnings on 10/28?Yellow vertical lines mark earnings days.
Gray boxes show price action afterwards - given the stock's run up since end of Sept, and seeing RSI and stochastic with price at all time highs - I like the reward/risk of buying 11/4 or 11/18 puts.
Today the top 10 November volumes are in call strikes and one 11/18 97.50 put. I cannot say if they are being bought or sold.
Of note, the 11/4 110C has 3,700 OI with 2500 volume today.
For the 10/28 expiry, the 110C has 10k volume today with 6.7k OI. Call volumes greatly exceed put volumes and today's P/C ratio is 0.52 (P/C ratio OI = 0.82).
My own trade design is a counter-trend idea. I rarely trade through earnings but in this case I like the technical-based idea and can hold a few days at least.


Energy Going UpExxon looks to break through resistance and continue onto new all time highs. Oil has been on a down trend and the chart looks horrible, but that hasn't affected oil stonks in the slightest. Look for much higher here 125 + end of year.

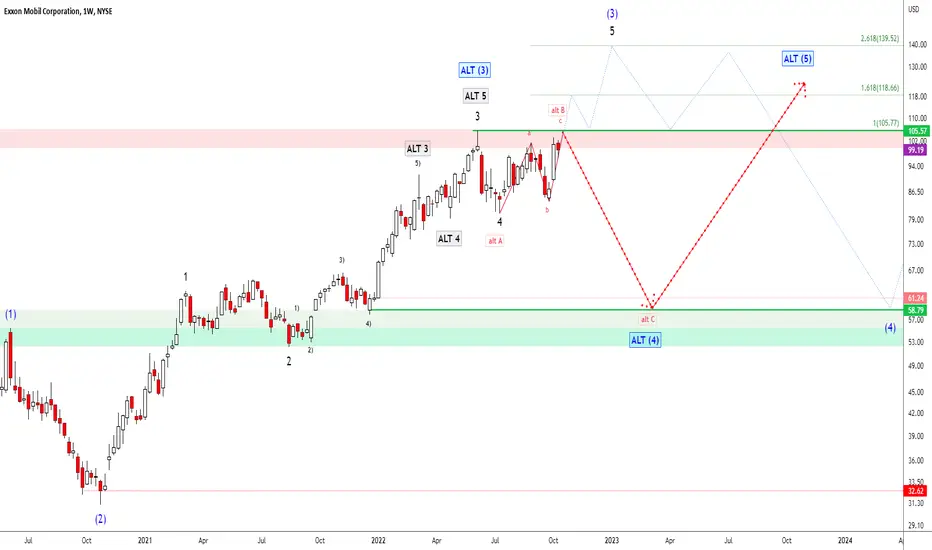
XOMWEEKLY:
Since 2020, Exxon Mobil has started a strong uptrend and currently the trend is at the decision line, so I have outlined 2 variants on the chart: red and blue.
The blue path is suitable provided the @ 105.57 price level is soon broken to the upside which then continues the blue wave from Intermediate (1)-(5) to the end of wave (3).
The red variant comes into play when the alternative count of the black wave 1-5 is already complete at 105.57, which then - once the alt B ends - speaks for the falling ALT (4).
Xom putsStarted trading options this week and its been awesome. Been seeing a lot of my rules apply to the stock market just like it would in forex. Other then news my concepts still hold value. Going to go in on this once tomorrow morning. This has to come down to fill the imbalance in the market from the strong bullish move up. We even gapped up before the big move and that yet has to be filled. My tp is the Order block and the see how price reacts there.
Nice break of structure to the downside I want this to close and hold under for the confirmation for a sell. We also have a nice retracement and rejection from the 61.8 fib lvl so things are looking good so far imo.

Exxon awaiting a correction?Exxon Mobile - 30d expiry - We look to Sell at 102.98 (stop at 107.07)
We are trading at overbought extremes.
Bearish divergence can be seen on the weekly (the chart makes a higher high while the oscillator makes a lower high), often a signal of exhausted bullish momentum, or at least a correction lower.
Posted a Double Top formation on daily RSI.
Price action continues to trade around the all-time highs.
In our opinion this stock is overvalued.
There is scope for mild buying at the open but gains should be limited.
Preferred trade is to sell into rallies.
Early optimism is likely to lead to gains although extended attempts higher are expected to fail.
Our profit targets will be 92.72 and 88.72
Resistance: 103 / 105 / 110
Support: 100 / 97 / 93
Disclaimer – Saxo Bank Group.
Please be reminded – you alone are responsible for your trading – both gains and losses. There is a very high degree of risk involved in trading. The technical analysis , like any and all indicators, strategies, columns, articles and other features accessible on/though this site (including those from Signal Centre) are for informational purposes only and should not be construed as investment advice by you. Such technical analysis are believed to be obtained from sources believed to be reliable, but not warrant their respective completeness or accuracy, or warrant any results from the use of the information. Your use of the technical analysis , as would also your use of any and all mentioned indicators, strategies, columns, articles and all other features, is entirely at your own risk and it is your sole responsibility to evaluate the accuracy, completeness and usefulness (including suitability) of the information. You should assess the risk of any trade with your financial adviser and make your own independent decision(s) regarding any tradable products which may be the subject matter of the technical analysis or any of the said indicators, strategies, columns, articles and all other features.
Please also be reminded that if despite the above, any of the said technical analysis (or any of the said indicators, strategies, columns, articles and other features accessible on/through this site) is found to be advisory or a recommendation; and not merely informational in nature, the same is in any event provided with the intention of being for general circulation and availability only. As such it is not intended to and does not form part of any offer or recommendation directed at you specifically, or have any regard to the investment objectives, financial situation or needs of yourself or any other specific person. Before committing to a trade or investment therefore, please seek advice from a financial or other professional adviser regarding the suitability of the product for you and (where available) read the relevant product offer/description documents, including the risk disclosures. If you do not wish to seek such financial advice, please still exercise your mind and consider carefully whether the product is suitable for you because you alone remain responsible for your trading – both gains and losses.

$XOM Analysis, Key levels, and Targets $XOM Analysis, Key levels, and Targets
So I got a little bit trigger happy today and I sold 95 puts for Friday, but that’s ok… I’m ok with that… However, had I had thought it through I would have used these targets as entries and maybe bumped out to next week… but this is why I make these charts, so that I can make more informed decisions on the spot… and to be able to pick better strikes on the spot… LOL…
Anyway, with OPEC cutting oil production I think 95 is a good entry… and seeing it from this angle is giving me so many ideas on how to play this…. Dang I should have organized my charts weeks agolll haha…
IF you trade $XOM, $SHEL, $CVX or oil in general let me know your thoughts….
I’m going through my entire stock list this week (definitely longer than a week) so sorry in advanced for blowing up your emails…
—-
I am not your financial advisor. Watch my setups first before you jump in… My trade set ups work very well and they are for my personal reference and if you decide to trade them you do so at your own risk. I will gladly answer questions to the best of my knowledge but ultimately the risk is on you. I will update targets as needed.
GL and happy trading.
IF you need anything analyzed Technically just comment with the Ticker and I’ll do it as soon as possible…

XOM ShortRange play. However, if we retest the bottom channel I will re enter the short. I think everything is baked in on oil companies.


10/5/22 XOMExxon Mobil Corporation ( NYSE:XOM )
Sector: Energy Minerals (Integrated Oil )
Market Capitalization: $413.096B
Current Price: $99.12
Breakout price: $100.00
Buy Zone (Top/Bottom Range): $97.60-$87.90
Price Target: $105.00-$106.20 (3rd), $120.10-$121.70 (4th)
Estimated Duration to Target: 26-29d (3rd), 85-91d (4th)
Contract of Interest: $XOM 10/21/22 100c, $XOM 12/16/22 105c, $3.80/contract
Trade price as of publish date: $2.69/contract, $3.80/contract

XOM IS BACK ON $100 WEEKLY RESISTANCE, WHAT'S NEXT?Check out the trade plan for XOM today based on the technical analysis. Hope this analysis is useful, make sure to hit the thumbs and also follow my tradingview profile for future updates. Thank you!
XOM Revisited the $100 weekly resistance formed. On the whole, it's now a triple top formed on the following resistance. At the moment the market has two possibilities with the strong bullish price action that happened recently. We are required to confirm the next possible direction with a breakout or a reversal on the highlighted area.

Short term tentative bullish on Exxon Mobil. XOMBetting on a protracted B Wave. Momentum increasing, zero divergence. Fibtime > 1.0, hence highly likelihood of a flat formation. And thus, more reason to believe a retrace to >0.786 of A. Indicators congruent. Let's see what happens next.
We are not in the business of getting every prediction right, no one ever does and that is not the aim of the game. The Fibonacci targets are highlighted in purple with invalidation in red. Confirmation level, where relevant, is a pink dotted, finite line. Fibonacci goals, it is prudent to suggest, are nothing more than mere fractally evident and therefore statistically likely levels that the market will go to. Having said that, the market will always do what it wants and always has a mind of its own. Therefore, none of this is financial advice, so do your own research and rely only on your own analysis. Trading is a true one man sport. Good luck out there and stay safe.

XOM short on dailyOpened short on XOM daily after bearish hammer at the local high.
Love bullish candles closing below 10MA.

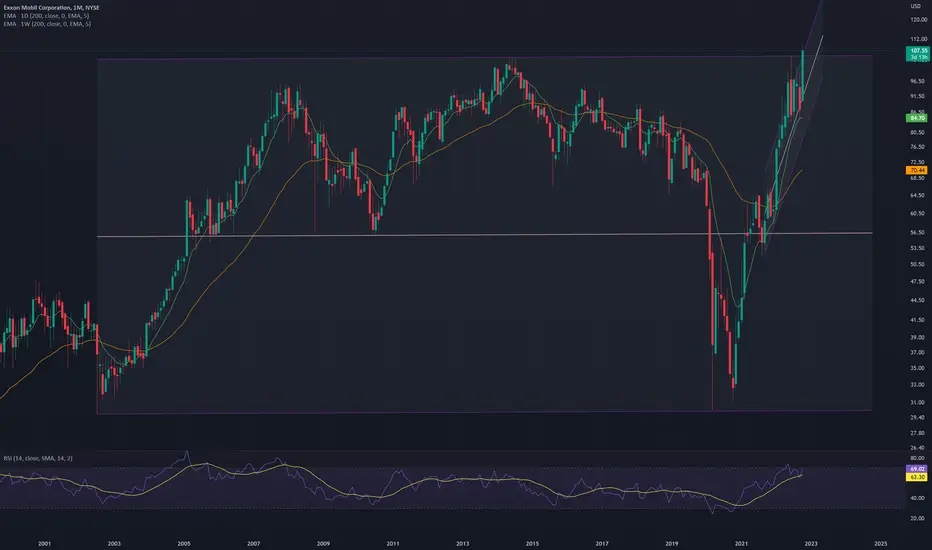
Exxon Mobil Hasn’t Done This All YearExxon Mobil has been drifting since the late spring along with other energy stocks. But now it’s trying to do something it hasn’t done all year.
The main pattern on today’s chart is the 200-day simple moving average (SMA), one of the most basic measures of long-term support. XOM tested that level yesterday for the first time since December, which could draw some investors from the sidelines.
Second is the trendline running along the lows of February and July.
Next, stochastics are turning up after dipping to an oversold condition.
Finally you have the recent price gap between $90.52 and $87.50. Will traders look for XOM to fill that void?
TradeStation has, for decades, advanced the trading industry, providing access to stocks, options, futures and cryptocurrencies. See our Overview for more.
Important Information
TradeStation Securities, Inc., TradeStation Crypto, Inc., and TradeStation Technologies, Inc. are each wholly owned subsidiaries of TradeStation Group, Inc., all operating, and providing products and services, under the TradeStation brand and trademark. You Can Trade, Inc. is also a wholly owned subsidiary of TradeStation Group, Inc., operating under its own brand and trademarks. TradeStation Crypto, Inc. offers to self-directed investors and traders cryptocurrency brokerage services. It is neither licensed with the SEC or the CFTC nor is it a Member of NFA. When applying for, or purchasing, accounts, subscriptions, products, and services, it is important that you know which company you will be dealing with. Please click here for further important information explaining what this means.
This content is for informational and educational purposes only. This is not a recommendation regarding any investment or investment strategy. Any opinions expressed herein are those of the author and do not represent the views or opinions of TradeStation or any of its affiliates.
Investing involves risks. Past performance, whether actual or indicated by historical tests of strategies, is no guarantee of future performance or success. There is a possibility that you may sustain a loss equal to or greater than your entire investment regardless of which asset class you trade (equities, options, futures, or digital assets); therefore, you should not invest or risk money that you cannot afford to lose. Before trading any asset class, first read the relevant risk disclosure statements on the Important Documents page, found here: www.tradestation.com .

XOM - Will The Hurricane Drive Momentum?It is time to put Oil on your radar for two reasons. One thing that is really striking is how the stores are already selling completely out of water this weekend, after visiting 8 stores and coming up empty handed. BUT, how will the country be faced with gasoline shortages as mass panic begins to strike into the human mindsets, fear, and much more. Especially with not knowing the exact placement of the hurricane and the strength of destruction as the country is facing record high inflation and the government is depleting the strategic reserves of our Oil. THEY will need to start buying the Oil off the market at a rapid pace before the price of oil begins to aggressively increase - thus fueling the demand for buying; causing a momentum spike in price action.
The Oil Markets have been looking for a catalyst and this could be just what the market needed to get some demand under it, after-all, recession or not, the U.S. needs Oil to survive and it wont' be long before the U.S. is pressured in admitting the need is critical.
I am linking my home repair and oil charts below for simplicity purposes.
My support/resistance lines are represented with the horizontal lines. You can use those as targets and/or entries for positions based on bounces of those areas or rejections.

XOM longXOM will have stellar earnings on 11/4 and OIL will continue its uptrend until the Russia/Ukraine conflict ends. Definitely worth picking up some oil stocks at discount.
xom looking pretty bearish I'm looking for it to breaking 92 Engulfing line lets see what the meeting brings
