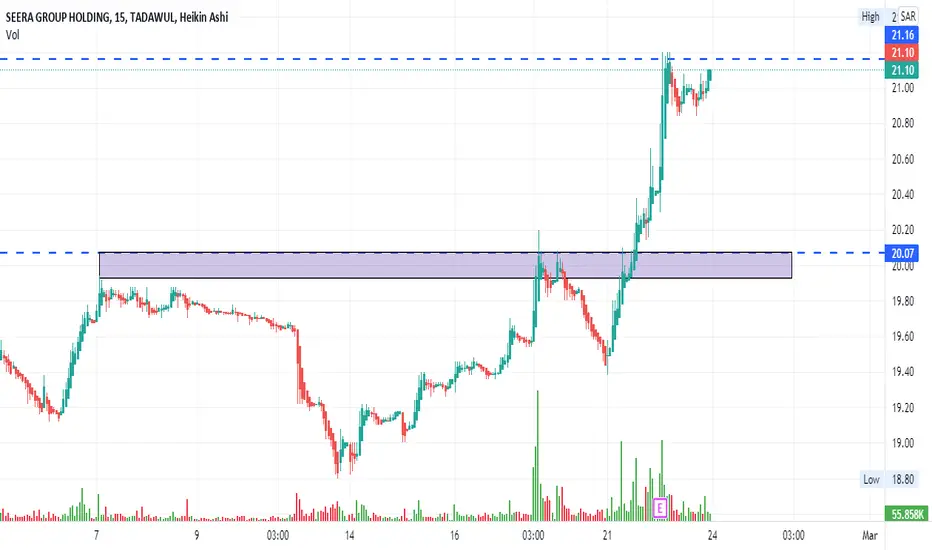
1810 Seera GroupHello traders,
I'm looking for opportunity to re-enter this stock this week.
It's clear it target 26.8
Good Luck for all
Next report date
—
Report period
—
EPS estimate
—
Revenue estimate
—
−0.78 SAR
−198.98 M SAR
4.11 B SAR
241.58 M
About Seera Holding Group
Sector
Industry
CEO
Al-Waleed Abdulaziz Al-Nasser
Website
Headquarters
Taawun
Founded
1979
ISIN
SA132GSGS910
FIGI
BBG0032ZGN69
Seera Holding Group engages in the ownership and operation of travel agencies. It primarily involves in selling tickets for scheduled air travel services, tourism, cargo, transportation, Hajj and Umrah, arranging conference and events, education, chartered flights, furnished suites and hotels, shipping and other travel related products and services. The company operates through the following segments: Ticketing, Tourism, Transportation, Hospitality, and Property Rentals. The Ticketing segment involves in the issuance of tickets of airlines, ferries, and trains. The Tourism segment consists of hotel booking services, package holidays, and room rentals. The Transportation segment includes transportation services, such as car rentals, chartered flights, and delivery of shipments. The Hospitality segment offers rebates and trade discounts. The Property Rental segment provides properties on operating lease. Seera Holding Group was founded by Nasser Aqeel Abdullah Al-Tayyar on April 30, 1979 and is headquartered in Riyadh, Saudi Arabia.
Related stocks

1810 SeeraHello traders,
Seera financial is good and technically it's looks great.
We noticed fast movements in the last few days to different stocks,
It's to me that TASI will moves to 14000 in the 2025.
Good luck for all

TASI-1810: SEERA GROUP HOLDING, 24 NOV 2024I have Bullish Bias for TASI-1810 Seera Group Holding on 24 November 2024.
Current closing price is SAR 23.00. I have bullish bias for this stock.
I suggest Buy Limit order at 22.88 with Stop Loss of 22.10.
TP1=23.64, TP2=24.38, TP3=25.50, TP4=26.75

Seera Holding Group - 1810 - KSA - TADAWULThe stock is attempting to form a positive technical pattern, a double bottom. It has confirmed a breakout above the downward trend line, and a positive quarterly close is anticipated. The stock is currently rebounding from a support level within the medium-term upward trend. The targets are set at

Seera Group holding expected projectionDue to the introduction of new airline and the influx of people related to all mega projects for Vision 2030, I expect a rise in sales of airline tickets

1810alsalam 3alikom
The graph described the dramatically growing and arrive to more than we think this week

SEERA GROUP HOLDINGTADAWUL:1810
It is still down to the designated demand areas and from where it is our point of interest on condition of entry

Seera going through resistancesSeera is bullish and make sure previous tops are your resistance till it reaches its final destination shown in chart

1810 Is going Up Think To Buy 1810 is trending up if you have just hold it to next target if not start thinking buying it

SEERA GROUP HOLDINGSira moves beautifully, and if I look at the top, we can see a very strong rush up.
See all ideas
Summarizing what the indicators are suggesting.
Neutral
SellBuy
Strong sellStrong buy
Strong sellSellNeutralBuyStrong buy
Neutral
SellBuy
Strong sellStrong buy
Strong sellSellNeutralBuyStrong buy
Neutral
SellBuy
Strong sellStrong buy
Strong sellSellNeutralBuyStrong buy
An aggregate view of professional's ratings.
Neutral
SellBuy
Strong sellStrong buy
Strong sellSellNeutralBuyStrong buy
Neutral
SellBuy
Strong sellStrong buy
Strong sellSellNeutralBuyStrong buy
Neutral
SellBuy
Strong sellStrong buy
Strong sellSellNeutralBuyStrong buy
Displays a symbol's price movements over previous years to identify recurring trends.
Frequently Asked Questions
The current price of 1810 is 30.44 SAR — it has decreased by −0.52% in the past 24 hours. Watch Seera Holding Group stock price performance more closely on the chart.
Depending on the exchange, the stock ticker may vary. For instance, on TADAWUL exchange Seera Holding Group stocks are traded under the ticker 1810.
1810 stock has risen by 4.75% compared to the previous week, the month change is a −0.20% fall, over the last year Seera Holding Group has showed a 34.10% increase.
We've gathered analysts' opinions on Seera Holding Group future price: according to them, 1810 price has a max estimate of 35.00 SAR and a min estimate of 24.50 SAR. Watch 1810 chart and read a more detailed Seera Holding Group stock forecast: see what analysts think of Seera Holding Group and suggest that you do with its stocks.
1810 reached its all-time high on Apr 19, 2015 with the price of 81.78 SAR, and its all-time low was 12.12 SAR and was reached on Mar 16, 2020. View more price dynamics on 1810 chart.
See other stocks reaching their highest and lowest prices.
See other stocks reaching their highest and lowest prices.
1810 stock is 3.04% volatile and has beta coefficient of 0.76. Track Seera Holding Group stock price on the chart and check out the list of the most volatile stocks — is Seera Holding Group there?
Today Seera Holding Group has the market capitalization of 9.13 B, it has increased by 2.75% over the last week.
Yes, you can track Seera Holding Group financials in yearly and quarterly reports right on TradingView.
Seera Holding Group is going to release the next earnings report on Mar 31, 2026. Keep track of upcoming events with our Earnings Calendar.
1810 net income for the last quarter is 50.00 M SAR, while the quarter before that showed 3.07 M SAR of net income which accounts for 1.53 K% change. Track more Seera Holding Group financial stats to get the full picture.
No, 1810 doesn't pay any dividends to its shareholders. But don't worry, we've prepared a list of high-dividend stocks for you.
Like other stocks, 1810 shares are traded on stock exchanges, e.g. Nasdaq, Nyse, Euronext, and the easiest way to buy them is through an online stock broker. To do this, you need to open an account and follow a broker's procedures, then start trading. You can trade Seera Holding Group stock right from TradingView charts — choose your broker and connect to your account.
Investing in stocks requires a comprehensive research: you should carefully study all the available data, e.g. company's financials, related news, and its technical analysis. So Seera Holding Group technincal analysis shows the buy rating today, and its 1 week rating is buy. Since market conditions are prone to changes, it's worth looking a bit further into the future — according to the 1 month rating Seera Holding Group stock shows the buy signal. See more of Seera Holding Group technicals for a more comprehensive analysis.
If you're still not sure, try looking for inspiration in our curated watchlists.
If you're still not sure, try looking for inspiration in our curated watchlists.