Saudi Aramco Base Oil Co. (2223 – Tadawul)Here’s a **Buy Plan** based on your weekly chart for **Saudi Aramco Base Oil Co. (2223 – Tadawul)**:
---
## 🟢 **Buy Plan: Aramco Base Oil (2223) – Weekly Chart**
### 📊 **Current Market Context:**
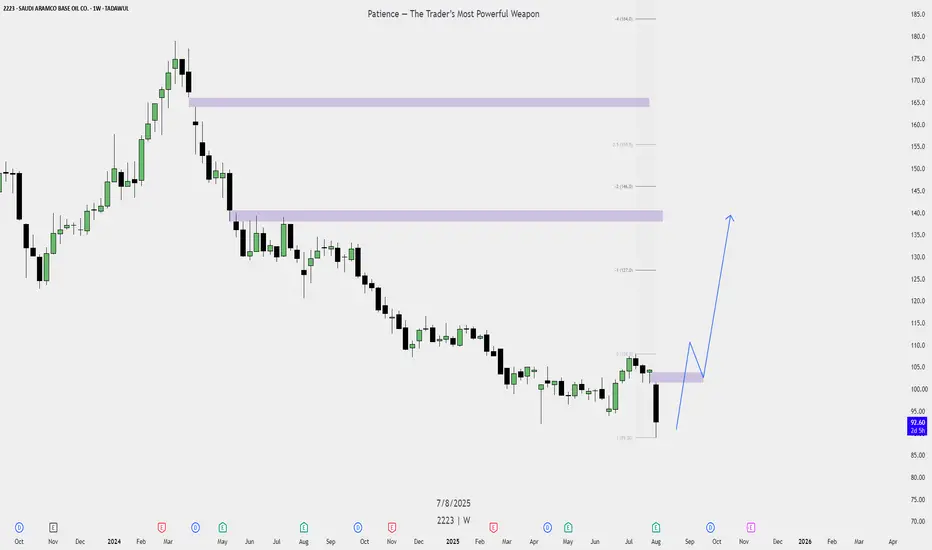
* **Current Price:** 92.55 SAR
* **Recent Swing Low:** 89.00 SAR
* **Fair Value Gap (Support Zone):** 100 – 105 SAR (Approximate)
* **Major Resistance Zones:**
* **Zone 1:** 145 – 150 SAR
* **Zone 2:** 165 – 170 SAR
---
### 📝 **Entry Plan:**
* **Entry Zone:** Wait for price to reclaim **100–105 SAR** (the lower Fair Value Gap zone).
* Entry Trigger: Strong bullish candle close inside or above this FVG zone on the **Weekly timeframe**.
---
### 🎯 **Target Zones:**
1. **Target 1:** 127 SAR (First Fib level; short-term target)
2. **Target 2:** 146 SAR (Previous major resistance zone)
3. **Target 3:** 165 SAR (Higher timeframe FVG + Fib zone)
---
### 🛡️ **Stop Loss:**
* **Below 89.00 SAR** (recent swing low)
* Conservative Stop Loss: 88.50 SAR
* Risk: Reward Ratio = Minimum 1:2
---
### 📌 **Trade Conditions:**
* Price must close above **100–105 SAR zone** with volume confirmation.
* **No entry** if price stays below 100 SAR or forms weak candles.
* Add position only after a **weekly candle closes bullish** in the FVG zone.
---
### 🧠 **Strategy Reminder:**
* **Patience is key** – avoid early entries.
* Wait for **higher timeframe confirmation** before executing.
* Monitor for **lower timeframe bullish structure** after weekly reclaim.
---
Let me know if you'd like this as a **PDF or image** for sharing or record-keeping.
2223 trade ideas
Saudi Aramco Base Oil Co. (Luberef - 2223) on the Daily timefram🔻 Sell Plan Summary
🔴 Key Supply Zones:
Monthly Fair Value Gap (FVG) / Premium Supply Zone — (Red Box around 108–110 SAR)
Labeled as “M fvg T2,4” on your chart.
Price previously reversed from this zone, indicating strong selling pressure.
Daily Bearish FVG / Rejection Zone — (Red Zone around 104.5 SAR)
Price is reacting to this short-term supply area.
It hasn't closed above this zone, showing weak bullish momentum.
🔵 Target Zone:
Daily Bullish Fair Value Gap (FVG) — (Blue Box: 96.5–98.5 SAR)
This is your likely downside target, situated in the discount zone.
A strong demand area where price may find support.
📉 Market Structure:
Price formed a lower high, suggesting bearish structure.
Recent candles show rejections from supply, supporting a short bias.
The chart includes a red arrow showing expected downward movement.


ARAMCO is BullishPrice is in a strong downtrend printing lower lows and lower highs continuously. However, the eight month long trendline seems to be breaking. Moreover, accumulation at current levels is also an indication that bulls are trying to assume control of the price action. If previous lower high is broken with good volume then we can expect a bullish reversal as per Dow theory. Targets are mentioned on the chart.


SAUDI ARAMCO BASE OIL - Daily Chart (TADAWUL)SAUDI ARAMCO BASE OIL - Daily Chart (TADAWUL)
"After a long bearish phase, the market finally pauses to breathe. If the next bullish leg confirms, it will unlock the roadmap to higher targets. With strong conviction, I believe the 2025 low is already in place. Eyes on 107.4 first, then 111.8. Let price reveal the story.

SAUDI ARAMCO is BullishPrice was in a strong downtrend, however it seems that bears are exhausted and price is ready for a take-off from here. Bullish RSI divergence has emerged on both daily and weekly time frame, hinting the control of bulls. If previous lower high is broken successfully, then we can expect a bullish reversal as per Dow theory. Targets are mentioned on the chart.

2223an upward trend in the prices of an industry's stocks or the overall rise in broad market indices, characterized by high investor confidence

SAUDI ARAMCO BASE OIL CO. DAILY ANALYSIS After retest consequent encroachment of the wick we will see an expansion to fill gap of down trend

SAUDI ARAMCO BASE OIL CO. WEEKLY ANALYSIS After taken liquidity sell side and rejection of fvg we will see an expansian to fill gap

SAUDI ARAMCO BASE OIL CO. WEEKLY ANALYSIS
After rejection price of volume imbalance two time we will see an expansion to taken previous sell side and fill previous FVG

2223Great opportunity again to take a position in the company, targets are the red lines and the stoploss is 128.
Dr SAUD

2223 | Saudi Aramco Base Oil CompanySaudi Aramco Base Oil Company is trading within a potential broadening wedge formation, with both the lower and upper ascending trendlines supporting the price. The immediate support zone represents an optimal buying area before the price advances towards the targeted 180 level. Short term approach can be consider initially around 152-153 and secondary approach around 165. The internal demand zone is identified around 143 as a favorable accumulation point. On the flip side, if the trend line breaks then more bearish momentum can be seen. Use stop loss below 140 to manage risk.

2223 Certainly! Aramco Base Oil Co🛢️mmxm fallowing i am waiting below sell side liqudity then afeter change of status dlivry i will enter till buy saide liqudity.

Strong Resistance is around 158 - 159This Weekly Support (around 152 - 153) should
be honored for Upside
If 159 is Crossed & Sustained, we may witness
179 and then 200

Saudi Aramco 2223As it's showing a stock in an uptrend, the stock enters a correction phase but rebounds to Fibonacci levels. However, it's worth noting that the volume is not supportive, unlike what we observe with other indicators, especially MACD, which will give a buy signal if the next candle confirms with a green. Similarly, in Bollinger Bands, touching its support level, just like the last time, the volume did not support, then it will be an uptrend. However, we are also observing that the trend is showing signs of weakness; if volumes increase, then we will consider it.
As we are already in a position, for safety, we are keeping our stop-loss at 167.84 AED.
Conclusion: All signs support an uptrend; the bullish trend is stronger, but we must primarily consider volume and other indicators and run with a stop-loss for safety.


ARAMCO oil base 2223we think long on this stock .. with time and price estimation
the break of this trend .. we heading to 147

2223 Saudi AramcoThe company is ready to go for 135 from this level then next target will be updated on the chart.

SAUDI ARAMCO is BullishSAUDI ARAMCO just posted a new all time high couple of days ago, and is on track for new highs, as the bullish momentum looks good. Moreover, no divergence has yet appeared on the RSI and hence according to Dow theory, the trend of higher highs and higher lows is likely to continue. Projections from AB = CD harmonic pattern are also marked on the chart, alongside entry points and take profit targets.

Potential Breakout: Saudi Aramco Base Oil Company - Luberef (222Saudi Aramco Base Oil Company - Luberef (2223) is making waves in the market! Trading near its all-time high and above all key moving averages, it’s showing strong signs of an upward trend. High volume activity indicates robust investor interest.
The company has shown rapid earnings growth, up 51% a year for the past five years, indicating a strong future performance. With a first target of 166.8 and a second target of 184.8, it’s a stock to watch! Remember, always do your own analysis before investing.

SAUDI ARAMCO is BullishARAMCO after successfully retesting 0.5 fib retracement level is on course for a new bullish rally with a potential target of new all time high. Targets are mentioned on the chart.

📊 2223 Shares Technical Analysis 📈📊 2223 Shares Technical Analysis 📈
🔍 On the daily timeframe, we're exploring the potential for a bull run using the "Smart Money" concept. Here's a quick breakdown:
**Trend**: The stock has been consolidating, indicating market indecision.
Remember, this is not financial advice. Do your own research and consult a professional before investing. 🚀💰💡
