Short Term Trade IdeaHuge Divergence on the lower and higher time frames, singling a potential reversal to the point of interest.
1.50 SAR
95.82 M SAR
2.56 B SAR
6.00 M
About Tanmiah Food Company
Sector
Industry
CEO
Sayed Zulfiqar Al-Hamdani
Website
Headquarters
Riyadh
Founded
1991
ISIN
SA15BH1H3KH5
FIGI
BBG011MC6WV4
IPO date
Aug 4, 2021
IPO offer price
17.86 USD
Tanmiah Food Co. engages in the manufacturing, wholesale, and retail trading of food and agriculture products and its by-products. It operates through the following geographical segments: Kingdom of Saudi Arabia, United Arab Emirates, Bahrain, and Other GCC Countries. The company was founded on October 15, 1991 and is headquartered in Riyadh, Saudi Arabia.
Related stocks
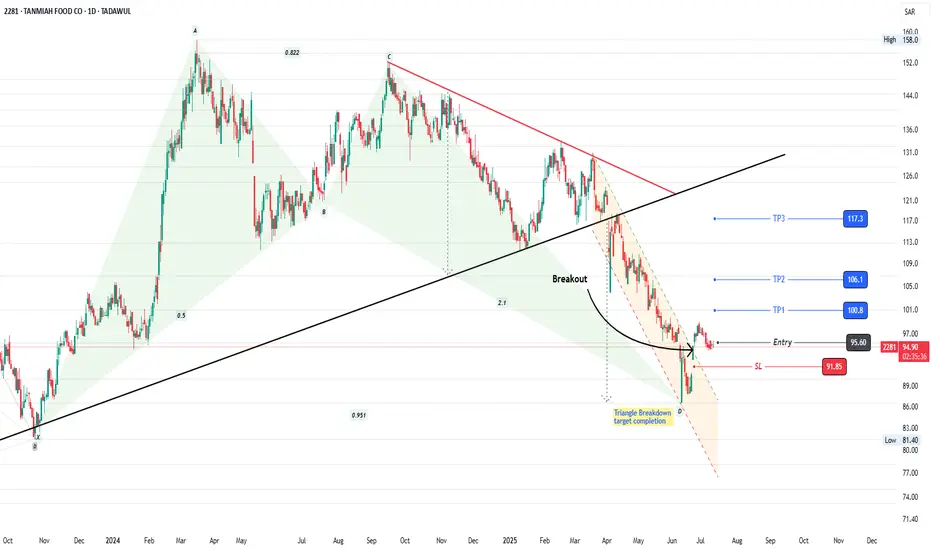
2281: Bullish Harmonic Pattern2281: Bullish Harmonic Pattern
2281 is struggling since last ATH in Sept 2024. Beautifully forming a Bullish harmonic pattern at significant support level.
Breakout of descending parallel channel is observed. Formation of HH and HL confluence is also favoring bulls.
Take Entry now or
After
2281: Bullish Reversal from POC_Golden Pocket2281
Continuously in downtrend. Earlier estimations of reversal from bearish flag completion and support levels did not sustain (Bears dominated).
However, current price movement (green candles) at POC is confirming the interest of buyers.
This is in confluence with 50% fib (Golden Pocket)
Entry

2281: Bullish Candles at support2281 was taking correction recently
A bearish flag formation is completed
Price is respecting a significant support zone
3 consecutive green candles including hammer is showing an upside movement potential.
Trade with proper risk management.
Keep SL intact

2281: Watchout for New Entry2281
An important support of 140 is broken, however, it is still in golden pocket (138.6)
Watchout for support at Channel bottom (136.8)
Entry after green candle at support
Do proper risk management

2281: Watchout for SupportPrice is moving within Ascending Parallel Channel after breakout
Last corrective movement is after double top formation
Price is at POC (Volume Profile) which is another support level
if it breaks, price may fall to channel bottom
Watchout for entry after confirmation

2281: Watchout_Double Top Formation2281 is moving nicely in an ascending parallel channel taking support from a long-term trendline support continuously.
Price has shown breakout from parallel channel and has formed double top at a critical resistance of 140.
Bulls need to break the resistance of 140 to continue the bullish trend or

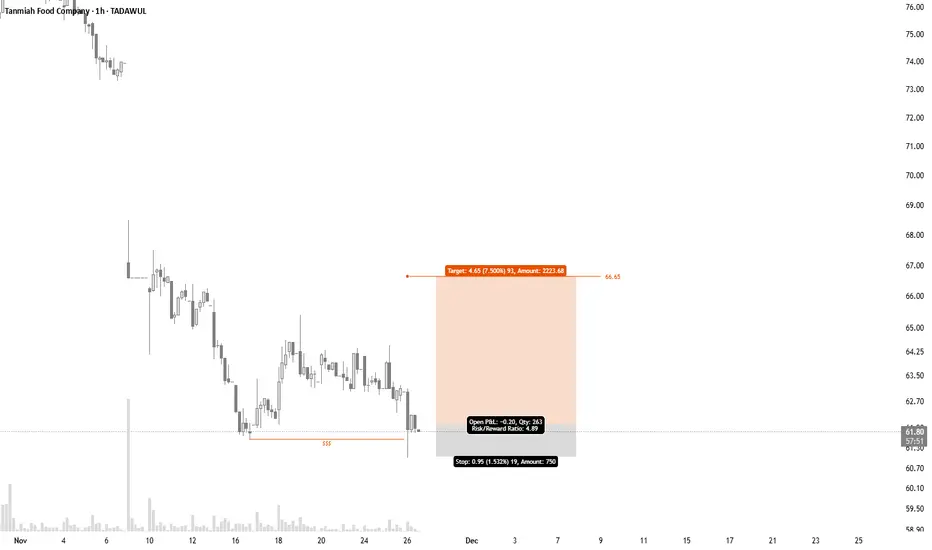
Tanmiah (2281): Trendline SupportTanmiah is again at the trendline support confluence with horizontal support line.
Entry levels with SL are specified with TPs.
Manage your risk accordingly.


TANMIAH: Trendline Support_BullishTanmiah is respecting a trendline support
A recent resistance (horizontal line) is broken and converted into support. A retest at new support line is observed.
Aggressive and conservative entry levels with SL are specified with TPs.
Manage your risk accordingly.

See all ideas
Summarizing what the indicators are suggesting.
Neutral
SellBuy
Strong sellStrong buy
Strong sellSellNeutralBuyStrong buy
Neutral
SellBuy
Strong sellStrong buy
Strong sellSellNeutralBuyStrong buy
Neutral
SellBuy
Strong sellStrong buy
Strong sellSellNeutralBuyStrong buy
An aggregate view of professional's ratings.
Neutral
SellBuy
Strong sellStrong buy
Strong sellSellNeutralBuyStrong buy
Neutral
SellBuy
Strong sellStrong buy
Strong sellSellNeutralBuyStrong buy
Neutral
SellBuy
Strong sellStrong buy
Strong sellSellNeutralBuyStrong buy
Displays a symbol's price movements over previous years to identify recurring trends.
Frequently Asked Questions
The current price of 2281 is 61.95 SAR — it has decreased by −0.32% in the past 24 hours. Watch Tanmiah Food Company stock price performance more closely on the chart.
Depending on the exchange, the stock ticker may vary. For instance, on TADAWUL exchange Tanmiah Food Company stocks are traded under the ticker 2281.
2281 stock has fallen by −2.98% compared to the previous week, the month change is a −19.39% fall, over the last year Tanmiah Food Company has showed a −52.49% decrease.
We've gathered analysts' opinions on Tanmiah Food Company future price: according to them, 2281 price has a max estimate of 155.00 SAR and a min estimate of 87.00 SAR. Watch 2281 chart and read a more detailed Tanmiah Food Company stock forecast: see what analysts think of Tanmiah Food Company and suggest that you do with its stocks.
2281 reached its all-time high on Mar 17, 2024 with the price of 158.00 SAR, and its all-time low was 60.50 SAR and was reached on Jun 20, 2022. View more price dynamics on 2281 chart.
See other stocks reaching their highest and lowest prices.
See other stocks reaching their highest and lowest prices.
2281 stock is 3.28% volatile and has beta coefficient of 1.04. Track Tanmiah Food Company stock price on the chart and check out the list of the most volatile stocks — is Tanmiah Food Company there?
Today Tanmiah Food Company has the market capitalization of 1.24 B, it has decreased by −2.13% over the last week.
Yes, you can track Tanmiah Food Company financials in yearly and quarterly reports right on TradingView.
2281 net income for the last quarter is −15.79 M SAR, while the quarter before that showed 498.00 K SAR of net income which accounts for −3.27 K% change. Track more Tanmiah Food Company financial stats to get the full picture.
Yes, 2281 dividends are paid annually. The last dividend per share was 2.24 SAR. As of today, Dividend Yield (TTM)% is 3.62%. Tracking Tanmiah Food Company dividends might help you take more informed decisions.
Tanmiah Food Company dividend yield was 1.85% in 2024, and payout ratio reached 46.75%. The year before the numbers were 1.87% and 50.04% correspondingly. See high-dividend stocks and find more opportunities for your portfolio.
EBITDA measures a company's operating performance, its growth signifies an improvement in the efficiency of a company. Tanmiah Food Company EBITDA is 334.33 M SAR, and current EBITDA margin is 13.36%. See more stats in Tanmiah Food Company financial statements.
Like other stocks, 2281 shares are traded on stock exchanges, e.g. Nasdaq, Nyse, Euronext, and the easiest way to buy them is through an online stock broker. To do this, you need to open an account and follow a broker's procedures, then start trading. You can trade Tanmiah Food Company stock right from TradingView charts — choose your broker and connect to your account.
Investing in stocks requires a comprehensive research: you should carefully study all the available data, e.g. company's financials, related news, and its technical analysis. So Tanmiah Food Company technincal analysis shows the sell today, and its 1 week rating is strong sell. Since market conditions are prone to changes, it's worth looking a bit further into the future — according to the 1 month rating Tanmiah Food Company stock shows the sell signal. See more of Tanmiah Food Company technicals for a more comprehensive analysis.
If you're still not sure, try looking for inspiration in our curated watchlists.
If you're still not sure, try looking for inspiration in our curated watchlists.