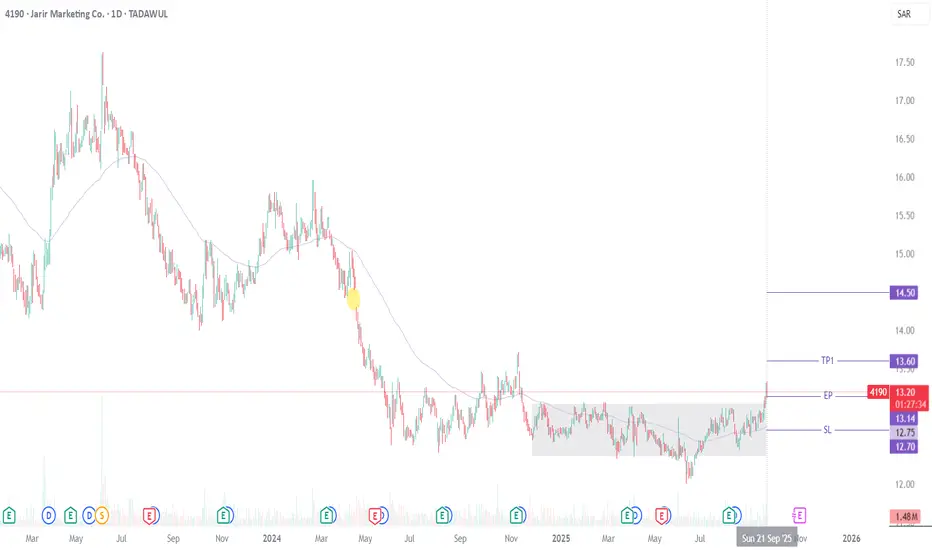
4190 Technical Analysis: Breakout with Gap-Fill Potential4190 (Jarir Marketing Co.)
Price has broken out of a consolidation range that extended from December 2024. It is trading above the 89 EMA — a level it has historically respected, reinforcing the bullish structure. RSI is also in sync with the move, adding further confirmation.
If price reaches TP1, there is a strong likelihood it will attempt to fill the previous gap down, aligning with TP2. The stop loss is set below the 89 EMA at 12.70 on a closing basis, while traders may consider scaling the stop upward as the trend progresses.
Recommended Levels:
Buy: 13.14 (CMP)
Stop Loss: Closing below 12.70
Take Profit 1: 13.60
Take Profit 2: 14.50
Take Profit 3: Ride the trend with a trailing stop
Potential upside remains as long as price sustains above the breakout zone and the 89 EMA. Happy trading!
Jarir Marketing Co.
No trades
Trade ideas
Massive consolidation area at low price rangeJarir is showing a massive consolidation at low price range prior to cutting down interest rate, its target price around 16 SAR

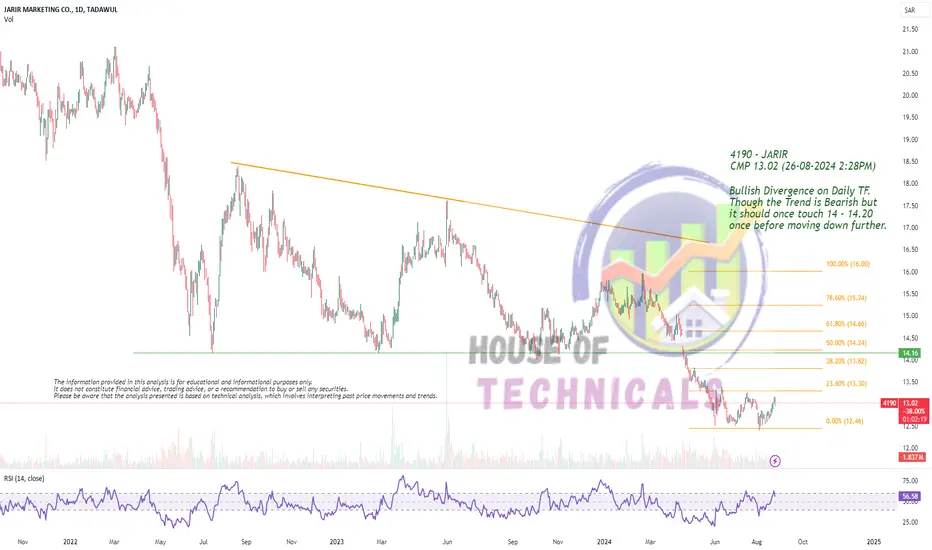
Bullish Divergence on Daily TF.Bullish Divergence on Daily TF.
Though the Trend is Bearish but
it should once touch 14 - 14.20
once before moving down further.
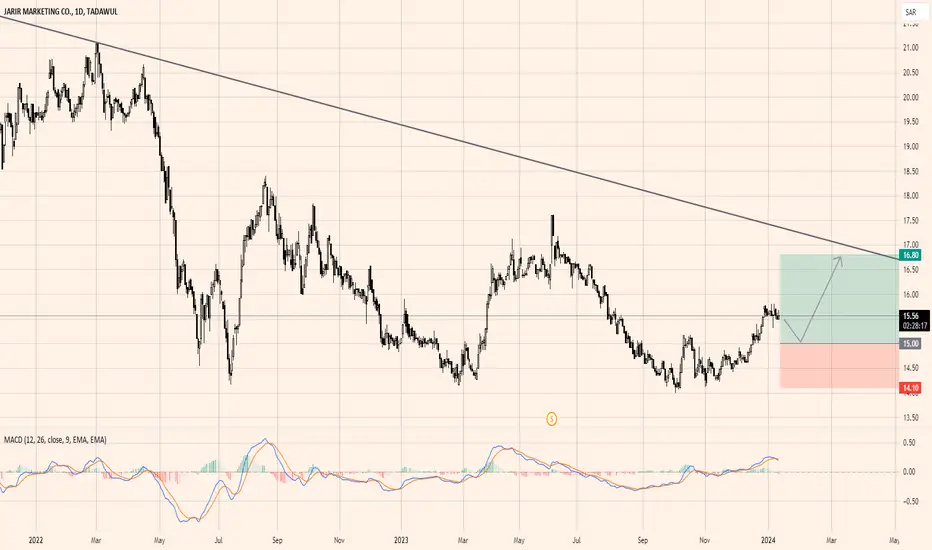
4190Jarir Marketing Company (4190) shows rejecting after cross over seemed in MACD. Support level is at 15 from where pull back can be seen. In a longer term price can test descending trend line around 16.80. To manage risk, a recommended stop-loss can be placed below 14.10.
Bullish Divergence in JARIR after Bearish Butterfly patternBullish Divergence observed in JARIR after Bearish Butterfly (bearish harmonic reversal) pattern completion. As expected the Bearish Butterfly pattern reversed from point D (potential reversal zone) and created a bearish trend on a daily time frame. A bullish divergence is now observed and the trend will likely reverse and a bullish trend will likely start. If the bullish trend is confirmed, this can be a good point to take long positions.

Jarir (4190) is targeting 16.10 then 17.20 after crossingDaily chart, Jarir stock is about to cross the resistance line (BLUE), then the target will be 17.20
Already a double V bottom formed and the target is 16.10
MACD is very positive, indicating upwards direction.
Stop loss below 14.9 should be considered.

4190 Al Jarir MarketingAl Jarir Marketing shares are on the rise, with prices tapping their resistance levels and on their way to the moon.
Al Jarir Marketing shares in a bullish trend, with prices breaking through their resistance levels. This is a sign that the rally is just getting started, and the shares could reach new highs in the coming months.

🟢 4190 JARIR MARKITING 🟢NO LIQUDITY SWEAP NO ENTRY.
STRUCTURE IS CHANGING ANYTIME.
EVERY CANDLE HAS LIQUIDITY.
PRICE ALWAYS NEED LIQUIDITY.
Nobody Knows Where is Price Going.
Hey traders, here is the analysi.
If you guys like my analysis please hit like?? and follow.
Thanks.
SMART MONEY CONCEPT.
identify Liquidity Or Become Liquidity
DISCLAIMER- This is not financial advice.

4190 JARIRNobody Knows Where is Price Going.
Hey traders, here is the analysi.
If you guys like my analysis please hit like?? and follow.
Thanks.
DISCLAIMER- This is not financial advice.
SMART MONEY CONCEPT.
identify Liquidity Or Become Liquidity

4190 JARIRNobody Knows Where is Price Going.
Hey traders, here is the analysi.
If you guys like my analysis please hit like?? and follow.
Thanks.
DISCLAIMER- This is not financial advice.
SMART MONEY CONCEPT.
identify Liquidity Or Become Liquidity


LONG on Jarir 4190BIAS: LONG
1.Price near previous LL
2. Bullish divergence on hourly and weekly chart
Short term target( swing trade): 153.80
TP1: 156.30
TP2: 161.46

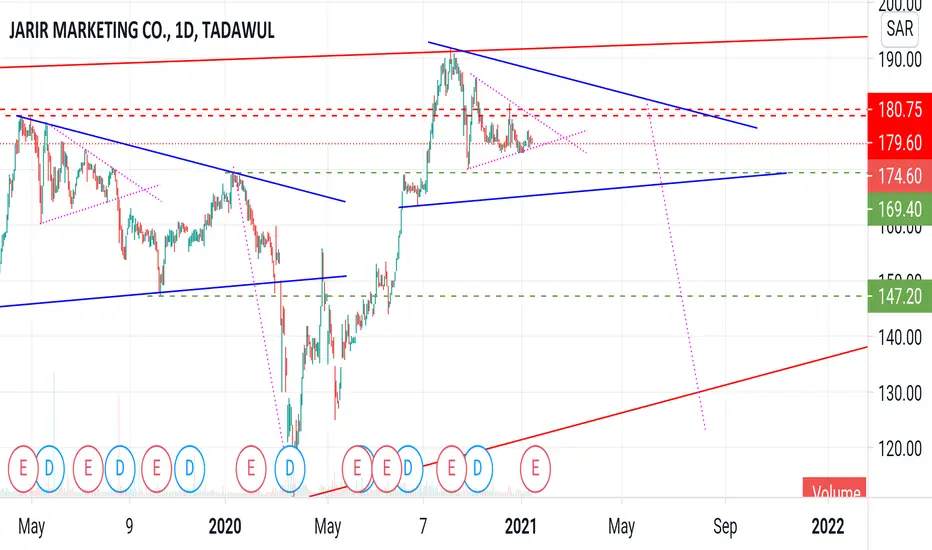
4190 has more chance to fallhello
if it breaks 180 strongly you should be seller otherwise it will follow the uptrend of its corridor and go up
so 2 scenareos are possible and it is up to you to follow just the willing of the market,
remember that we dont have cristall ball predecting markkets future but we try to be more efficient and more rational in our trading.
goodluck

Harmonic Failed impulse wave 113.0 I've seen the same scenario many times in the market. The level of 1.13 fib considers a harmonic failed impulse wave. to reach the desired price it might take 6 months or even a year from now.
I still want to go long in Jarir Saudi stock at 126 riyals per share


JARIR IS VERY STRONG BUT THE MARKET MAY GO DOWN IN ANY TIME Please share with me your thoughts,
Kind regards,

JARIR IS VERY STRONG BUT THE BEAR WILL REAR SOON PREPARE TO SELLPlease share with me your thoughts, Regards


Nice Trade done! (Check the screenshot for last idea) ;) TADAWUL:4190
As mentioned in my last idea on Jarir, it turned out to be correct! Feels great to be getting a hang on technical analysis. :)

Jarir Marketing Good Entry Buy It seems to me that Jarir Marketing will go up in the next few hours or days. Anyone who needs an advisor, I'm on duty.
Note:
(When I set the target and stop loss in a number that does not mean that the price will reach it, I only gave a buy or sell signal according to the analyzes that I performed in the chart and I delete it later, in order to share it with you so that you have a clear picture and you can read it in clear way
2, when you decide to use my ideas in your trading, please contact me to inform you of some things and monitor the position together without specifying the target or stop loss, we will decide when to open and close the position, thank you !!)
