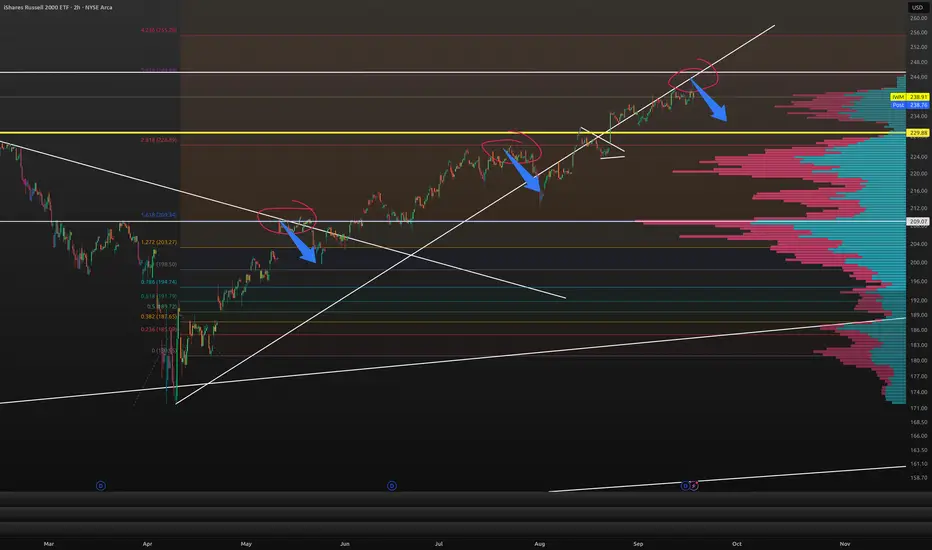
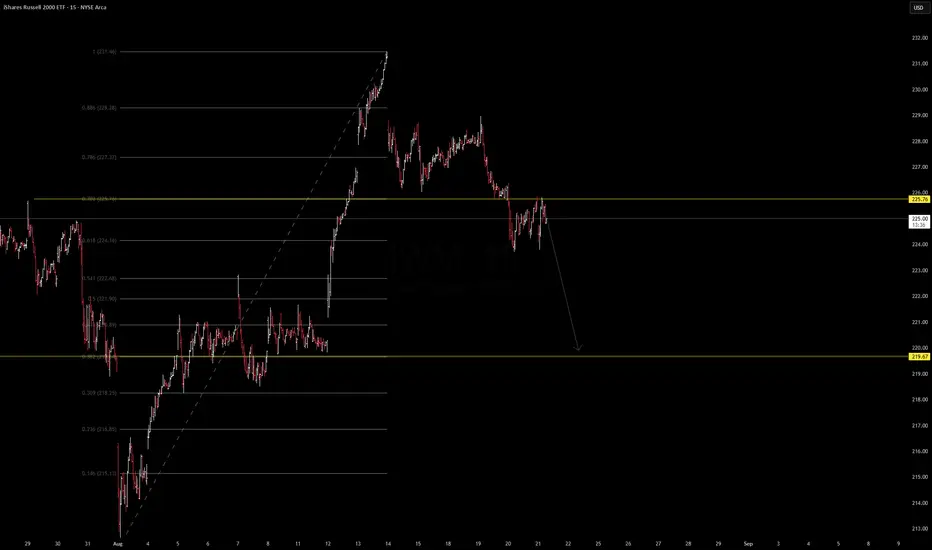
Fib Extension shows possible 5% pullback in IWMso this has worked for a while now. It looks like a pullback off the perfect pin of the 3.618 is possible. Past touches on the 1.618 and 2.618 gave about a 5% pullback. Check it out.
Related funds
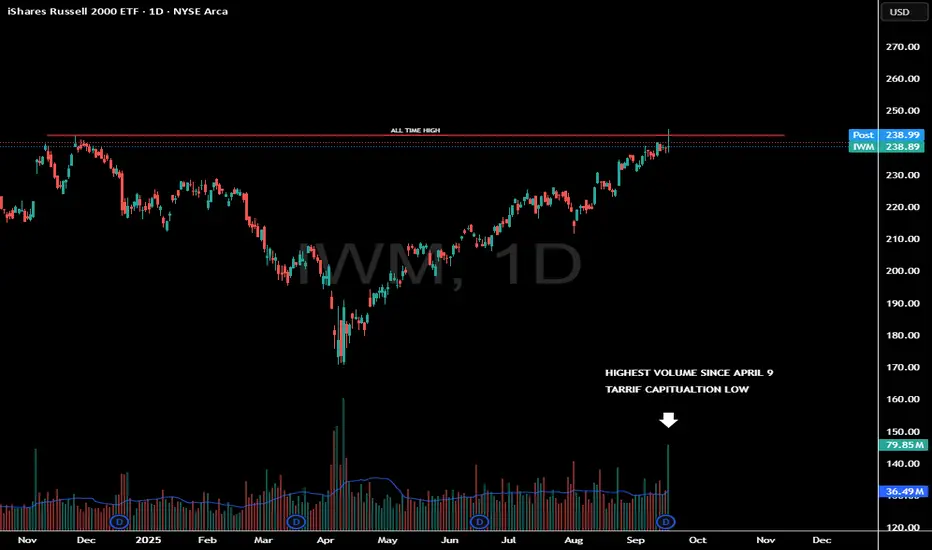
Highest Volume Candle Since Tarriff LowIWM saw a nasty reversal off the all time highs today.
A potential weekly topping tail is building.
What important about this reaction is the amount of volume that was traded.
This was the highest candle since April 9th.
High Volume reversals need to be monitored closely as it does show lar
Macro Picture for IWM (Russell 2000)The macro picture for IWM is one of heightened sensitivity to U.S. economic conditions, particularly interest rates. While it has underperformed large-cap indices recently, a favorable shift in monetary policy or a strengthening domestic economy could act as a powerful catalyst for a period of small


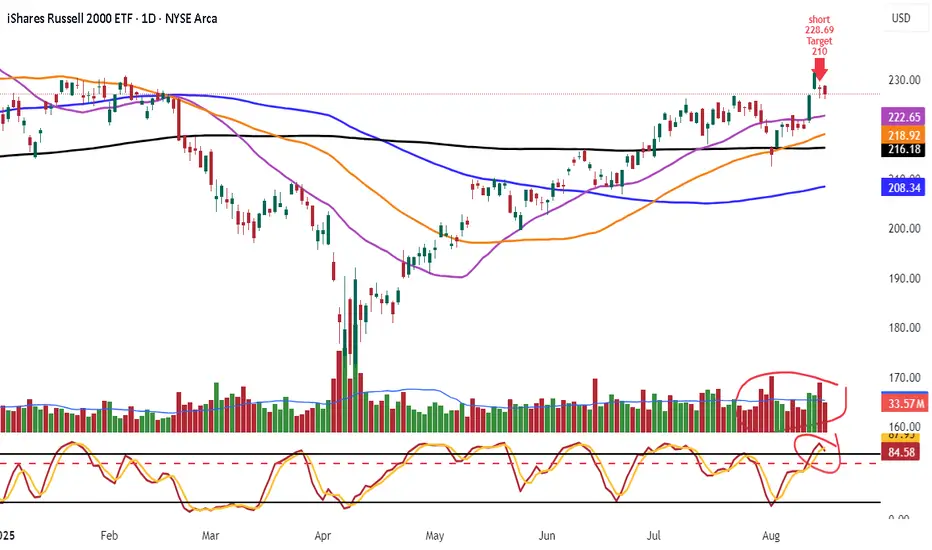
Shorted IWM 228.69 Target 210Look daily chart lower high stoch rolling over
look vol more selling buying
IWM Looks like 240 is incoming, most likely this move comes with a cool Core PCE this Friday and if not then, then most likely on next month job numbers .
Weekly trendline resistance from 2010 has resistance at around 240ish.
That's only another 3% upside
In an extreme move we could see price
IWM (Russell 2000 ETF) Update - Bearish Analysis. IWM (Russell 2000 ETF) Update
Price rejected from the 226–227 zone (Fib 0.786) and failed to reclaim the breakout structure. Currently consolidating below resistance, which opens room for a possible leg lower.
🔹 Key resistance: 225.7 – 226.0
🔹 Target support: 219.0 zone
🔹 Bias: Short-term bearish u
IWM Appears Due for a Minimum 40-60% Downside CorrectionOn the lower timeframes IWM has been treating $223 as short term support with much sold put leverage building at $220 and recently IWM has begun to retrace back down into those levels putting those sold puts at risk of expanding the volatility and of squeezing through these short puts as a result.

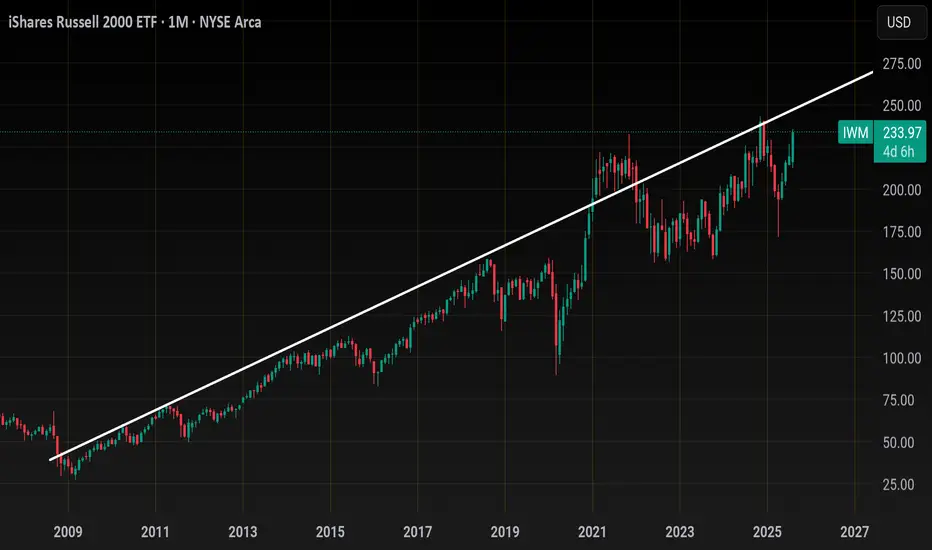
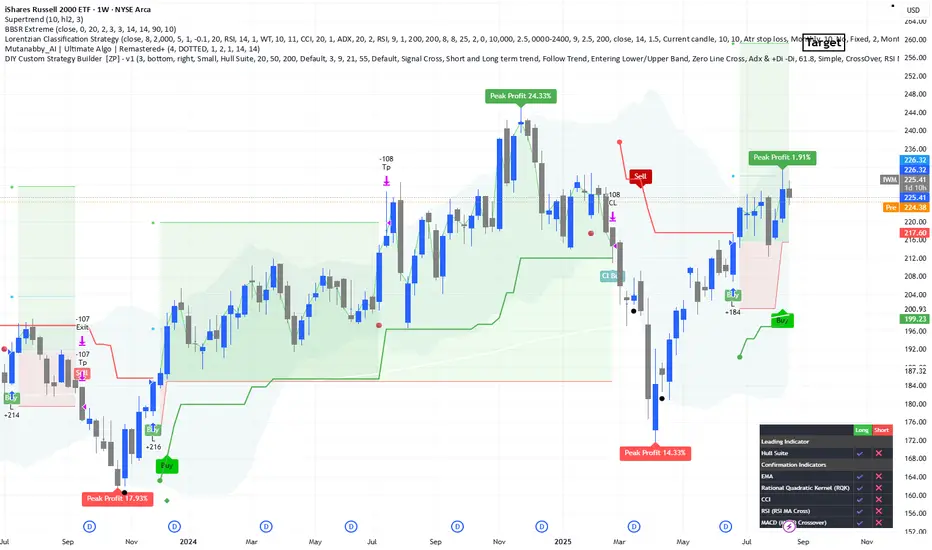
IWM Weekly Setup – Long OpportunitySpotted a promising long setup on the iShares Russell 2000 ETF (IWM) weekly chart. The price action is showing bullish momentum supported by volume and trend indicators.
🔹 Entry Zone: Current levels
🔹 Stop Loss: 196$ – below super trend line
🔹 Target: 260$
Technical indicators and moving averages
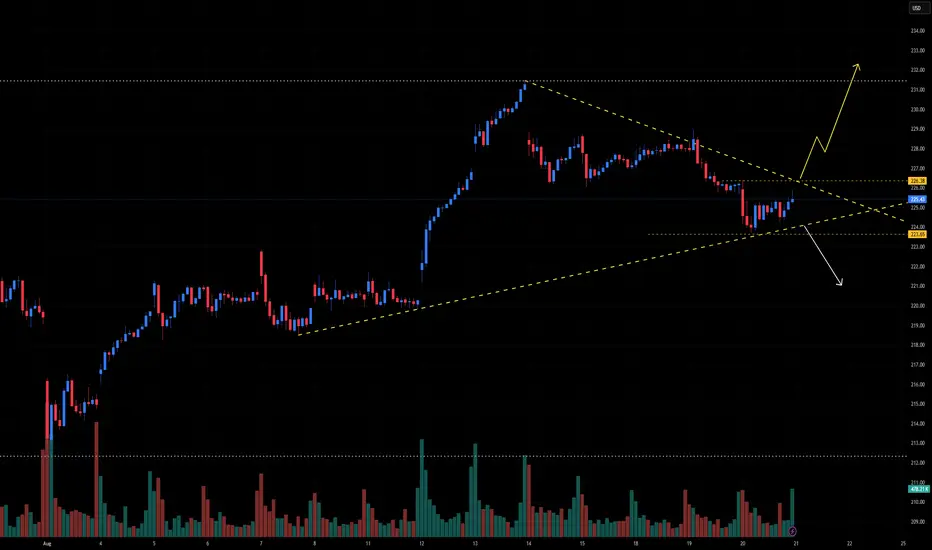
IWM is ready to make a larger move out of this wedge📈 IWM Technical Outlook – Wedge Break Imminent
Ticker: IWM (Russell 2000 ETF)
Timeframe: 30-minute candles
🔍 Current Setup
IWM has formed a symmetrical wedge, with price compressing between a descending resistance line (~227) and an ascending support line (~223.65). This pattern reflects a balanc
See all ideas
Displays a symbol's price movements over previous years to identify recurring trends.
Frequently Asked Questions
An exchange-traded fund (ETF) is a collection of assets (stocks, bonds, commodities, etc.) that track an underlying index and can be bought on an exchange like individual stocks.
Since ETFs work like an individual stock, they can be bought and sold on exchanges (e.g. NASDAQ, NYSE, EURONEXT). As it happens with stocks, you need to select a brokerage to access trading. Explore our list of available brokers to find the one to help execute your strategies. Don't forget to do your research before getting to trading. Explore ETFs metrics in our ETF screener to find a reliable opportunity.
No, IWM doesn't pay dividends to its holders.