QQQ $580 Call Alert: Moderate Bullish Setup – Trade Smart!
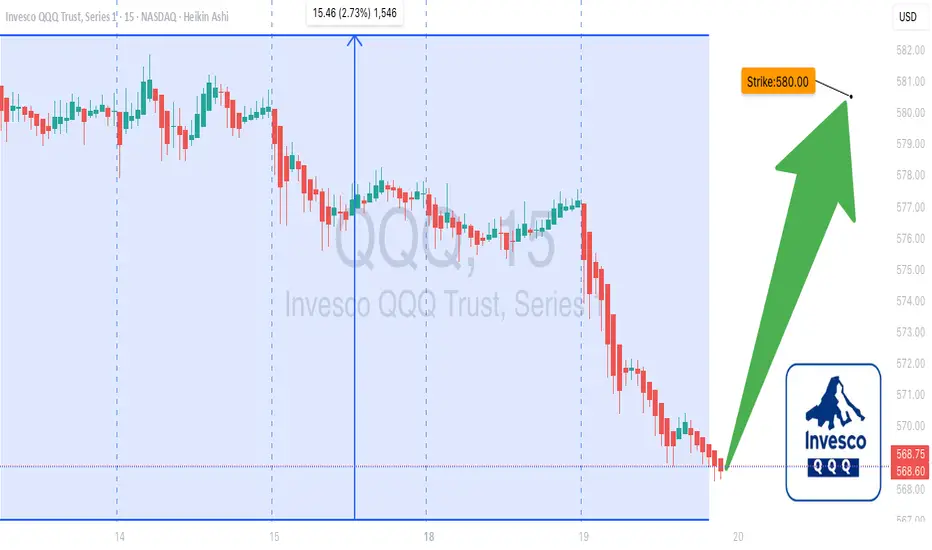
# 🚀 QQQ Weekly Options Alert – \$580 Call (Aug 19, 2025) 💎🔥
### **Market Snapshot**
📊 **Daily RSI:** 63.8 ⬇️ (cooling momentum)
📈 **Weekly RSI:** 71.0 ⬆️ (bullish trend)
📉 **Volume:** Weak (0.8–1.1x prior week) 🚨
⚖️ **Options Flow:** Neutral (1.00 C/P ratio)
✅ **Volatility:** Favorable (VIX 15.8)
💡 **Overall Bias:** Moderate Bullish, but cautious due to weak volume & mixed momentum
---
### **Model Highlights**
* **Agreement:**
* Weekly RSI trending bullish 📈
* Weak volume signals institutional caution 🚨
* Low VIX supports directional plays 💎
* **Disagreement:**
* Grok, DeepSeek, Claude: moderate bullish entry possible 💡
* Gemini, Llama: advise avoiding trades due to unclear signals ❌
---
### **💥 Trade Recommendation**
🎯 **Strategy:** Cautious Call
* 🏦 **Instrument:** QQQ
* 💵 **Strike:** \$580
* 🗓️ **Expiry:** Aug 19, 2025
* 💰 **Entry Price:** \$1.30
* 🎯 **Profit Target:** \$1.40
* 🛑 **Stop Loss:** \$0.75
* ⏰ **Entry Timing:** Market Open
* 📈 **Confidence:** 65%
⚠️ **Key Risks:**
* Weak institutional support 📉
* Potential consolidation ⚖️
* Market volatility ⛈️
---
### **Trade JSON**
```json
{
"instrument": "QQQ",
"direction": "call",
"strike": 580.0,
"expiry": "2025-08-19",
"confidence": 0.65,
"profit_target": 1.40,
"stop_loss": 0.75,
"size": 1,
"entry_price": 1.30,
"entry_timing": "open",
"signal_publish_time": "2025-08-19 15:01:00 UTC-04:00"
}
```
📊 **Quick Trade Recap:**
🎯 CALL \$580 | 💵 \$1.30 → 🎯 \$1.40 | 🛑 \$0.75 | 📅 Aug 19 | 📈 65% Confidence
QQQ trade ideas
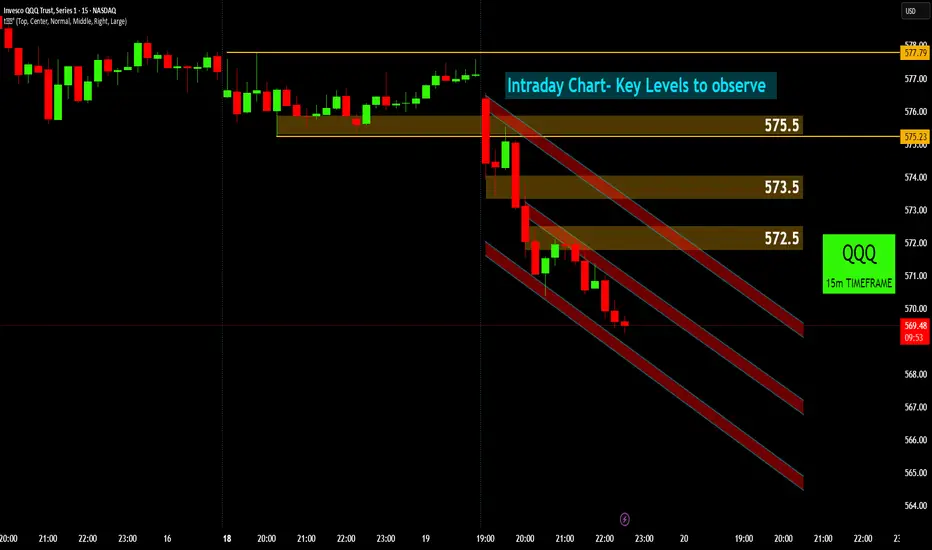
QQQ: Navigating the Intraday Downtrend🔭 QQQ's Current View: Bearish Channel in Focus! ⬇️
QQQ's intraday chart shows a recent breakdown, with price now navigating a clear bearish channel.
Initial Breakdown: QQQ experienced a sharp drop below 575.5 💥, turning previous support into immediate resistance. This marked the start of the current bearish leg.
Bearish Channel Formation: Price is now moving within a well-defined descending channel 🔽🔽🔽. This indicates short-term bearish control, with sellers dominant.
Overhead Resistance Zones: Key resistance levels to watch are 572.5 🧱 and 573.5 🧱. These levels, along with the channel's upper boundary, represent potential areas where sellers might step in if price attempts to rally.
Intraday Outlook: Traders should monitor how QQQ reacts within this channel. A move above the channel and 573.5 would signal a shift, while continued weakness points to further downside potential within the channel. Stay vigilant on these key levels for any intraday reversal or continuation signals.
Disclaimer
The information provided in this chart is for educational and informational purposes only and should not be considered as investment advice. Trading and investing involve substantial risk and are not suitable for every investor. You should carefully consider your financial situation and consult with a financial advisor before making any investment decisions. The creator of this chart does not guarantee any specific outcome or profit and is not responsible for any losses incurred as a result of using this information. Past performance is not indicative of future results. Use this information at your own risk. This chart has been created for my own improvement in Trading and Investment Analysis. Please do your own analysis before any investments.
QQQ Gap PlayRight now, QQQ is resting right at wedge support + pivot, which is often where the next directional move starts
Price is pressing on the lower wedge line but not breaking with conviction
Volume (white line) is tapering, which means the “breakdown” pressure hasn’t been confirmed
Wedges love fake breakdowns - only act when price + volume confirm together
Gap up reclaims $578 at open with volume; ideally, a green candle with little/no lower wick (shows buyers controlled the whole session)
$582 to ~$586 AVWAP ($580C/$582C scalp, $585C swing)
Invalid back under ~$577
Gap down or fail $577 at open; ideally, opens & trades below $576 (prevents fake breakdowns) with volume expansion on the red candle (confirms sellers are pressing) - bonus if price retests $577 & fails (strong confirmation of breakdown)
$572, then ~$569 to ~$568 ($577P scalp, $575P main, $570P runner)
Invalid if price reclaims & holds above 579

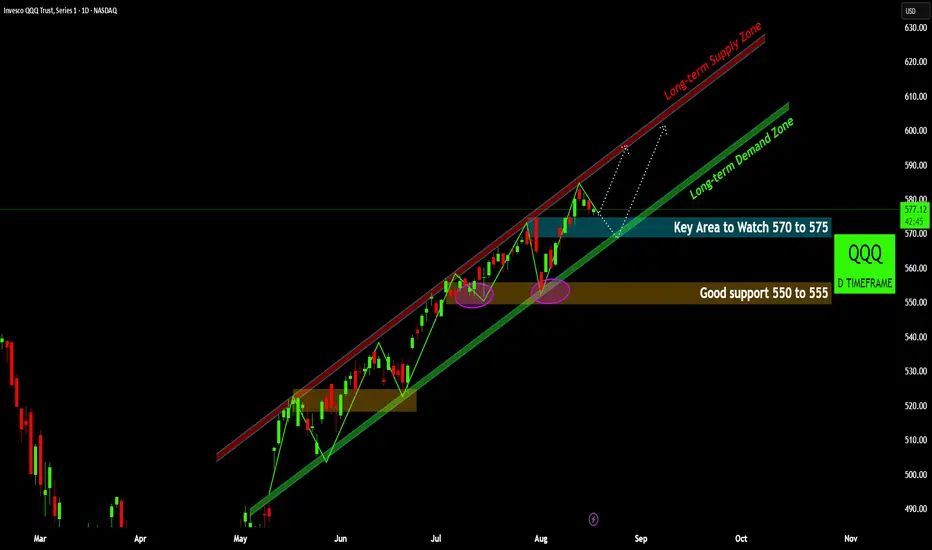
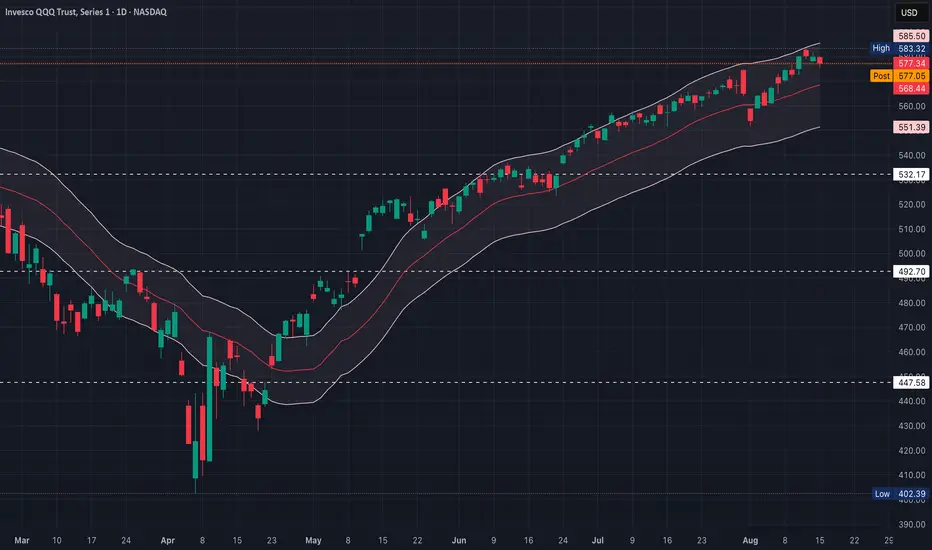
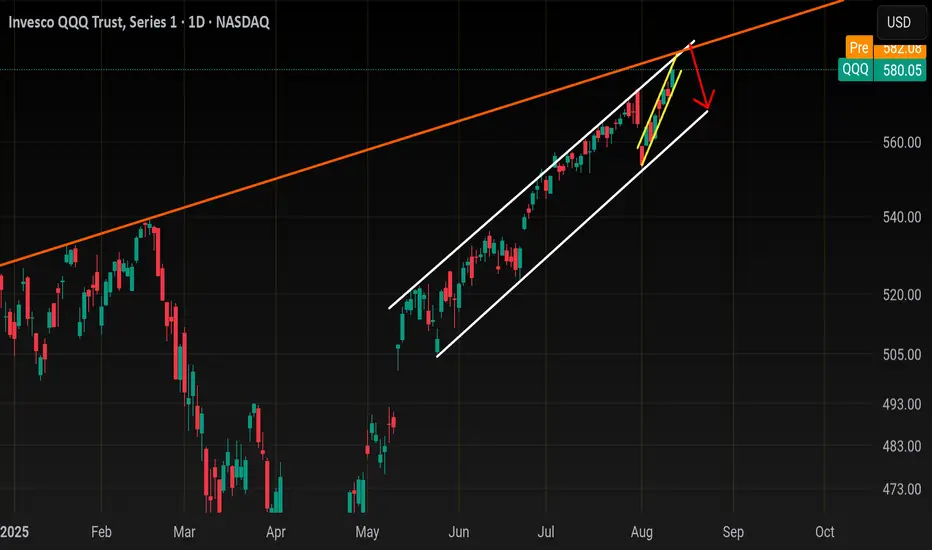
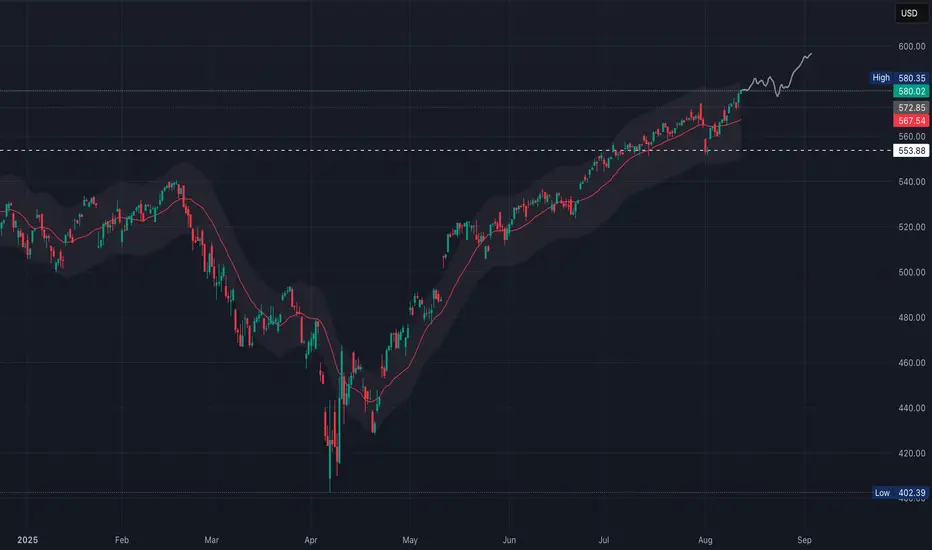
QQQ: Riding the Growth Wave – Key Demand Zones!QQQ: Riding the Growth Wave – Key Demand Zones! 🌊
QQQ continues its impressive ascent, firmly entrenched within a well-defined long-term bullish channel. The daily timeframe reveals critical demand zones currently in play, shaping the index's immediate future.
Persistent Bullish Channel: QQQ has maintained a robust uptrend within a clear long-term demand zone (green trendline) and is approaching the long-term supply zone (red trendline) 📊. This structure signifies consistent buyer interest and upward momentum.
Immediate Support in Focus: The 570-575 area 💙 represents a crucial immediate support zone. This level aligns directly with the lower boundary of the long-term demand channel, making it a pivotal area for buyers to defend and sustain the current uptrend.
Stronger Foundational Support: Should the immediate support yield, a more significant "good support" lies within the 550-555 range 🟠. This zone has historically proven resilient, acting as a strong floor for previous pullbacks and providing a robust buying opportunity.
Path to Supply Zone: A successful rebound from the current demand zone, particularly if the
570-575 level holds strong, would likely propel QQQ back towards its long-term supply zone 🔴. This upper channel boundary would represent the next major resistance target.
Outlook: The overall bullish trend remains intact as long as QQQ respects its long-term demand channel. Vigilance at the 570-575 level is key. A decisive break below this, however, could see the index testing the stronger 550-555 support ⚠️.
Disclaimer:
The information provided in this chart is for educational and informational purposes only and should not be considered as investment advice. Trading and investing involve substantial risk and are not suitable for every investor. You should carefully consider your financial situation and consult with a financial advisor before making any investment decisions. The creator of this chart does not guarantee any specific outcome or profit and is not responsible for any losses incurred as a result of using this information. Past performance is not indicative of future results. Use this information at your own risk. This chart has been created for my own improvement in Trading and Investment Analysis. Please do your own analysis before any investments.
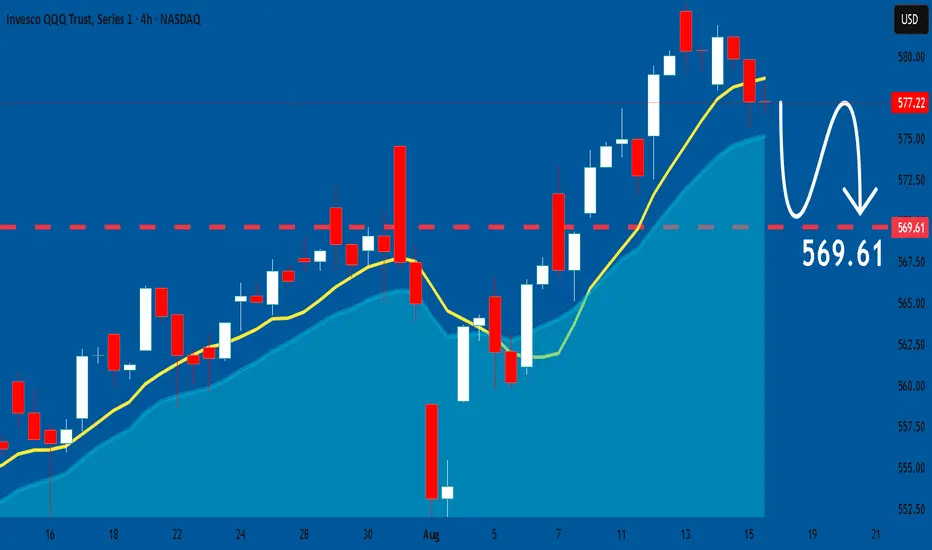
QQQ Holding StrongQQQ is holding strong this week above key moving averages, supported by ST bullish setups that look appealing, but it's important to watch for overbought signals & broader macro triggers for confirmation or caution
If QQQ pushes above $580 with conviction, the path toward $586–$589 looks paved; especially, if heavyweights like NVDA, AAPL, or MSFT continue to lead
With the strong trends, using short-dated call setups (within 1–2 weeks) could capitalize on momentum, but keep risk due to time decay in mind
A dip to the 50d MA (~$554) could offer a higher-probability entry zone; especially, if broader market sentiment remains constructive
A breach below $540 & a move toward the 200d MA (~$515) would likely signal a deeper correction or trend shift
RSI nearing overbought levels means gains could slow or reverse without fresh catalysts & with Fed sentiment in focus (Powell's Jackson Hole speech), a dovish or hawkish tone could significantly sway prices (markets could swing down if investor expectations aren’t met)

QQQ vs IWM – Big Tech Leaves Small Caps BehindQQQ +31% YTD - AI boom, cloud demand, mega-cap strength.
IWM +12% YTD - Higher costs, weak margins, slower growth.
The gap is widening.
Breakouts in QQQ = more upside potential.
IWM struggling near resistance, small caps lagging.
Watch if rate cuts spark a small-cap catch-up, or if Big Tech continues to lead into 2026.

QQQ: Bears Will Push Lower
Remember that we can not, and should not impose our will on the market but rather listen to its whims and make profit by following it. And thus shall be done today on the QQQ pair which is likely to be pushed down by the bears so we will sell!
Disclosure: I am part of Trade Nation's Influencer program and receive a monthly fee for using their TradingView charts in my analysis.
❤️ Please, support our work with like & comment! ❤️
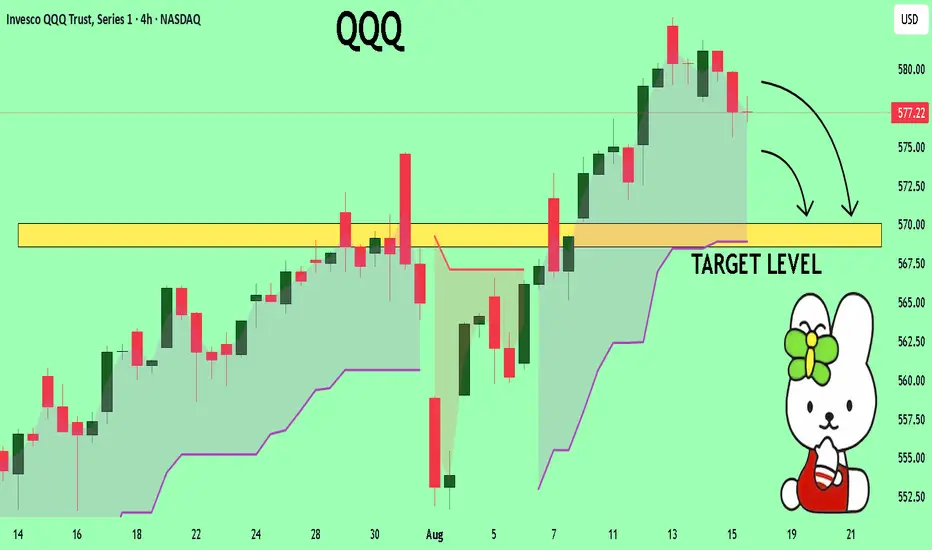
QQQ A Fall Expected! SELL!
My dear friends,
Please, find my technical outlook for QQQ below:
The instrument tests an important psychological level 577.22
Bias - Bearish
Technical Indicators: Supper Trend gives a precise Bearish signal, while Pivot Point HL predicts price changes and potential reversals in the market.
Target - 570.06
About Used Indicators:
Super-trend indicator is more useful in trending markets where there are clear uptrends and downtrends in price.
Disclosure: I am part of Trade Nation's Influencer program and receive a monthly fee for using their TradingView charts in my analysis.
———————————
WISH YOU ALL LUCK
QQQ (15 August)Approximately 56.4% of the QQQ stocks are trading above their 50d MA & about 66.3% are trading above their 200d MA
These levels indicate a moderately positive near-term trend with just over half of the constituents are in ST uptrends, suggesting reasonable participation, though it's not a runaway bullish signal
A strong LT trend presence with two-thirds of stocks are in LT uptrends, supporting constructive structural strength beneath QQQ
These numbers suggest that while participation is positive, it's not extreme
If QQQ continues higher, it’s worth watching whether the 50d breadth climbs further (strengthening the breakout thesis)
If QQQ rallies, but fewer constituents join (50d breadth stalls or reverses), that could be a red flag for sustainability
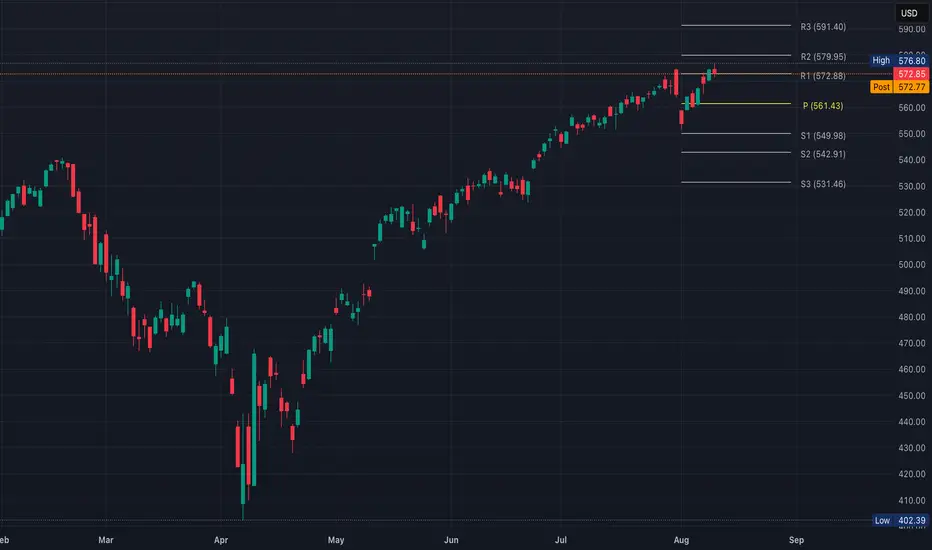
QQQ Closes @ R1QQQ closed right at the first level of resistance after August's disappointing NFP
A move up to $574 tomorrow that holds greatly weakens the bear thesis
QQQ Hesitation @ $580Given the tight range, expect either a fast breakout or quick rejection tomorrow (watch first 15 min volume — if it’s weak, false moves are more likely)
Bullish:
Short scalp: $582C or $585C (same week expiry)
Swing: $587C or $590C (1–2 wks out)
Stop-loss under $580 after breakout attempt
Bearish:
Scalp: $578P or $575P
Swing: $570P for main target, $565P if looking for deeper flush
Stop-loss above $580 after breakdown attempt

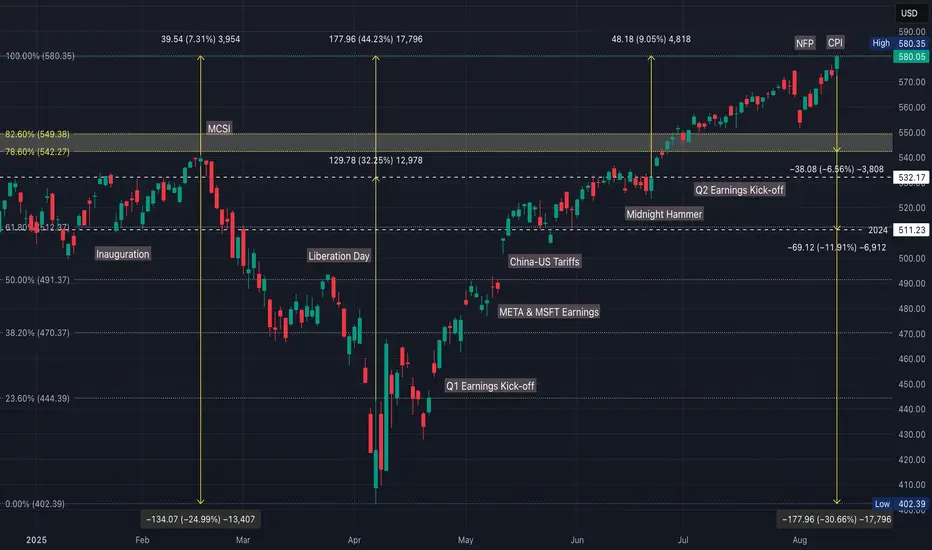
QQQ 3-Year Correction Overdue Since 2015 the Nasdaq Index has undergone approximately 25% corrections from all-time-highs every 3 years. Over this time period, the price has more or less respected the trend lines shown above. But perhaps a force more powerful than the trendline is the timeline.
The pattern repeats at roughly 39-month intervals from top to top:
May '12 - July '15 (1175 days)
pivot from 5/1/12 ATH, 12%* correction over 35 days
July '15 - October '18 (1170 days)
pivot from 7/20/15 ATH, 26% correction over 34 days
October '18 - November '21 (1148 days)
pivot from 10/1/18 ATH, 24% correction over 84 days
November '21 - February '25 (1176 days)
pivot from 11/22/21 ATH, 38%** correction over 324 days
February '25 - May '28
pivot from 2/18/25 ATH, ??% correction
If the pattern holds true, we were due a correction last week. My guess is we'll double-top December's ATH and then start the correction. How deep for how long is anyone's guess. Feels more like '21 insanity than '15 or '18 to me.
Notes:
*2012 (I believe) not yet representative of participation in the trendline pattern (still recovering from Great Recession)
**This particular correction was covid-anomolous (we were 24% above the channel already when we pivoted). This particular -38%, 324-day correction was more like 3-in-1: -22% in 97 days, -27% in 80 days, -24% in 59 days. You may get a better pattern predictor if you average the 3 moves, so -24% over 77 days. Alternatively, you can see it as two moves: an intial -22% move to bring it back within the channel, followed by a second -24% move to bring it to the bottom of the channel.

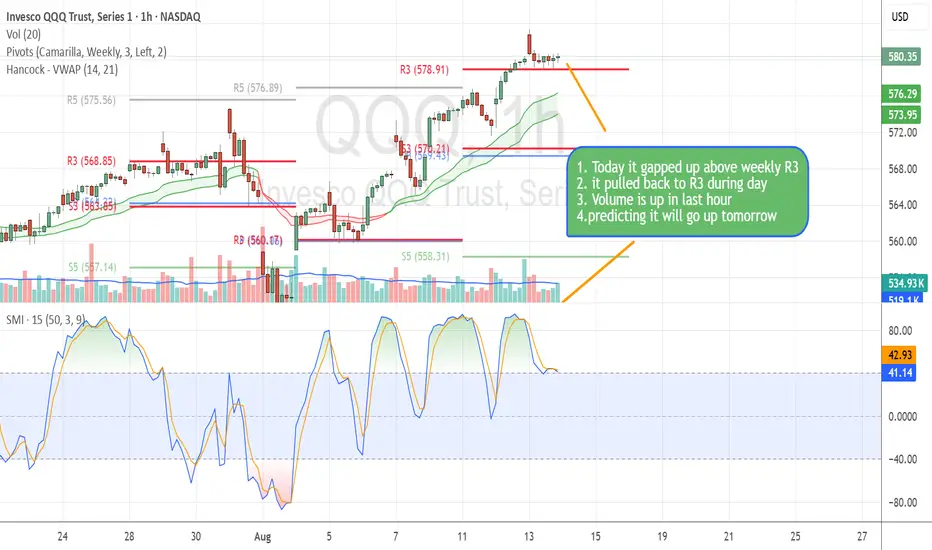
QQQ Price Action Recap & Tomorrow’s Outlook📈 QQQ Price Action Recap & Tomorrow’s Outlook
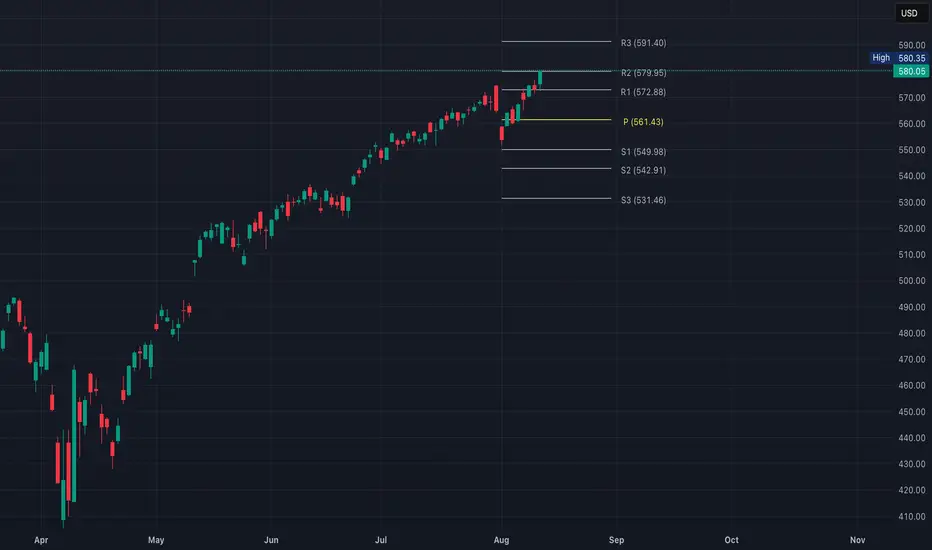
1. **QQQ opened with a gap above the weekly R3 pivot level**, signaling strong bullish momentum at the start of the day.
2. **It retraced intraday, testing R3 as support**, which held firmly through the session.
3. **R3 is now acting as a key support zone**, reinforcing the bullish bias.
4. **Volume picked up significantly in the final hour**, suggesting renewed buying interest.
5. **Based on current price action and momentum, I anticipate further upside tomorrow.**
📝 **Chart Notes:**
- I'm using **Camarilla weekly pivot levels** for reference.
- At the bottom of my chart, you'll find the **Stochastic Momentum Index**, which adds context to the trend strength and potential reversals.
Warning: This idea is published for educational purposes only. Please do your research before taking any position.
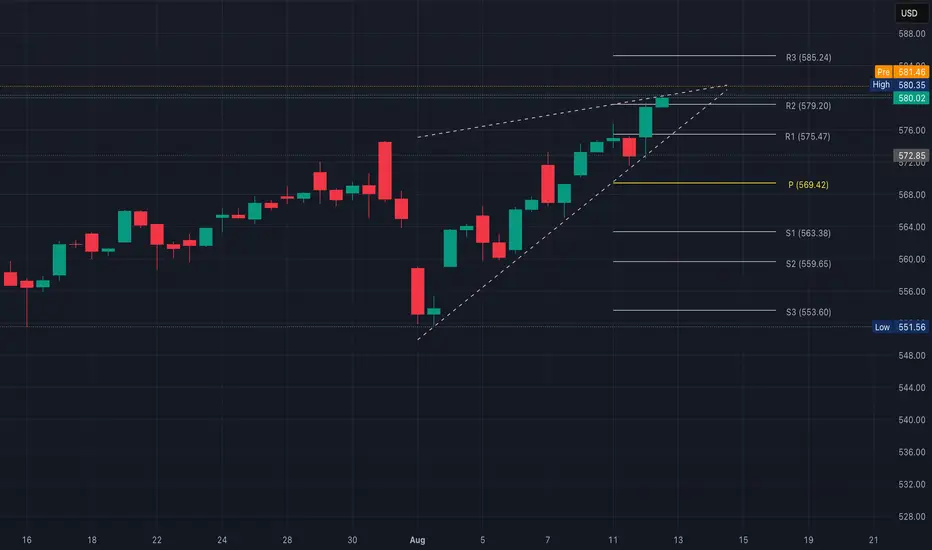
QQQ Breakout or fake out?Wedge fakeouts often reverse sharply, so puts could pay fast if rejection holds
If QQQ closes above $580 with follow-through & volume, then R3 @ $585.24
Invalid if price breaks back below $578
If QQQ fails at wedge top and breaks below $576 (lower trendline), then R1 at $575.47 (could bounce here intraday)
Invalid if price breaks back above $578
The next couple of candles will decide
Qqq... tech wreck incomingIt's a been awhile since I covered Tech and the sectors..
To make a long story short, I think the rally from April low is about 95% completed and anything up here is Distribution...
After Distribution, usually a correction comes and given the Sept Seasonality I think this correcti9m could be 7-12%.
Here's Qqq on the monthly...
At this pace , the monthly trendline can be met at 585 give or take which is only 1% away.. with us being so close to resistance, they will not be able to push everything all at once.. in the next week or so you will start seeing more and more divergence where only a select few will pump this across the 585 goal line.
Also on the monthly time frame, you can see that Qqq is outside its Bollinger bands, we won't make it out of Sept with that setup.
Daily chart
Daily candle is 60% outside its Bbands.. this is always a red flag on the indexes... Some Meme stocks like PLTR or Crcl may rally outside bbands but the indexes usually don't hold more that a day outside.. only in a few Seasonality squeezes Nov-Jan have I seen this
Being outside Bollinger bands and near monthly and daily trendline is terrible Risk for a long here.
Now the sectors..
There are really 4 main sectors that move Qqq.
Consider Qqq a car and the sectors are important pieces (Engine,transmission).
Here's AMEX:XLC
This is the sector of Meta, googl , and Nflx.
At resistance here ,
Outside daily bbands
NASDAQ:SMH
Home of Nvda,Tsm, and Avgo
The overbought at resistance setup is the same as XLC
AMEX:XLK
This is the biggest sector here
Home of Msft , aapl and nvda also
Same shit as the first 2
XLK may have room for 270 but that's it.
The last 2 times I saw a setup on Qqq where sector and index were all telling me the same thing was Dec 15th 2024 and Feb 14th 2025 ; Qqq corrected a few days later of both dates ..
The only sector that is an enigma to me right now is AMEX:XLY
The home of tsla and amzn
Weekly chart
This doesn't look bearish
It's not overbought like the others which is because amzn and tsla have lagged the other big tech names on this rally
Daily chart
Needs to clear 228 for Tsla to push higher we head back to 218
Could they correct the rest of tech and pump just tsla and or amzn? Absolutely. Propping up a couple and dumping the rest is called a plunge protection.. it won't stop qqq from bleeding but instead of a 12% correction, you'd end up with a 7-10%. Fawkery.
Let's see what happens with XLY
So let's zero in on Qqq
As far as trading goes today
Nq 4hour money flow indicator combine
with Qqq 15min money flow
combined
with us gapping out side bollingerband tells me do not chase the long here, there is a high chance we flush and close this gap today but I don't think we will break back below 578-579 before we tag 585 could come on PPI tomorrow..
So let's say today's resistance is 583, you'd short there with a 579-580 target.. be willing to add to your short up into 585. Cut losses above 585.. like I said , I don't think we break back below 577 until 585 is tagged so today may be a scalp short before the last leg up
The bottom of this Daily channel is around 568-570, with the 20ma right below it.. that will be your short term target once 585 is reached. The real correction starts below 566
2 big catalyst next week are Fed minutes Wed and Jackson hole which starts on the weekend
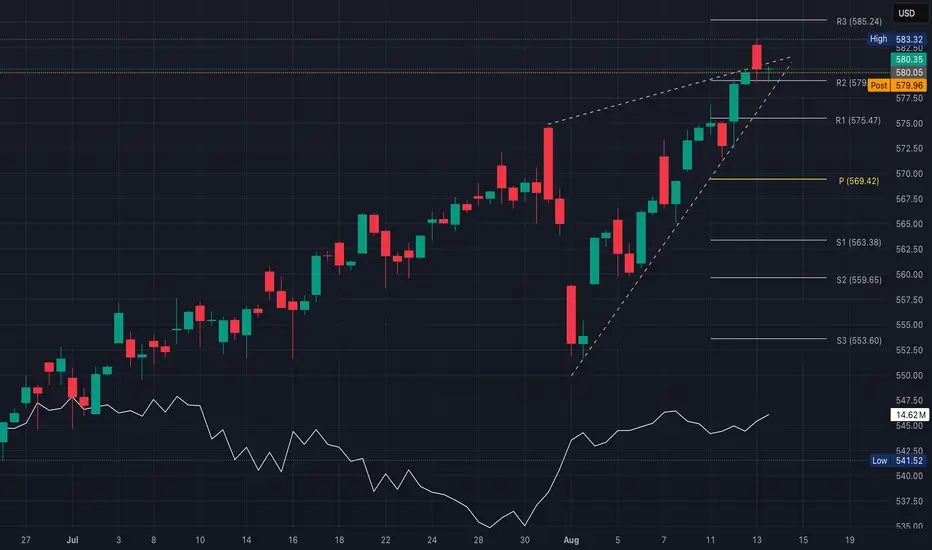
QQQ Rising WedgeA rising wedge is generally considered bearish, especially if volume is decreasing into the apex
R2 ($579.20) & the wedge top (~$579.5–$580)
R3 ($585.24) if it breaks out
Trendline support around $576, then R1 ($575.47) & pivot ($569.42)
If price fails here & breaks the lower wedge line, it could trigger a pullback toward the pivot or
S1 ($563.38)
Breakout above wedge & R2 could push quickly toward R3
Break below wedge support could accelerate selling to pivot/S1
$QQQ Analysis, Key Levels & Targets
What a crazy day. We had CPI in premarket today then we kept up and we took it past all-time highs to the top of the implied move to the top of the implied move on the next day so we close just above 5 cents above 580
Volatility got crushed today CBOE:VXN down -7.32 destroying options and shorts betting on downside
DID YOU SEE the bounce on the 35EMA by the way??
I do believe that tomorrow we will be trading under 581. Thursday we have PPI and because we're in an in between day tomorrow I think we might be a little bit more flat also look at how high up that 35 EMA is within the training range
(HIT GRAB THIS CHART - UNDER THE CHART NEXT TO THE 🚀)
QQQ Path to $600Macro Tailwinds
~95% odds of a September rate cut, an actual cut plus dovish language would boost valuations
If inflation continues easing without a major growth slowdown, growth stocks could re-rate higher (soft landing vs stagflation narrative)
Yields
10Y Treasury back toward 3.8-4.0%
Lower yields historically supportive for QQQ
Earnings
Mag 7 beating expectations in Q3 & Q4 keeps AI momentum intact
More than 65-70% of NDQ100 above their 50d SMA would confirm strength beyond a few leaders
Technical Path
Support near ~$573
Resistance around $577–580 (recent intraday highs)
Sustained closes above $580 with expanding breadth and volume is a breakout trigger
QQQ’s top end from an extended channel projection ~$590–595
Measured move from March–July base (~$520–$560 = $40 range; breakout above $560 projects ~$600)
Break $580 in late August–September on dovish Fed + solid earnings = $600 by Q4
Fed cuts + AI blowout earnings = $600 by late September.
Core inflation sticky + yields up = stall at $580, retest $550 before end of year

QQQ Closes @ R2The strong multi-day rally suggests buyers are in control, but hitting R2 often leads to short-term profit-taking
Watch for either a breakout continuation toward R3 or a pullback to retest R1
QQQ What could go wrong?Bulls are riding the tailwind of weakening headline inflation, buyer-friendly rate outlooks, and AI/tech strength.
~61% of QQQ stocks are above their 200d SMA, but only ~48% above 50d SMA
Need 60–65% stocks above 50d SMA
New highs consistently > 8–10% of index components
Bears flag concerns around persistent core inflation, lofty valuations, technical caution, and long-term risk exposure—especially if QQQ’s momentum disintegrates
Core CPI remains sticky (like the latest 3.1% YoY) which delays Fed cuts
Geopolitical/tariff shocks hitting supply chains or tech exports
Earnings misses from big AI names which reverses sentiment
Yield spike above 4.4% on the 10-year (valuation compression)
QQQ Path to $600Macro Tailwinds
~95% odds of a September rate cut, an actual cut plus dovish language would boost valuations
If inflation continues easing without a major growth slowdown, growth stocks could re-rate higher (soft landing vs stagflation narrative)
Yields
10Y Treasury back toward 3.8-4.0%
Lower yields historically supportive for QQQ
Earnings
Mag 7 beating expectations in Q3 & Q4 keeps AI momentum intact
More than 65-70% of NDQ100 above their 50d SMA would confirm strength beyond a few leaders
Technical Path
Support near ~$573
Resistance around $577–580 (recent intraday highs)
Sustained closes above $580 with expanding breadth and volume is a breakout trigger
QQQ’s top end from an extended channel projection ~$590–595
Measured move from March–July base (~$520–$560 = $40 range; breakout above $560 projects ~$600)
Break $580 in late August–September on dovish Fed + solid earnings = $600 by Q4
Fed cuts + AI blowout earnings = $600 by late September.
Core inflation sticky + yields up = stall at $580, retest $550 before end of year
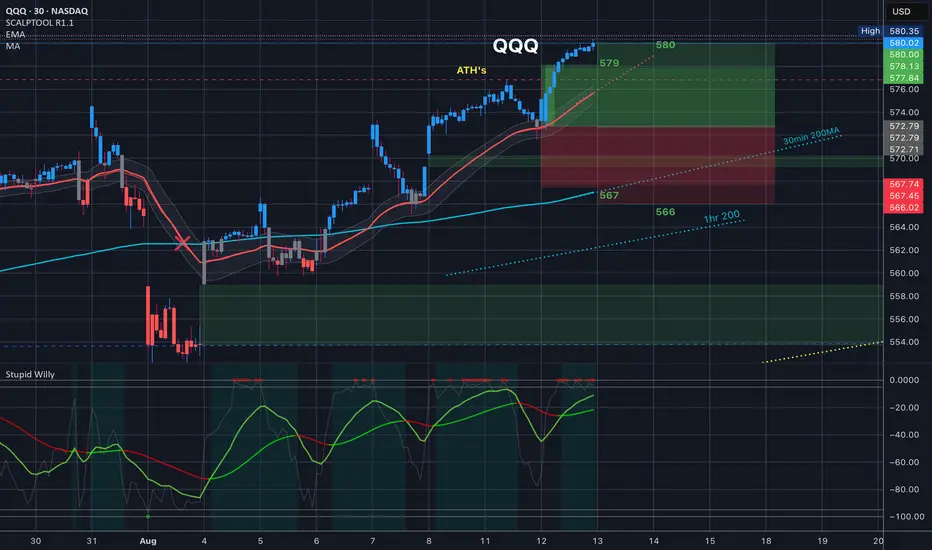
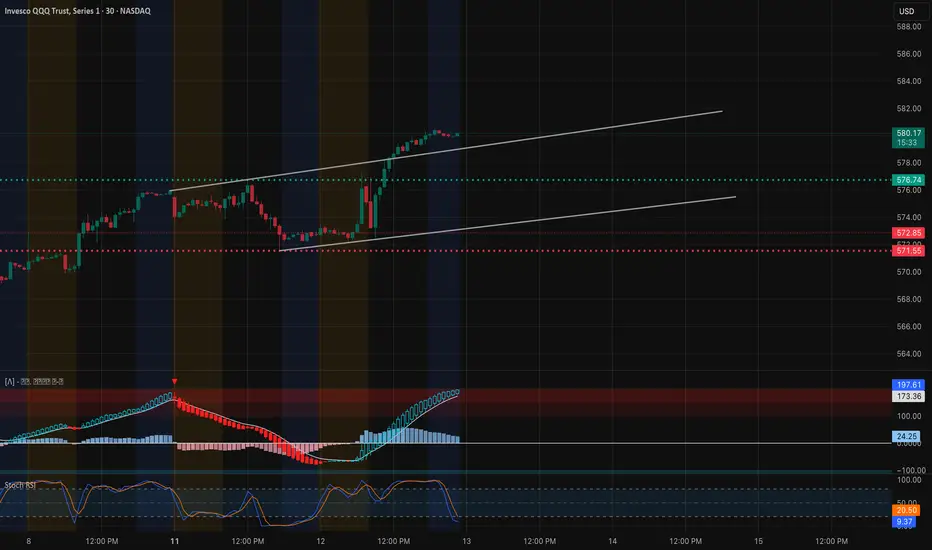
QQQ – TA + GEX Confluence for August 13, 202530-Minute Price Action
QQQ is pushing higher inside a rising channel after breaking through $576.74 support-turned-resistance.
* Resistance: $580.17 – current upper channel limit and intraday high.
* Support: $576.74 – breakout retest level; $572.85–$571.65 – key downside pivot zone.
* Indicators:
* MACD remains strongly bullish, but histogram is showing early signs of slowing momentum.
* Stoch RSI is in oversold territory after a minor pullback, suggesting potential for another push higher if momentum returns.
1-Hour GEX Insights
* Highest Positive NET GEX / Gamma Wall: $580 – aligns with the 30m resistance and current intraday high.
* Call Walls Above: $582 (next gamma level) and $585 (upper extension target).
* Put Support: $572 (first defense) and $565–$567 (major downside gamma floor).
* IVR: 9.8 – low implied volatility rank, keeping long options relatively cheap.
TA + GEX Combined Read
The $580 level is a dual confluence zone — it’s both the 30m upper channel resistance and the highest GEX wall on the 1h chart.
* A breakout above $580 could see quick follow-through toward $582 and possibly $585 if call buying pressure builds.
* Failure to break $580 with conviction could bring a retest of $576.74, with deeper pullback potential to $572 if sellers take control.
Trading Scenarios for August 13
* Bullish Breakout: Long calls or debit spreads above $580 targeting $582–$585.
* Bearish Rejection: Puts or put spreads if $580 rejects and $576.74 fails, targeting $572.
* Range Strategy: If price stays between $576–$580, short premium plays could work given low IVR, but be ready for a breakout.
Reasoning
The 30m rising channel aligns perfectly with the 1h GEX data, showing $580 as the decision point for tomorrow. Breaking above it can trigger gamma-fueled upside, while rejection keeps QQQ range-bound or sends it back to GEX-supported floors.
Disclaimer: This analysis is for educational purposes only and does not constitute financial advice. Always do your own research and manage risk appropriately before trading.
QQQ $600 Macro Tailwinds Needed
Fed Policy
Rate Cut in September — Market is pricing ~93–95% odds; an actual cut plus dovish language would boost valuations.
Soft Landing Narrative — If inflation continues easing without a major growth slowdown, growth stocks could re-rate higher.
Yields
10-Year Treasury back toward 3.8–4.0% — Lower yields reduce discount rates on future tech earnings, historically supportive for QQQ.
Earnings
"Mag 7" beating expectations in Q3 & Q4 — Nvidia, Microsoft, Apple, and Amazon need to deliver both EPS beats and strong guidance, keeping AI momentum intact.
Broad Participation — More than 65–70% of Nasdaq-100 above their 50-day MA would confirm strength beyond a few leaders.
2️⃣ Technical Path
Current Level: ~$573
Immediate Resistance: $577–580 (recent intraday highs)
Sustained closes above $580 with expanding breadth and volume is a breakout trigger
QQQ’s top end from an extended channel projection ~$590–595
Measured move from March–July base (~$520–$560 = $40 range; breakout above $560 projects ~$600)
~61% of QQQ stocks are above their 200d SMA, but only ~48% above 50d SMA
50d (%) above 60–65%
New highs consistently > 8–10% of index components
Risks
Core CPI remains sticky (like the latest 3.1% YoY) which delays Fed cuts
Geopolitical/tariff shocks hitting supply chains or tech exports
Earnings misses from big AI names which reverses sentiment
Yield spike above 4.4% on the 10-year (valuation compression)
Break $580 in late August–September on dovish Fed + solid earnings = $600 by Q4
Fed cuts + AI blowout earnings = $600 by late September.
Core inflation sticky + yields up = stall at $580, retest $550 before YE
