Canopy Getting HammeredCanopy Growth (WEED) is getting absolutely hammered. We're down over 7% this month after crashing over 20% in July. Imo, the stock is going to blow up when the US finally decriminalizes Cannabis. The opportunities for hemp are endless and of course the recreational market for drinks, bud, and all the rest is booming in legal markets. If I see a sub 20's print, I'll start accumulating. We have a solid floor around 12.90...
Trade ideas

Canopy Growth Corporation LONG POSITIONCanopy Growth Corp. engages in the production and sale of medical cannabis.
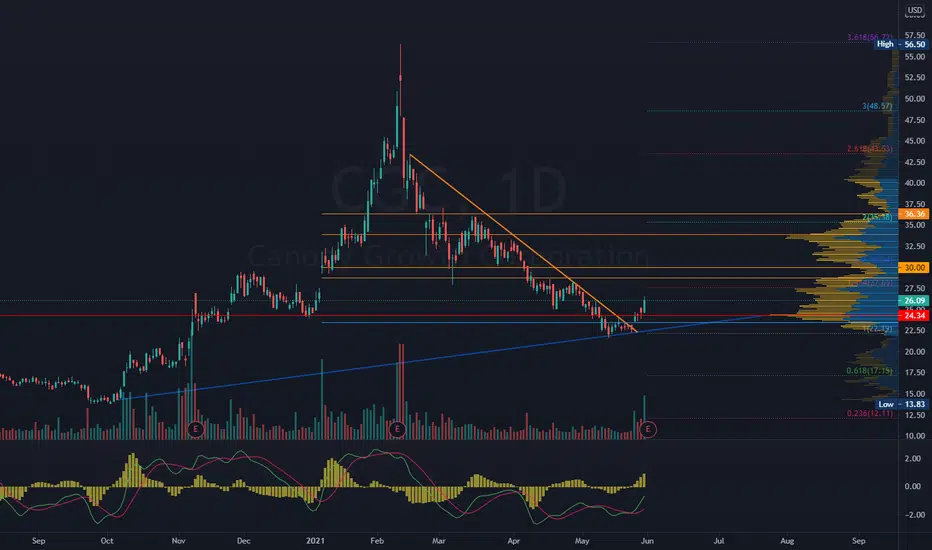
In the recent period, we can observe a descending triangle pattern as well as a downtrend.
Last days, stocks reached the bottom-line of the Keltner channel.
Fibonacci retracement pattern was used to indicate targets.
The RSI shows a bullish divergence.
According to the MACD, we see a bullish confirmation hence the trend should move upwards. Also, the MACD line is located below the zero line, indicating the market is oversold.
Conclusion:
Position: LONG
Entry range: $ 18.04 - $ 19.56
Target range: $ 25.34 - $ 26.68
Stop loss: $ 17.34
NO financial advice

a bull set-up from Stochastic Full indicator.According to the Chart School from Stockcharts.com, a bull set-up from stochastic full is basically the inverse of a bullish divergence . The underlying security forms a lower high, but the Stochastic Oscillator forms a higher high. Even though the stock could not exceed its prior high, the higher high in the Stochastic Oscillator shows strengthening upside momentum. The next decline is then expected to result in a tradable bottom.
Horizontal lines and zones are supports (entry for bulls and exit for bears) and resistances (exits for bulls and entries for bears).
Diagonal lines from Fib fan/channel are for trend-determination and additional levels for active trading.
The market is actively moving so the entries and exits constantly change. Trade small if you want to practice!


assess its risks to capture its volatility into its earningIts earning is in the first week of August.
Trend(OBV) uses True Strength Index to analyze "On-Balance-Volume", which measures buying and selling pressure as a cumulative indicator.
Horizontal lines and zones are supports (entry for bulls and exit for bears) and resistances (exits for bulls and entries for bears).
Diagonal lines from Fib channel/fan are for trend-determination and additional levels for active trading.
The market is actively moving so the entries and exits constantly change. Trade small if you want to practice!

CGC BIAS: UpOverall in bear mode but due to short term buyer volume increase, short term upward movement is expected. Make sure to apply SL and TP.


CGCEarly in its rising wedge. I’d be surprised if it broke down 1/4 way through but anything can happen. Seems to be a third touch of this channel lower rising support… might be worthy long buy zone here….


CGC 1HRBULLISH , GARTLEY STRONG PRZ , Earlier this same Pattern given good reaction on Type1 entry i.e REACTION & Hit TARGETS now price is again in PRZ Zone of Pattern Therefore it becomes a TYPE2 Entry which is REVERSAL
price need to follow Green Trend line & hit target
If price Breaks Red Trend line is where EXIT before SL hits
POTENTIAL BUY

CGC 30MINConfluence of BULLISH Deep Crab & crab strong zone
price need to follow Green Trend line & hit target
If price Breaks Red Trend line is where EXIT before SL hits
POTENTIAL BUY


CGCMID-TERM: Scuffed Bullish gartley with a double bottom at the PCZ , 4hr hidden bullish divergence , right above historical support. (not financial advice)

CGC Weekly PlayPlease excuse the very rough drawing of the Cup and Handle pattern. I used the drawing tool so the candles didn't all fit.
Crossed up on the top half of the Handle, bullish signal.
The daily shows good RSI, with another bullish signal in the future for more buyers whenever it crosses the 200MA.
Been bouncing around this 24.00 support line (noticeable on 1hr chart) for awhile now as well.
I will enter a small swing position (anticipating it to cross up on the 200MA) for the short term while watching for a long term hold confirmation.

CGC Long Looking UpCGC has been expanding like crazy this last year and rode the cannabis sector wave, now trying to decide its FMV. Been on an uptrend but looking out for resistance around 29.5, hoping it holds support at 24.2 if it retraces, and I'll be moving my SL to profit after support is proven.

CGC wants to be king. This weekly chart looks amazing. Hidden bullish divergence with an ascending triangle pattern. We are going to the moon.


Canopy Growth CGC broke the trendline and is now consolidating in a range. Also, the increase in volume and the fact that the MACD is in a positive territory again support the long scenario. The trade can be entered immediately and the stop should be placed under the 50MA at 23$ which also should function as a guideline for the stopmanagement.
But be aware that the CPI data from May will be released on the 10th of June: if they are higher than expected the US10Y will rise which can cause trouble for the growth stocks (no pun intended).

CGC getting hot to $30+Cannibis Sector now getting hot after ahead of some key legalization moves. This stock can hit $30 in the near term
Target-1 $30
Target-2 $36
Stop Loss $22-21
$CGC - Channel- Major - Falling WedgeShort term trade to ATH falling wedge!!
Push Play -- Join the STP community!! Link in description!

$CGC Canopy Growth Potential Trade setup
Hopefully you find the chart helpful in terms of Supports & Resistance etc.
we refrain from adding commentary on the chart as that is reserved for our members and we are very conscious of not giving financial or trading advice.
Thank you for taking time to consult our chart and we would really appreciate a like, follow or comment.
