COIN breaks above $337, gap fill toward $380Gap fills typically refer to price movements that "fill" previous gaps on the chart—often caused by earnings surprises or macro events. Based on historical price action
Note - If COIN breaks above $337 and sustains momentum, gap fill toward $375–380 is plausible in the near term.
1QZ trade ideas

$COIN: Wyckoff Accumulation Pattern 1-hour chartNASDAQ:COIN 1 hour chart shows Wyckoff Accumulation pattern. We are in Phase D. When this Phase is finished, NASDAQ:COIN is going up in Phase E.
PS: preliminary support (Phase A)
SC: selling climax (Phase A)
AR: automatic rally (Phase A)
ST: secondary test (Phase A)
ST.B: secondary test in Phase B
Shakeout: Phase C
LPS: last point of supply (Phase D)
SOS: sign of strength (Phase D)

Valuating Coinbase based on the intrinsic valueAfter revising my discount cash flow model for Coinbase I have concluded the intrinsic value for the stock approximately $310 based on my model. I am a few days late with my analysis but it seems like the market has also come up with a similar number based on the technical analysis of the daily chart. I have began accumulating the stock once again. With a target of $575.

$COIN viction Trade: Weekly Up, Daily Tight
NASDAQ:COIN
Summary
NASDAQ:COIN exhibits a textbook “expand → break → retest → coil” progression. A broad weekly megaphone that developed through 2024 continued into 2025 with a June ’25 breakout; price subsequently reached ~$445 (megaphone resistance) in July ’25 and then retraced in an orderly fashion, holding above 2023’s ceiling. Since that pullback, ranges have narrowed and participation has declined while price consolidates above $280—behavior consistent with constructive acceptance before a potential next leg higher.
Market Structure and Setup
The primary structure is defined on the weekly chart: an expansionary megaphone that retested prior highs. Tactically, the daily chart shows a controlled pullback, retest, and subsequent coil. This multi-timeframe alignment—higher-timeframe trend with lower-timeframe acceptance—creates favorable conditions for measured moves and for risk to be defined against transparent levels rather than discretionary judgment.
Fibonacci-Based Upside Roadmap
Anchoring to the 2024–2025 impulse advances, 1.618 extensions cluster around ~$580 (Sep ’24 → Dec ’24 leg) and ~$650 (Oct ’23 → Mar ’24 leg). These are not short-dated “targets” but conditional waypoints: they remain operative if the current consolidation resolves higher and the weekly uptrend reasserts.
Microstructure: Short Consolidations as Future Magnets
In sustained advances, brief, tight candlestick compressions often function as “price memory,” attracting subsequent retests and liquidity. COIN’s February 2024 bull-flag pause—formed mid-run—has been revisited multiple times since, underscoring how such compressions act as magnets in later price action. The present tight band atop $340–$370 should be viewed in similar context: it is both a potential near-term launchpad and a likely reference zone for future pullbacks as supply and demand re-balance around it.
Execution Plan
Accumulation is favored on constructive behavior within $290–$330 (retest followed by a higher low on the daily). For risk management, tactical invalidation sits below ~$280; for participants keying off weekly structure, a wider ~$250 stop aligns with the higher-timeframe shelf. If momentum resolves first, additional entries are reasonable on a clean break-and-hold above local range highs, using the reclaimed shelf to maintain tight risk. From a successful breakout, staged distribution into ~$580 with reassessment into ~$650 allows the position to self-finance while respecting the possibility of momentum fatigue.
Invalidation Criteria
A daily close back below ~$280 would indicate the near-term reclaim has failed and the base requires more time. A weekly close beneath ~$250 would challenge the integrity of the larger expansionary structure. Either signal warrants standing aside and allowing the chart to reset.
Fundamental Linkages
Coinbase’s revenue remains acutely sensitive to crypto price trends and realized volatility. When BTC/ETH trend and trading activity broadens across spot and derivatives, COIN’s top line typically expands with the cycle. The U.S. regulatory backdrop has moderated relative to the prior year—removing one overhang—yet policy risk persists and can shift rapidly. In effect, the technical setup has a plausible fundamental tailwind when the broader crypto complex trends and trades.
Key Risks
Crypto beta: A broad risk-off in digital assets will likely transmit to COIN regardless of technical posture.
Policy/regulation: Adverse enforcement actions or new rules could impair volumes, product breadth, or take rates.
Competition: A prospective Kraken IPO would arm a major U.S. competitor; Robinhood’s continued crypto build-out pressures economics during quieter tapes.
Operational/security: Exchange businesses carry ongoing operational and cybersecurity risks; incidents can compress multiples abruptly.
Conclusion
The market disclosed intent with the June breakout; current price action is testing sponsorship. Provided COIN continues to accept above $280–$330 and the ongoing coil resolves upward, the $580 → $650 roadmap remains credible. The operative plan is to trade the daily in the direction of the weekly, treat the former resistance shelf as the line in the sand, and require the chart to confirm strength before pressing exposure.
Not financial advice. Just charting things out. Let’s see what happens. Please adapt levels, sizing, and risk controls to your own process and constraints.

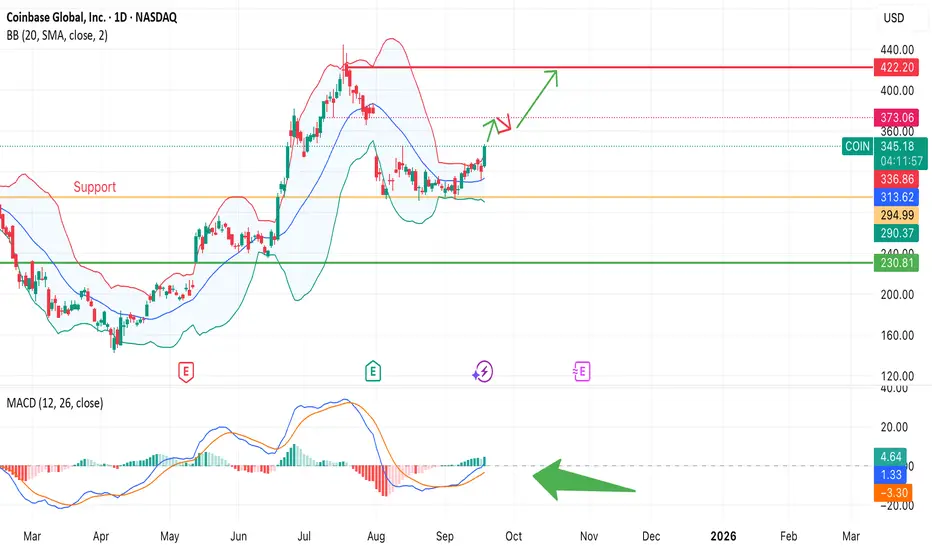
Coinbase – COMEBACK TIME?After the Fed’s 25 bps rate cut, Coinbase NASDAQ:COIN gained strong upward momentum. Lower borrowing costs boosted risk appetite and supported the crypto sector — pushing NASDAQ:COIN higher.
Price has moved above $340 and is heading toward key resistance at $373.
A breakout above $373 opens the path to $422.
Support remains at $313–315, with a deeper level near $295.
MACD shows a bullish crossover, confirming the upside momentum.
Bollinger Bands: price is pushing toward the upper band, signaling renewed strength.
Risks
Profit-taking may appear near $373.
COIN’s move is highly correlated with BTC and overall crypto sentiment.
Coinbase: Breaking HigherAfter an extended period of sideways trading, Coinbase recently broke noticeably higher, prompting us to add a more detailed substructure for magenta wave . On a smaller scale, we now see prices moving in a blue three-part pattern, with wave (a) recently completed at $291.50—a level we identify as support. In the near term, wave (b) still has some room to move higher before wave (c) ultimately dips back below the $291.50 mark, at which point the previously mentioned magenta wave should be complete—well above the lower support level at $138.45. The following wave is expected to drive the next leg higher, potentially pushing the stock well above $444.65. However, we assign a 33% probability that COIN has completed magenta wave alt. at the $444.65 high and could next fall below the $138.45 support to establish a new low for turquoise wave alt.2 via wave alt. .

COIN Daily Cloud BreakCoin is breaking its daily cloud today, also there's a gap to the upside at 376.83 and the daily bands just started to expand.

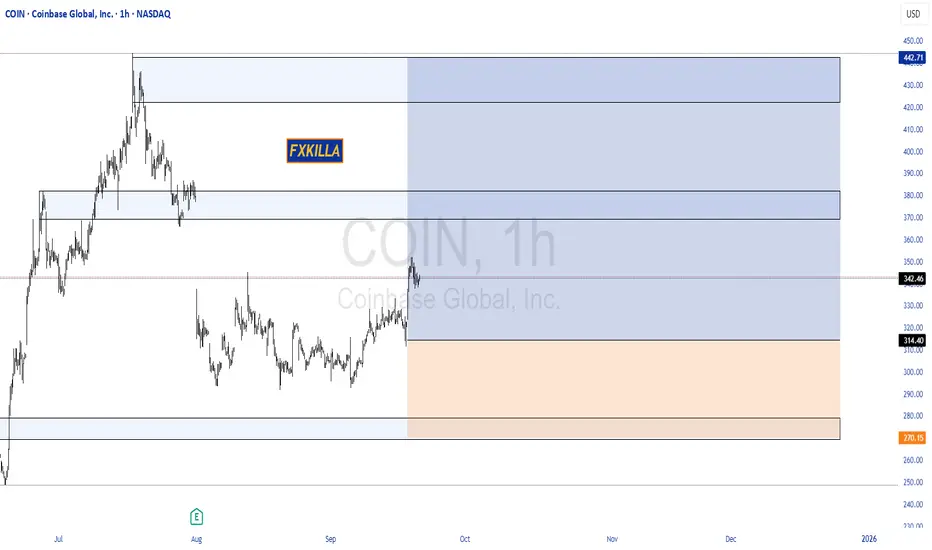
COINBASE HIGH PROBABILITY SETUP SOON!!!🚨 COIN HIGH PROBABILITY BUY SETUP 🚨
* Here We Can See Clearly The Next Potential Move For COIN Coming Hours/Days.
* Keep Your Eyes Close On Your Trading Positions.
* Happy PIP Hunting Traders.
FXKILLA.
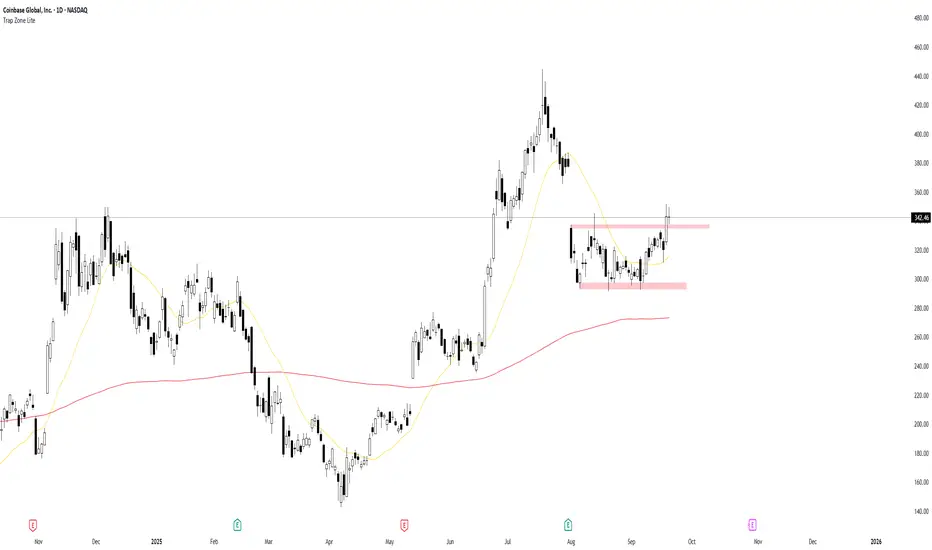
COIN – Breakout Setup With Dual ScenarioTechnical Context:
COIN has been consolidating for several weeks and just broke above the range. The 20-MA has turned upward, confirming a renewed bullish bias. Today’s resting bar after the breakout creates an ideal continuation setup for a long entry.
Primary Trade Plan (Long):
Entry: Buy above the resting bar’s high (confirmation).
Stop Loss: Below the breakout candle’s low.
Target: New high (NH) above the recent swing.
Management: Move SL to breakeven after first push, trail bar-by-bar or by short-term swing lows.
Alternative Scenario (Short):
If price fails violently and breaks back below the breakout level, I would flip short with a target near the base of the consolidation (support zone).
Bias: Bullish while price holds above the breakout zone. Aggressive short only if a strong reversal invalidates the breakout.
COIN - Potential 7th Wave FlushWill be monitoring the price action for COIN.
Thesis, potential 7th Wave flush to the bottom green area to form a local bottom. Will look for Accumulation in the green zone.

Can COIN's $330 Breakout Reach $380? ~ Tactical Entry Plan📈 COINBASE GLOBAL, INC. (COIN) - Money Heist Plan (Swing/Day Trade) 🕵️♂️
🚨 Ready to execute the ultimate heist on COIN? This Money Heist Plan uses the Thief Strategy, a layered limit order approach to catch the breakout at $330.00 ⚡. Below, I've outlined the setup, technicals, fundamentals, and macro insights to help you navigate this trade like a pro. Set your alarms, plan your escape, and let’s dive into the details! 🔒
🛠️ Trade Setup: The Thief Strategy
The Thief Strategy is a tactical approach using multiple limit order layers to enter the trade post-breakout, maximizing flexibility and precision. Here’s how to execute it:
Asset: COINBASE GLOBAL, INC. (COIN) 💰
Entry Trigger: Breakout above $330.00 ⚡
Set a price alert on TradingView to catch the breakout in real-time! 🔔
Layered Entries (Thief Style): Place multiple buy limit orders to scale in:
$310.00
$315.00
$320.00
$325.00
$330.00
Pro Tip: Adjust layers based on your risk tolerance and strategy. Confirm entries only after the breakout at $330.00! ✅
Stop Loss (SL): Place at $295.00 post-breakout 🛑
Note: Adjust SL based on your risk management. The Thief Strategy is flexible—manage risk at your discretion, dear Traders (Thief OGs)! 😎
Take Profit (TP): Target $380.00 🎯
Resistance and overbought levels signal a potential police barricade 🚔. Escape with profits before the trap! Adjust TP based on your strategy.
Disclaimer: TP is not fixed—take profits at your own risk and preference.
📊 Why This Plan? Technical & Fundamental Breakdown
🔍 Technical Analysis: The Thief’s Blueprint
Breakout Catalyst: COIN is testing the $330.00 resistance. A confirmed breakout signals strong bullish momentum 📈.
Thief Strategy Advantage: Layered entries reduce risk of false breakouts and allow scaling into the move.
Key Levels to Watch:
Support: $295.00 (SL zone)
Resistance/Target: $380.00 (overbought zone)
Setup Confirmation: Use volume spikes and RSI for breakout confirmation. Set TradingView alerts to stay sharp! 🔔
📉 Fundamental & Macro Insights
Market Cap: $81.47B
PE Ratio (TTM): 30.52 (above industry avg., signaling high valuation)
EPS (TTM): $10.39
Revenue Growth (YoY): +12.36% (2025 est.) 💪
Profit Margin: 42.67% 🔥
Cash Reserves: $7.54B (strong balance sheet)
Risks:
Q2 profit drop to $33.2M vs. $294.4M YoY 📉
High P/E (30.71) and Price/Sales (12.61) raise valuation concerns
Macro Drivers:
Genius Act: Boosted crypto optimism 🚀
Crypto Market Trends: Bitcoin’s record highs in July 2025 fuel COIN’s upside potential
😰 Fear & Greed Index
Current Sentiment: Neutral to Greedy (Crypto Fear & Greed Index: 0-100)
Trend: Mixed emotions due to crypto volatility and regulatory developments
Takeaway: Greed supports breakout potential, but stay cautious of volatility spikes.
🧠 Investor Sentiment
Retail Traders: Cautiously optimistic 😊, holding for long-term crypto growth but cautious of short-term volatility.
Institutional Traders: Mixed 🤔—some see overvaluation, others bet on crypto adoption and regulatory clarity.
🐂 Bullish vs. Bearish Outlook
Bullish Score: 60% 🐂
Why? Strong revenue growth (+13.72% YoY est. for 2026), crypto adoption, and institutional interest.
Bearish Risks: 40% 🐻
Why? Profit volatility, high valuation, and crypto market dependence.
Key Watch: Q3 earnings (Sep 2025) and crypto market trends.
💡 Why Trade COIN Now?
Short-Term: Neutral to slightly bearish due to profit concerns, but the $330.00 breakout could spark a quick swing/day trade.
Long-Term: Bullish on COIN’s role in crypto infrastructure and regulatory tailwinds.
Thief Strategy Edge: Layered entries and disciplined risk management make this setup ideal for volatile markets.
🔗 Related Pairs to Watch (USD)
BITSTAMP:BTCUSD : Bitcoin’s momentum drives COIN’s price action.
BITSTAMP:ETHUSD : Ethereum’s performance impacts COIN’s trading volume.
BITSTAMP:XRPUSD : Watch for altcoin rallies tied to regulatory news.
AMEX:SPY : Broader market trends influence COIN’s beta (3.69).
📅 Market Data Snapshot (10 Sep 2025)
Previous Close: $318.78
Day’s Range: $315.88 - $328.67
52-Week Range: $142.58 - $444.65
Avg. Volume: 13.43M shares
✨ “If you find value in my analysis, a 👍 and 🚀 boost is much appreciated — it helps me share more setups with the community!”
#TradingView #COIN #SwingTrading #DayTrading #CryptoTrading #TechnicalAnalysis #ThiefStrategy #MoneyHeist

COIN Ready for Gap Fill?NASDAQ:COIN Coinbase looks ready for move up to at least fill the gap at $359 if not make new all time highs.
Daily RSI printed bullish divergence and price broke out yesterday into bullish market structure. A break above the High Volume Node resistance could see new all time highs sooner than expected!
Analysis is invalidated if we drop below the swing low and that will continue my previous analysis downwards with a target of the ascending 200EMA, High Volume Node support, S1 Pivot at $282.
Safe trading

COIN LongReasoning:
Triple bottom
Recovery near rising 30 Week MA
Crypto stocks like NASDAQ:HUT NASDAQ:CIFR are recovering
Swing Traders (2-6 Week Holds)
Entry: Full position on breakout
Profit Taking: Sell 1/3 at Goal 1
Final Exit: Remainder at Goal 2

COIN Trade Setup – Strong R/R at Macro Support ZoneIn our previous trade idea, NASDAQ:COIN surged over 120%, confirming the bullish setup we highlighted. We're now watching a key support zone that offers another high-probability entry with excellent risk-to-reward.
📉 Gap Still In Play
The recent gap-down in price is unfilled, and statistically, such gaps tend to retrace at least 50%. This area also aligns with the golden pocket (Fibonacci 0.618–0.65) — a zone known for sharp reversals and trend continuations.
📈 Trade Levels
Entry Zone: $250–$260
Take Profits: $360 / $420
Stop Loss: Below $225
Bias: Bullish bounce from support, targeting range high flip
🔍 Watch For:
Volume confirmation at support
RSI / Momentum divergence near golden pocket
Break and hold above range high = expansion
This zone offers a low-risk entry before potential continuation of the macro uptrend.

COIN 1D Time frameMarket Snapshot
Current Price: ~$318.78
Daily Change: +5.5% (strong upward move)
🔎 Technical Indicators
RSI (14-day): ~71 → Overbought zone, signals caution.
MACD: Positive and rising → Strong bullish momentum.
Stochastic Oscillator: High → Overbought conditions, risk of short-term pullback.
ADX: ~16 → Weak trend strength despite recent move.
📈 Moving Averages
5-day MA: ~$315 → Bullish
50-day MA: ~$305 → Bullish
200-day MA: ~$314 → Bullish
All three show buy signals, confirming trend strength.
🔧 Support & Resistance
Support Levels: ~$315, ~$313, ~$311
Resistance Levels: ~$319, ~$321, ~$330
📅 Outlook
Bullish Case: If COIN sustains above ~$319, it could push toward $330 or higher.
Bearish Case: With RSI in overbought territory, a pullback toward ~$315–311 is possible.
Overall Bias: Moderately bullish, but vulnerable to short-term profit-taking.

COIN 3Hour Time frame📊 COIN 3-Hour Snapshot
Current Price: $318.78
Change: +5.49% from the previous close
Intraday Range: Not specified
Market Cap: Approximately $83.3 billion
P/E Ratio: Not specified
Beta: 2.89
🔎 Key Levels
Resistance:
R1: $318.78 (recent high)
R2: $330.00 (next resistance zone)
Support:
S1: $310.00 (immediate support)
S2: $300.00 (next support level)
📈 Technical Indicators
RSI (14): Not specified
MACD: Not specified
Moving Averages:
5-period SMA: Not specified
50-period SMA: Not specified
200-period SMA: Not specified
📌 Market Sentiment
Catalysts: Positive momentum following recent gains and analyst upgrades.
Sector Performance: Cryptocurrency market showing strength, with Coinbase leading gains among peers.
Options Activity: Significant trading in call options at $318.78 strike price, indicating bullish sentiment.
📅 Outlook
Bullish Scenario: A breakout above $318.78 could lead to a push toward $330.00 and higher.
Bearish Scenario: A drop below $310.00 may test support around $300.00.
Overall Bias: Moderately bullish, with positive momentum but facing near-term resistance.

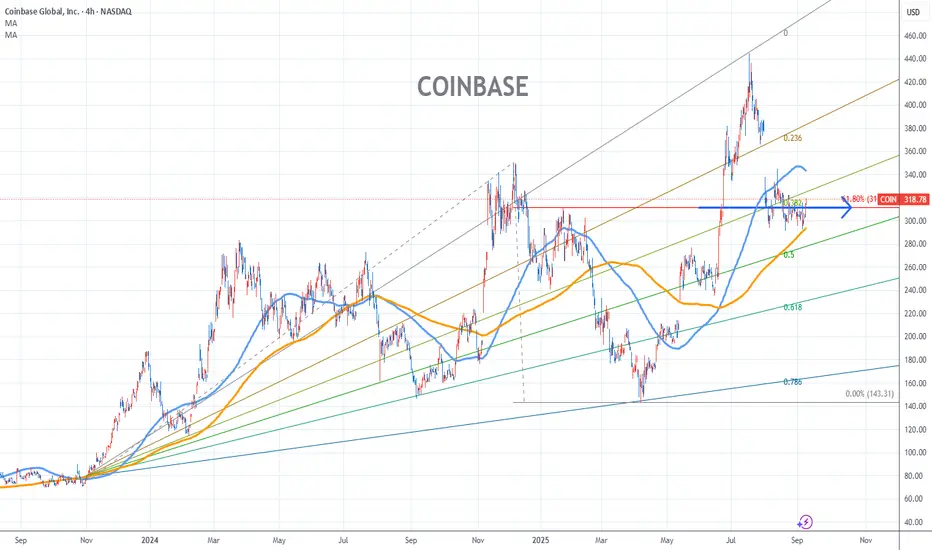
Coinbase Stock Chart Fibonacci Analysis 090925Trading Idea
1) Find a FIBO slingshot
2) Check FIBO 61.80% level
3) Entry Point > 310/61.80%
Chart time frame:B
A) 15 min(1W-3M)
B) 1 hr(3M-6M)
C) 4 hr(6M-1year)
D) 1 day(1-3years)
Stock progress:A
A) Keep rising over 61.80% resistance
B) 61.80% resistance
C) 61.80% support
D) Hit the bottom
E) Hit the top
Stocks rise as they rise from support and fall from resistance. Our goal is to find a low support point and enter. It can be referred to as buying at the pullback point. The pullback point can be found with a Fibonacci extension of 61.80%. This is a step to find an entry-level position. 1) Find a triangle (Fibonacci Speed Fan Line) that connects the high (resistance) and low (support) points of the stock in progress, where it is continuously expressed as a Slingshot, 2) and create a Fibonacci extension level for the first rising wave from the start point of the slingshot pattern.
When the current price goes over the 61.80% level, that can be a good entry point, especially if the SMA 100 and 200 curves are gathered together at 61.80%, it is a very good entry point.
As a great help, TradingView provides these Fibonacci speed fan lines and extension levels with ease. So if you use the Fibonacci fan line, the extension level, and the SMA 100/200 curve well, you can find an entry point for the stock market. At least you have to enter at this low point to avoid trading failure, and if you are skilled at entering this low point, with the fibonacci6180 technique, your reading skill of to chart will be greatly improved.
If you want to do day trading, please set the time frame to 5 minutes or 15 minutes, and you will see many of the low points of rising stocks.
If you prefer long-term range trading, you can set the time frame to 1 hr or 1 day
LONG COINBASE- 3x Your money In a YearPrice Target
450$
Time Frame : 1 Year from now on
Disclaimer : Nothing is a financial advice

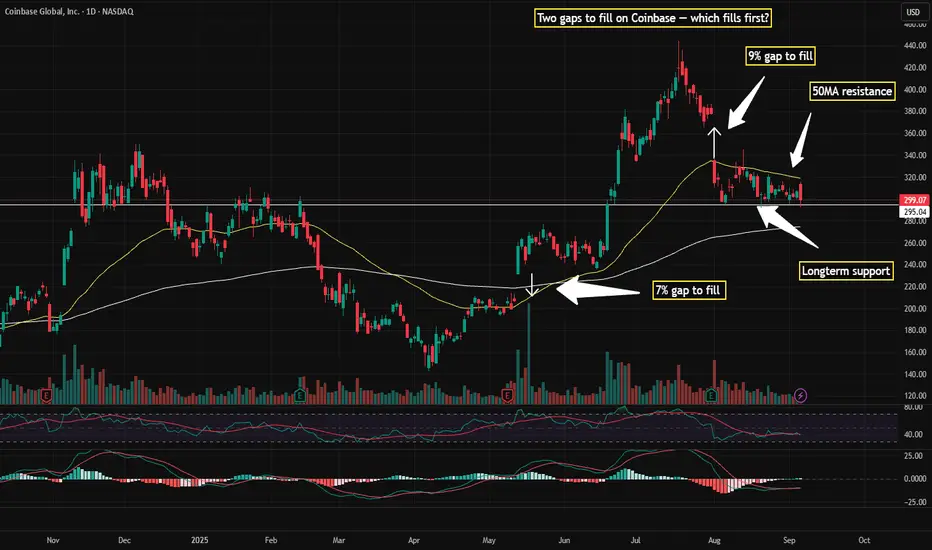
Coinbase $COIN has two gaps to fill — which first? Coinbase NASDAQ:COIN has two gaps to fill — which first? 🚀
9% gap above at 50MA resistance
7% gap below near long-term support
Volume and price action will show the next move. Break above 50MA signals bullish fill; drop to support could mean bounce. RSI neutral, momentum key.
COIN HIGH PROBABILITY SETUP SOON!!!🚨 COIN HIGH PROBABILITY BUY SETUP 🚨
* Here We Can See Clearly The Next Potential Move For COIN Coming Hours/Days.
* Keep Your Eyes Close On Your Trading Positions.
* Happy PIP Hunting Traders.
£ FXKILLA £

COIN - Are we aligned with BTC/ETH? READY, SET, GO?🕰 Monthly View
Large bullish expansion from demand, with swing structure respected.
Pullback currently rejecting around the 0.618 retracement level.
As long as price holds above the strong support zone near 260–275, bias remains bullish for continuation.
Longer-term targets sit around 400+, with potential re-test of the all-time swing highs later.
📆 Weekly View
Weekly structure shows BOS (break of structure) after expansion.
Price has pulled back into weekly demand (≈275).
Liquidity above 360–380 remains uncollected, suggesting upside targets.
Re-test of supply/liquidity resistance trend likely before continuation higher.
📅 Daily View
Current price hovering around 304 key psychological level (POI).
Retesting breakout zone after liquidity sweep.
Demand alignment (280–300 zone) is crucial: bullish confirmation here opens room for targets at 386–400.
Invalidation if we close below 200 demand zone.
⏱ 4H View
Lower timeframe shows consolidation just above daily demand.
A range return setup is forming, with liquidity built for a possible expansion.
If bulls step in here, expect a sharp impulse move back toward 340–360 short-term.
🎯 Bias & Trade Plan
Bias: Bullish continuation (after retest)
Entry Zone: 280–305 (Daily/Weekly Demand)
Targets:
Short-term → 340–360
Mid-term → 386–400
Invalidation: Break and close below 200
⚠️ Risk Note
COIN tends to move with crypto sentiment (BTC/ETH correlation). Strong volatility expected around psychological levels – wait for rejection/confirmation before entry.

$COIN Local Chart, Still WaitiingNASDAQ:COIN Coinbase is still resetting towards the target of $275 quadruple support - High Volume Node, ascending 200EMA, 0.5 Fibonacci retracement & S2 pivot point.
Daily RSI is setting up with bullish divergence at the moment near oversold.
There is a gap that never filled at the golden pocket ~$217 so this would be the secondary target if we get a deeper sell off.
Safe trading.

COIN Don’t Miss Out: eye-catching$330C
# 🚀 COIN Options Alert 🚀
🎯 **Setup**: Long \$330C
💵 **Entry**: \$6.35 | 📈 **Target**: \$9.53 (+50%) | 🛑 **Stop**: \$3.81
📊 **Confidence**: 60% | ⚡ Low VIX + Bullish Flow | ❗ Weak volume risk
💡 **Key Watch Levels**:
* 🔑 \$325 breakout = strong bullish confirmation
* ⚠️ Below \$291 = bearish trigger zone
⏰ Time-sensitive: 4DTE — manage risk, avoid holding into Friday’s close!
---
📌 **Hashtags **:
\#COIN #CryptoStocks #OptionsTrading #WeeklyOptions #TradingSignals #StocksToWatch #OptionsFlow #CallOptions #TradingView #StockMarket #COINbase #OptionsAlerts
