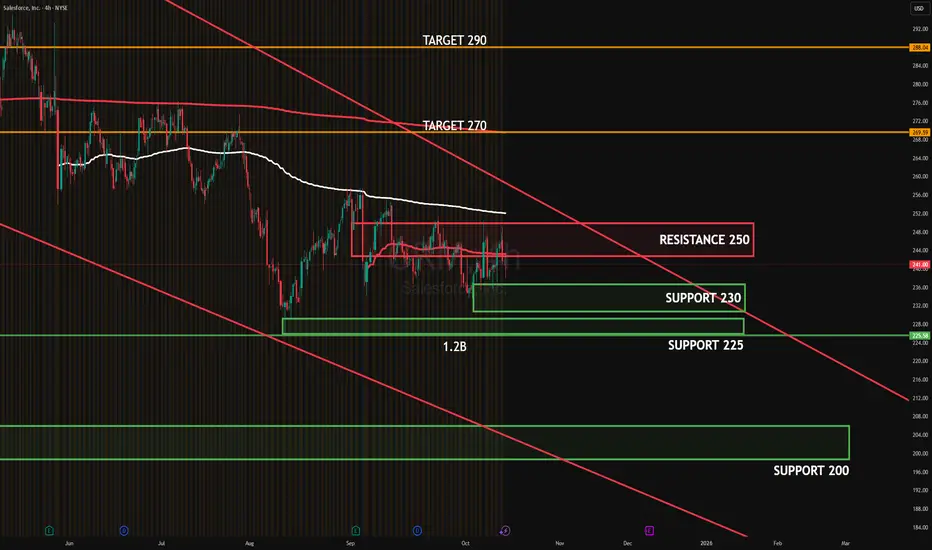
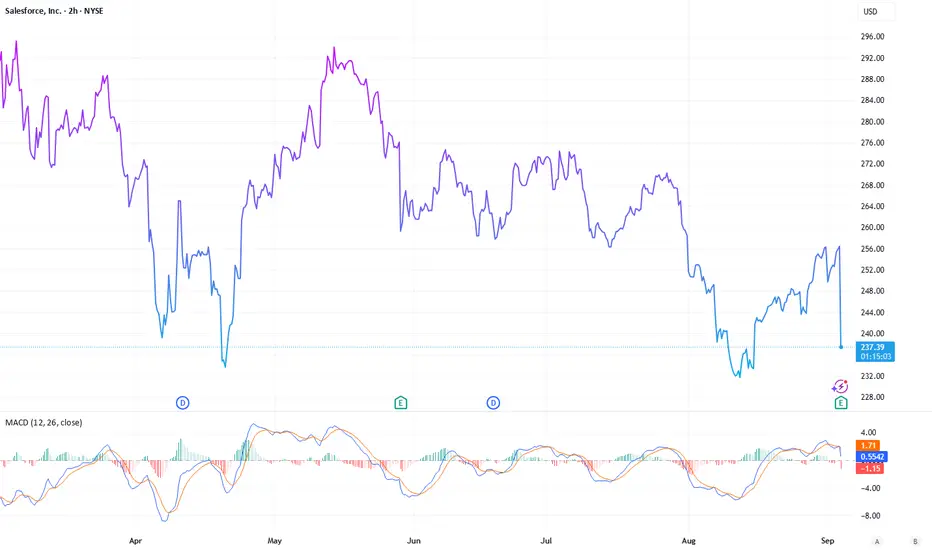
CRM OCT 2025CRM 4H: Price remains capped by 246–250 supply under the descending trendline, while buyers continue to defend 230–225 demand. The 230 test showed notable absorption (~1.2B), suggesting that institutions supported the dip; however, until 250 is reclaimed, that area acts as a distribution point.
Targets
Upside: 250 (range high). If accepted above, 290 (swing target).
Downside: 230 (first support). If lost, 225 (secondary support).
#CRM #globaltrade #investment #investing #stockmarket #wealth #realestate #markets #economy #finance #money #forex #trading #price #business #currency #blockchain #crypto #cryptocurrency #airdrop #btc #ethereum #ico #altcoin #cryptonews #Bitcoin #ipo
Trade ideas
CRM – Daily Chart | Holding Key Demand Zone Before Possible Reve⚙️ Key Levels
Zone Level Description
🔴 Major Resistance (Retail Zone) 367.09 Prior structural peak and key distribution area. Any rally back toward this level may face heavy selling pressure.
🟣 Extended Target Zone 451.81 Long-term Fibonacci extension level; full recovery point if momentum re-enters Stage-2 markup.
🟢 Active Support Range (Wholesale Zone) 240.49 – 230.00 Current demand area holding firm; repeated rejections from this zone indicate accumulation. Watch for bullish divergence confirmation.
📈 Chart Structure Notes
Price remains in Stage 1 accumulation, consolidating near prior cycle lows.
A daily close above $250–255 could confirm a breakout attempt toward $282–$314.
Breakdown below $230 opens risk to deeper continuation into the $200–$210 range.

Salesforce Reinvents Itself with AI and Projects Over $60BSalesforce Reinvents Itself with AI and Projects Over $60B by 2030
By Ion Jauregui – Analyst at ActivTrades
Salesforce (NYSE:CRM) has staged a true comeback in 2025, following the announcement of its ambitious forecast to surpass $60 billion in revenue by 2030. The global leader in CRM software has doubled down on artificial intelligence (AI) and advanced analytics, positioning itself as one of the most resilient technological pillars in the U.S. market.
Informatica and the Shift Toward Smart Data
One of the most talked-about moves of the year was Salesforce’s $8 billion acquisition of Informatica — a strategic operation that strengthens its data integration and management business. This acquisition will enable the company to merge its CRM ecosystem with advanced analytics and generative AI tools, creating more efficient integration across enterprise cloud solutions.
AI Serving Business Needs
Salesforce has signed key partnerships with OpenAI and Anthropic to enhance the capabilities of its Einstein AI platform. The goal is to provide companies with smarter tools to automate processes, personalize customer service, and improve decision-making. In addition, the company has announced a $15 billion investment in San Francisco aimed at expanding its AI infrastructure and technology development centers, reinforcing its role as a major innovation engine on the West Coast.
Share Buyback and Confidence in the Future
The $7 billion share buyback plan approved by the board reflects Salesforce’s confidence in its long-term outlook. The measure seeks to optimize shareholder value and stabilize the stock after a year of significant volatility in the tech sector.
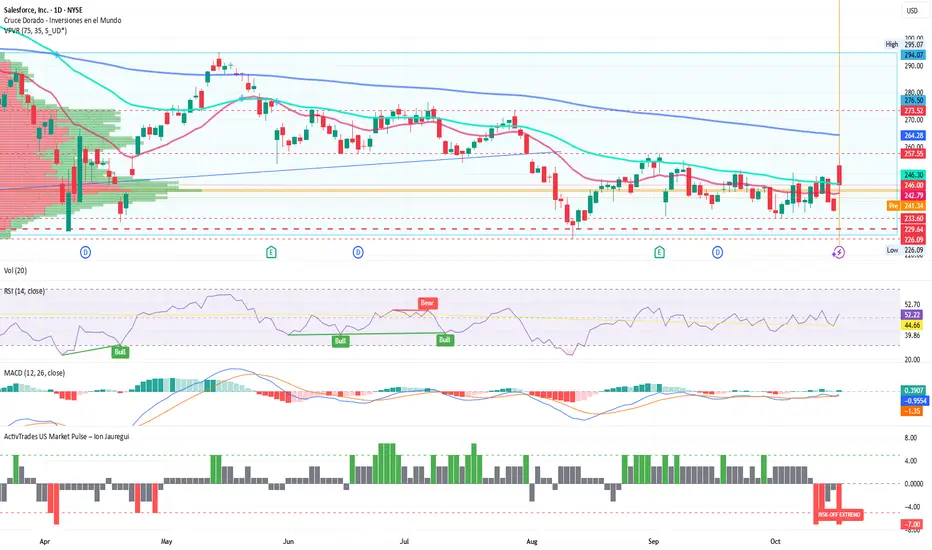
Technical Outlook: Consolidation with a Bullish Bias
Salesforce shares closed yesterday at $240, following a steady recovery from August lows of $226. On the technical side, the stock maintains a solid sideways trend, with support at $233.60 and a current point of control (POC) near $244. Resistance was tested yesterday at $257.55; if that level is broken in the coming sessions, we could see a move toward the $273.52 zone, last seen in July.
The RSI remains around 52.22%, indicating neutrality, while the MACD is positioned below a positive histogram. The bearish moving average crossover initiated in late May remains in place, although the current price holds above the 100-day average, suggesting that bullish pressure could increase in the coming sessions. According to the ActivTrades US Market Pulse indicator, an extreme risk-on environment has dominated U.S. markets throughout the week — reflected in the strong appetite for tech stocks like Salesforce, driven by confidence in AI and the sector’s expansion.
Leader of the Future
Salesforce has shown that its reinvention goes far beyond AI rhetoric: it combines corporate strategy, technological innovation, and investor confidence within an extreme risk-on backdrop on Wall Street. With key acquisitions, strategic alliances, and a solid financial foundation, the company is not only positioning itself to lead the next era of enterprise software but also to become one of the driving forces behind U.S. technological growth heading into 2030.
*******************************************************************************************
The information provided does not constitute investment research. The material has not been prepared in accordance with the legal requirements designed to promote the independence of investment research and such should be considered a marketing communication.
All information has been prepared by ActivTrades ("AT"). The information does not contain a record of AT's prices, or an offer of or solicitation for a transaction in any financial instrument. No representation or warranty is given as to the accuracy or completeness of this information.
Any material provided does not have regard to the specific investment objective and financial situation of any person who may receive it. Past performance and forecasting are not a synonym of a reliable indicator of future performance. AT provides an execution-only service. Consequently, any person acting on the information provided does so at their own risk. Political risk is unpredictable. Central bank actions can vary. Platform tools do not guarantee success.
CRM STOCK ANALYSIS Market Risk
Stock prices can fluctuate due to overall market movements caused by economic changes, political events, interest rate adjustments, or global crises. Even strong companies can lose value during market downturns.
Company-Specific Risk
The performance of an individual company can affect its stock price. Poor management decisions, declining sales, increased competition, or scandals can lead to losses.
CRM Is A Buy Hello,
CRM is running in an ending diagonal, as last phase of correction.
Targets:
1) $300
2) $330
3) $370

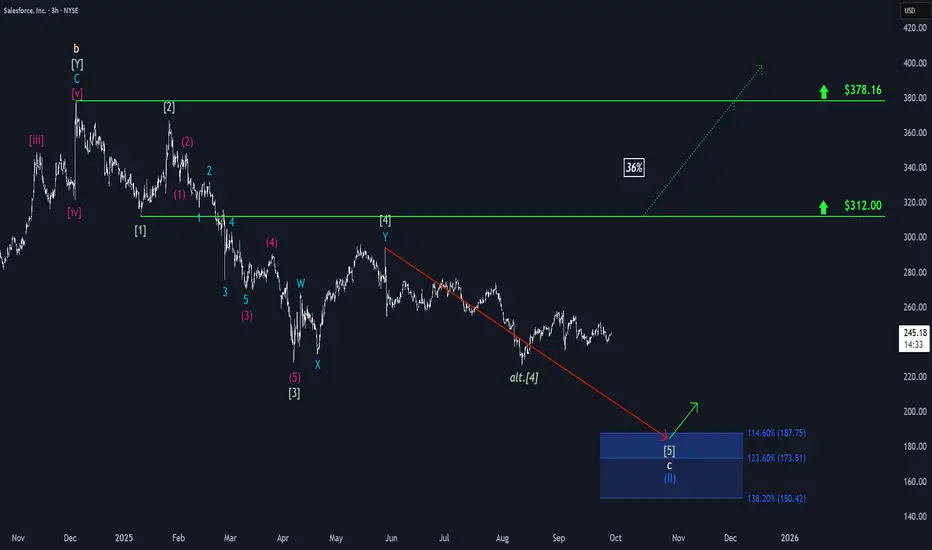
Salesforce: Trading SidewaysSalesforce has struggled to gain clear momentum in either direction over the past two weeks, which has resulted in mostly sideways trading. Looking ahead, we continue to anticipate renewed downward pressure in the near term, which could push the stock into our blue Target Zone between $187.75 and $150.42, thereby completing the broader correction of blue wave (II). After this move, we expect a new upward trend to emerge, which makes the blue zone an attractive entry point for long positions. For risk management, a stop can be placed 1% below the lower boundary of the zone. However, there remains a 36% chance that CRM will not reach our Target Zone and instead will break out directly above resistance at $312, potentially surpassing the higher $378.16 level as well. In that scenario, we would place the stock in a broader (green) upward impulse.
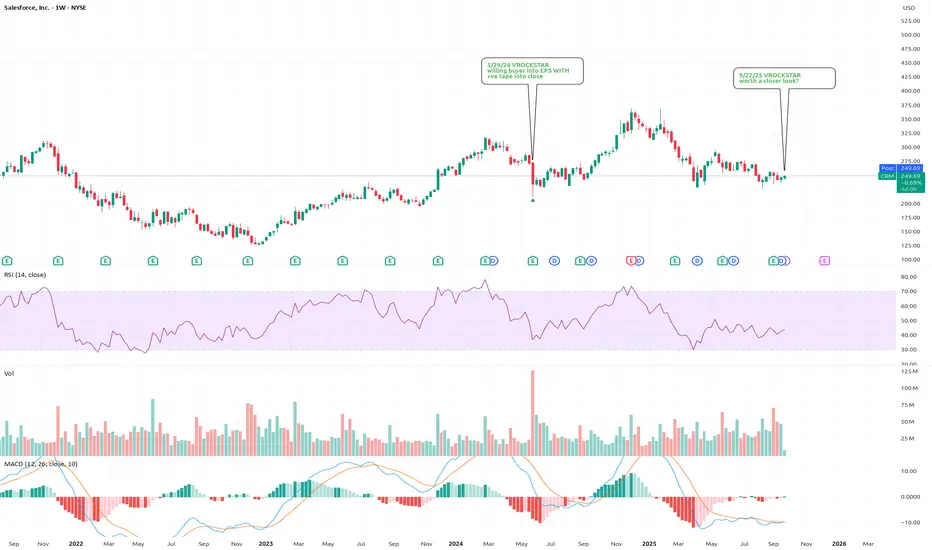
9/22/25 - $crm - worth a closer look?9/22/25 :: VROCKSTAR :: NYSE:CRM
worth a closer look?
- seems like the market wants the mega caps and the micro memes, but nothing in between
- that's what brought me back to NYSE:FI in the last few days (it's about a 20% position or 8% leveraged 2.5-1 on a series of jan '28 ITM leaps)
- now i'm looking at CRM and saying, let's have a look
- anything that's doing >6% fcf (this is even closer to 6.5%) and growing MSD nevermind HSD like this one should get another look
- i get the sense fund mgrs r being "forced" to index toward higher mcap factor and ignore these, despite what actives would prefer
- and you get a really nice setup potentially into YE where one of two things happens (let's use $fi/ NYSE:CRM as similar types - $100 bn one $230 bn other).
a. mkt continues to bleed/ eschew these to chase mag7 performance and in which case you get an easy '26 play esp at end of year into 1H26 as rotation out of megas will inevitably mean they perform weaker and you get a reverse of this momentum
b. these caps actually get a bid - which is my suspicion - as you get highly liquid mega caps that might drip 5-10% at most (we'll get a few bumps along the road - and the longer we go without these... the higher these "alts" that r 100-300bn will run) and if we do take a sneeze, we'll get a nice dip buy entry again, for YE play.
- i do think all roads lead higher here
- and while "AI" might be an issue, sure - for names like NYSE:FI and NYSE:CRM , these co's have serious initiatives that r already showing fruit and i think dominant platforms w HSD momentum in a weak macro (ex-B2B pure-AI) is pretty high quality and gives u booster re-ratings when we do eventually get more substantial cuts. remember - these cuts won't help NVDA as much as they help customers for $fi... $crm... types. and that's where you go from 8-9% growth for both of these toward 15+% and they'll re-rate toward 4-5% fcf yield and stock will be 50% higher.
V
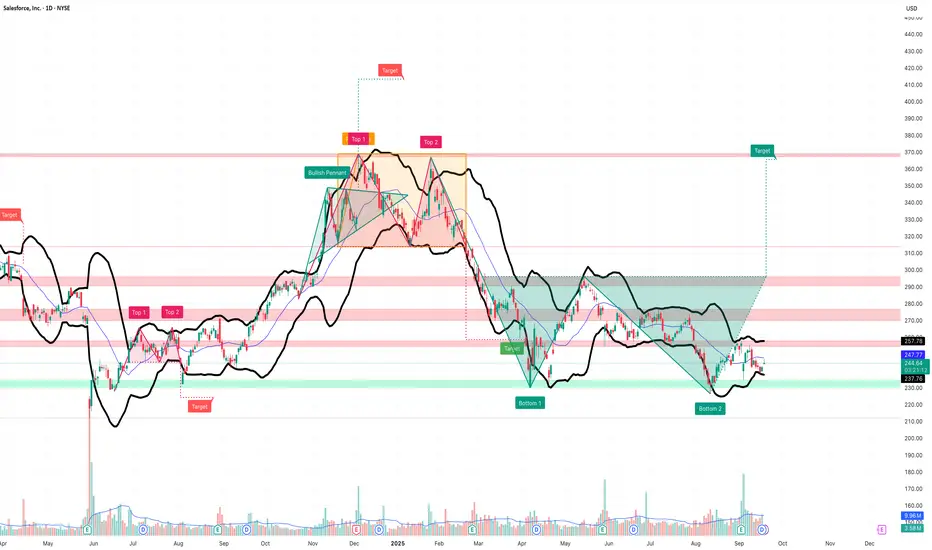
Bullish Strategy on Salesforce (CRM)
Bullish Strategy on Salesforce (CRM)
Looking at the daily chart of CRM, several technical signals support a medium-term bullish outlook:
Double Bottom Pattern
A clear double bottom (Bottom 1 and Bottom 2) has formed between April and September.
This classic reversal pattern often signals the end of a downtrend and the start of a new bullish phase.
Falling Channel Breakout
After months of correction, price broke out of the descending channel, showing technical strength.
Projected Target
The double bottom projection suggests a potential upside toward 370 USD.
First key resistance lies at the 265–270 USD area, also aligned with a strong volume zone.
Supporting Indicators
Bollinger Bands: price is moving near the lower band, often a sign of a possible rebound.
Volumes: spikes observed around the bottoms, typical of accumulation phases.
🎯 Trading Plan
Entry zone: 240–247 USD (current consolidation).
First target: 270 USD.
Second target: 370 USD (pattern projection).
Stop-loss: below 227–230 USD (a breakdown would invalidate the setup).
👉 In summary: the technical setup shows accumulation signals and a potential reversal, offering a favorable risk/reward ratio for a bullish strategy.
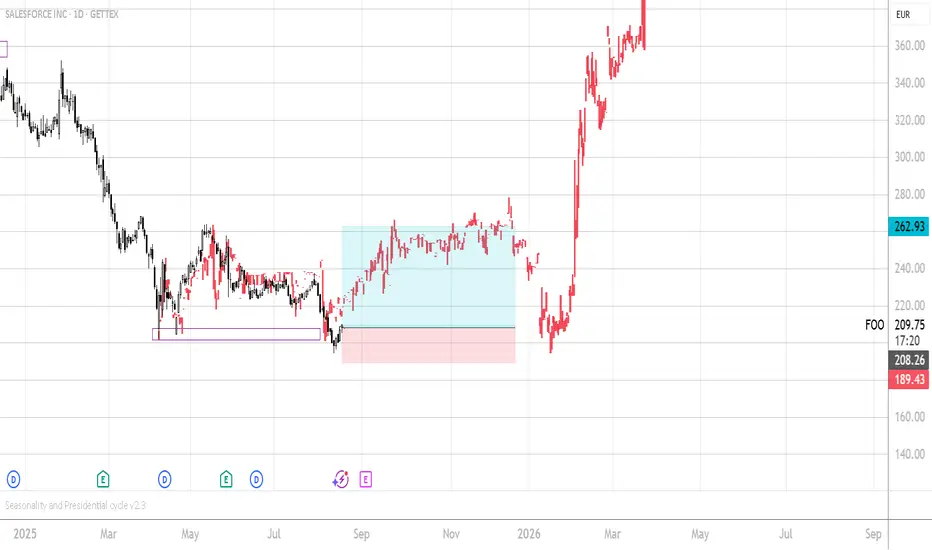
CRM / SALESFORCE / Fractal inspired trade LONGFrom my nooby fractal understanding we have made a low and should head to some 13% gain.
From my seasonality understanding we are expecting some same upmove until the end of the year.
There was an insider buy (spotted via openinsider website) which gives more support to the general bullish feeling.
Risk to reward for the trade is not bad a all considering the confluence for a bullihs view.
CRM is in general a stock to have on watchlist or in a longerterm portfolio, so the stopploss could even be bigger or ignored, depneding on your investment horizon.
(this is not financial advice, trade at your own risk of course....)

$CRM: The Bulls Seize ControlPrice has decisively broken above the $250 resistance level and the falling 20-period moving average. This is a clear Change of Character (CHoCH); confirms that the August low was a successful Spring or Selling Climax, ending the prior downtrend.
The market has completed its bottoming process (Phase C) and is now entering Phase D, the markup phase. The initial Sign of Strength (SOS) was the higher low, and this breakout is the confirmation.
The path of least resistance is now clearly up. The bears have lost control, and demand is now in charge.
CRM - Salesforce - Earnings Beat, Shares Down? $286 Retest?We're currently watching the last stages down into this Ascending Wedge as we approach a very key and important load-up zone at the $227s. Looking for consolidation, bounce out wedge back north to retest those $287s.
CRM reported an earnings beat, guidance lower for Q3 than Street expects, but ultimately has been beatened down by the Rise of AI and it's incrouchment on Software Business Models with the Likes of a Customizable CRM. Their challenge will be continuing to leverage their Einstein AI which has brought a revolutionary approach to the CRM space in itself.

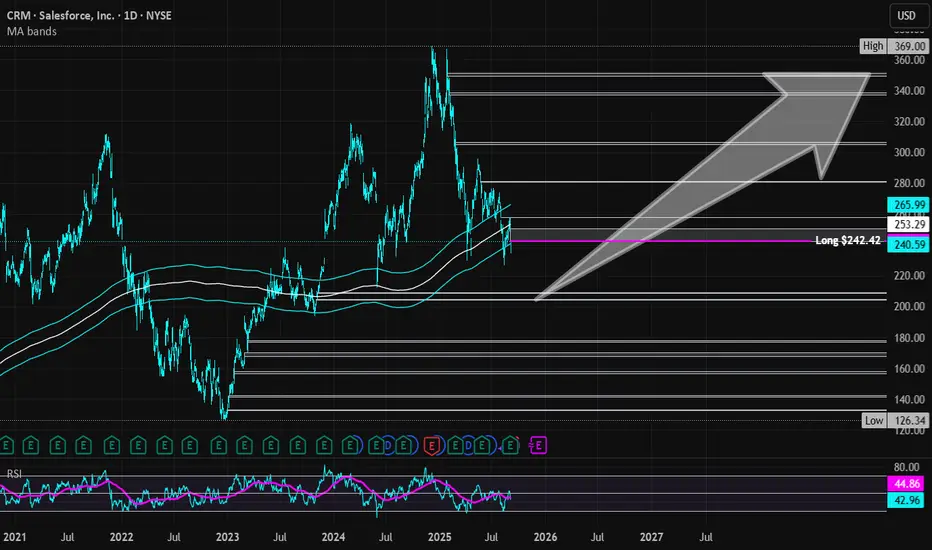
Salesforce | CRM | Long at $242.42Salesforce NYSE:CRM : firing their workforce... migrating toward an AI-driven Agentforce platform, instating a $20 billion increase to its share buyback program (now totaling $50 billion), and strong growth in regions like the UK, France, Canada, and Asia Pacific (particularly among small and medium businesses). The CEO recently declared significant productivity gains (e.g., 30% in engineering) through digital labor and expressed optimism about supporting U.S. government efficiency with Agentforce.
What's good for business isn't necessarily good for the common people. Welcome to AI, folks!
It looks like NYSE:CRM is moving toward a future of full AI. Even if revenue dips due to a slowing economy, I except earnings to soar higher and higher by dropping the humans from the payroll...
Thus, at $242.42, NYSE:CRM is in a personal buy zone as it bounces within my historical simple moving average band. Near-term, I think the price may dip into the low $200's if the US economy continues to show signs of weakening. But AI is only going to boost returns... fortunately for investors, but unfortunately for the workforce...
Targets into 2028:
$306.00 (+26.2%)
$350.00 (+44.3%)
Salesforce's $237 and it's Growth CaseI’ll address a topic that might have warranted attention a few years back, during its peak relevance. This concerns firms offering cloud-based software and tools designed for management purposes. The renewed focus stems from a growing interest in examining companies with clear upward trajectories, particularly within the high-tech sector.
Let’s begin with Salesforce $NYSE:CRM. First, a quick summary of its operations: Salesforce serves as the leading entity for customer relationship management systems, delivering pre-built platforms that enable businesses to establish client profiles, manage databases, and handle customer interactions comprehensively. Essentially, it operates as a business-to-business entity.
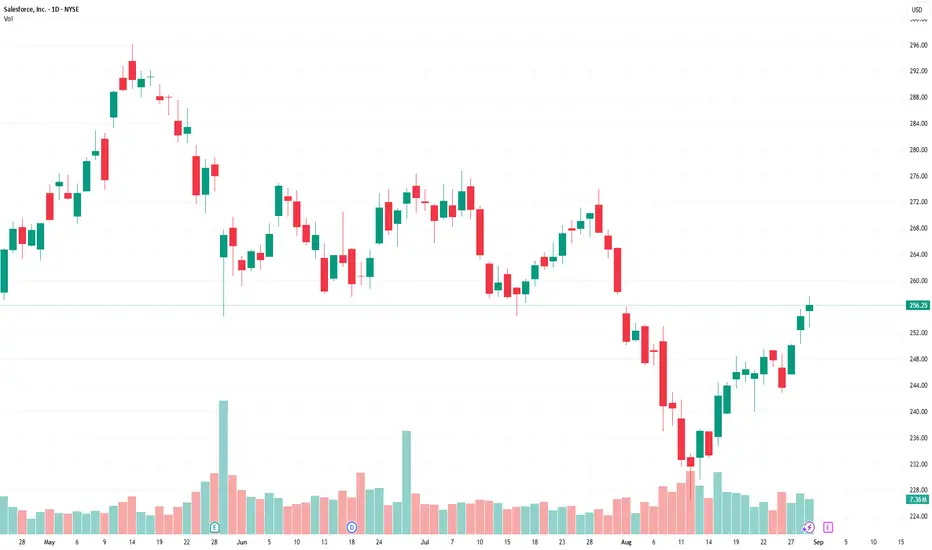
Currently, among 54 analysts tracked by major global banks, 42 classify Salesforce stock as a “buy” or “strong buy,” with 10 suggesting a “hold.” In August, the stock dropped to $226 but has since rebounded to approximately $237. The early-month downturn has largely reversed, with the stock forming a triple top pattern, potentially indicating a continued upward movement.
Now, let’s compare Salesforce with its rivals, HubSpot NYSE:HUBS and Monday.com NASDAQ:MNDY . A key metric for stock buyers is the price-to-earnings (P/E) ratio. HubSpot lacks a traditional P/E due to unprofitability, so we turn to Forward P/E: HubSpot at 40, Monday at 38, and Salesforce at 19. Such a big gap—roughly half that of its peers—offers a pretty positive outlook. Salesforce also features in the Dow Jones and S&P indices, unlike its smaller, less stable competitors, enhancing its reliability.
The price charts of all three companies show similarities since around 2022. However, Monday.com and HubSpot exhibit bigger volatility than Salesforce. Unlike them, Salesforce reached new highs late last year and early this year. Its growth trend dates back to its IPO in June 2004. Among these direct competitors, Salesforce stands out. For those considering a stock in software development, especially with Data Cloud and AI integration—highly relevant trends—I suggest Salesforce. The current market conditions appear favorable for purchasing these shares.
CRM Earnings BEAR PLAY--$235 Put Target→Don’t Miss Out
## 💣 CRM Earnings Bear Play 🚨 | Put \$235 Setup (Sep 5 Expiry) 📉🔥
### 📊 Summary
CRM earnings setup skews **bearish** despite durable cash flow:
* **Fundamentals:** Strong margins & FCF, but **revenue slowing (7.6% TTM)** + high bar for AI guidance.
* **Options Flow:** Heavy put OI at **\$230–240** vs scattered calls → institutions hedging downside.
* **Technicals:** Price under 50/200-day MA, RSI overbought (71). Short-term bounce inside longer downtrend.
* **Macro:** Rising VIX + risk-off tone = higher downside sensitivity.
**📈 Net View:** 🔴 **Moderate Bearish (74% confidence)** → downside risk outweighs upside into earnings.
---
### 📝 Trade Plan
* 🎯 **Instrument:** CRM
* 🔀 **Direction:** Put
* 💵 **Entry:** \$2.61
* 📅 **Expiry:** 2025-09-05
* 🎯 **Profit Target:** \$7.83 (+200%)
* 🛑 **Stop Loss:** \$1.305 (-50%)
* 📈 **Strike:** \$235
* ⏰ **Timing:** Enter **pre-earnings close** (Sep 4, AMC earnings).
⚠️ **Exit:** Within 2 hours post-print — avoid IV crush & second-day reversal.
---
### 🚀 Hashtags (TradingView Viral)
\#CRM #EarningsPlay #OptionsTrading #PutOptions #BearishSetup #WeeklyOptions #EarningsTrade #GammaFlow #IVCrush #StocksToWatch #HighRiskHighReward #SmartMoneyFlow #TechnicalAnalysis

Salesforce’s Moment of Truth – September 3 Earnings ReportKey Arguments Supporting the Idea
Strong potential for a positive earnings surprise on September 3, against the backdrop of low market expectations and several growth catalysts.
Funds are increasing their positions in CRM shares, including activist investor Starboard Value.
Attractive valuation levels based on multiples.
Investment Thesis
Market expectations ahead of the report have been revised downward, creating greater opportunities for a positive surprise. According to Salesforce management, more pronounced monetization of the company’s AI products will begin in the second half of 2025. In recent months, several important developments have occurred that should drive business growth despite conservative market forecasts.
First , in May, Salesforce released Agentforce 3 , featuring faster and more accurate responses, expanded functionality, and a more flexible pricing model.
Second , starting in August, Salesforce raised prices for a number of its products and introduced new paid add-ons. This is expected to trigger a structural shift of clients toward more expensive pricing plans.
Ahead of the report, funds have been increasing their positions in CRM shares. In particular, activist investor Starboard Value increased its stake in the company by 50%. Starboard Value was among the activist funds that entered the company’s capital in 2022, after which Salesforce began its transformation with a focus on “profitable growth.” Over the past 1–3 months, a large share of investors have been adding to their CRM positions.
Attractive Valuation Levels
The company is trading at a significant discount on key forward multiples — both relative to its historical averages and compared to other enterprise productivity software companies.
Relative to its 5-year average levels on PEG, P/E NTM, and P/FCF NTM, CRM shares trade at a 40–50% discount.
Compared with one of its main competitors, ServiceNow (NOW) , CRM trades at a 40–60% discount on these same multiples.
This valuation gap has been steadily widening in recent quarters, against the backdrop of weak Salesforce earnings reports. However, it is expected to begin narrowing soon, supported by the monetization of the company’s new products.
Target Price and Recommendation
Our 2-month target price for CRM is $270 , with a “Buy” recommendation . We recommend setting a stop-loss at $230.
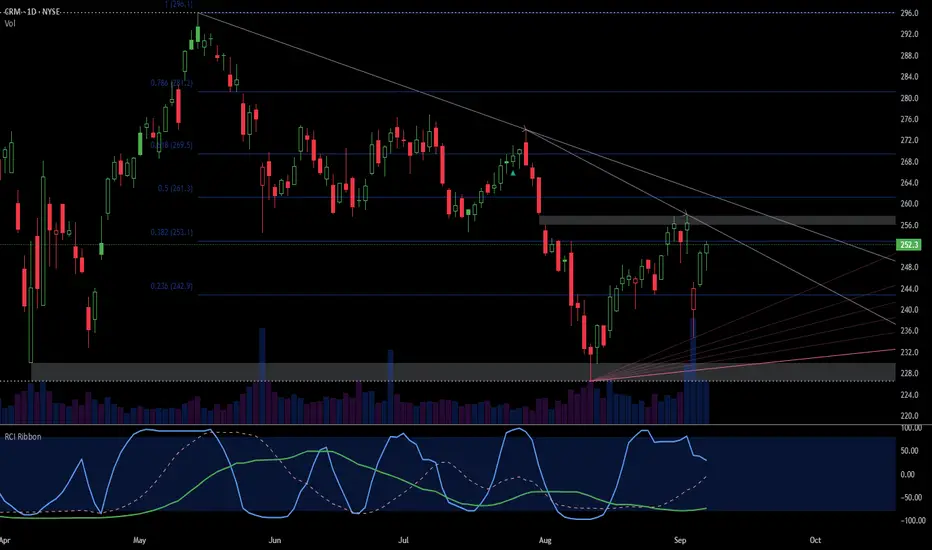
$CRM: Relief Rally or True Reversal?What the Chart Says
Bullish Case
Support Held (226.48): Price bounced off a major support zone, showing buyers stepped in at a critical level.
RSI Reversal: RSI turned up from oversold (~40) with a “Bull” signal, suggesting momentum is shifting.
Upside Potential: A clean break above 255–260 (blue resistance + 50-day MA) could open room toward 280–297.
PMO Flattening: The top momentum oscillator is stabilizing, indicating selling pressure may be losing steam.
Bearish Case
Downtrend Intact: Since February, the chart has made consistent lower highs/lows, with the 50-day MA acting as resistance.
Heavy Supply Overhead: Resistance zones at 260.11 → 280.92 → 297.74 will require strong volume to clear.
Earnings Risk: The upcoming earnings event could spark volatility; disappointment may lead to a retest of 226–230.
Momentum Still Weak: RSI is only ~45, below the neutral 50 line, suggesting bulls don’t yet have full control.
Leaning Side
The chart currently leans bearish-neutral. The bounce is real, but until 255–260 is broken and held, it looks more like a relief rally within a downtrend than a confirmed reversal.
Above 260 → Bullish, targeting 280–297.
Below 255 → Bearish, with risk of retest at 230–226.
My Current View
I initiated a long position at 231, entering near the major support zone. My plan is to manage the trade around the 260 pivot level:
If price clears 260 with conviction, I’ll hold for the next upside leg into the 280–297 resistance zone.
If earnings or sentiment trigger downside, I’ll watch closely whether 226–230 support holds. I’ll remain long as long as this level is defended; a decisive breakdown would force a reassessment.
In summary: I’m long from a strong base, treating 260 as the pivot. Above it, I’ll stay positioned for continuation higher. Below it, I’ll give the trade room but respect the downside risk.

CRMHere’s the latest snapshot for **Salesforce, Inc. (CRM)**:
## Stock market information for Salesforce Inc (CRM)
* Salesforce Inc is a equity in the USA market.
* The price is 248.29 USD currently with a change of 2.33 USD (0.01%) from the previous close.
* The latest open price was 245.78 USD and the intraday volume is 6694286.
* The intraday high is 249.52 USD and the intraday low is 243.44 USD.
* The latest trade time is Saturday, August 23, 03:59:57 +0400.
---
## CRM Stock — Snapshot & Context (As of August 22–23, 2025)
### 1. Market Performance
* **Closing Price**: \$248.29 — up **+1.00%**. However, this was below the broader market gains (S\&P 500 +1.52%, Dow Jones +1.89%) ( ).
* **52‑Week Range**: From a low near **\$226.48** to a high of **\$369.00** (achieved on December 4). CRM is currently **\~32–36% below** its peak ( ).
* **Trading Activity**: Volume was **6.3 million**, slightly below the 50-day average of 7.6 million shares ( ).
---
### 2. Recent Drivers & Investor Sentiment
* **AI Adoption Challenges**
Salesforce's AI product, *Agentforce*, is facing headwinds. Enterprise customers reportedly suffer from "decision fatigue" amid a flood of new AI tools, leading to slower adoption. Complex pricing and unclear ROI are cited as additional deterrents ( , ).
* **Pressure from Activist Investor**
Starboard Value, an activist fund, boosted its stake in Salesforce by nearly **50% in Q2 2025**, now holding about **1.3 million shares**. Amid the stock’s \~30% year-to-date decline, this move fuels speculation of renewed pressure on management to enhance performance ( ).
Following this, Salesforce shares rose **\~3.7% to \$242.08**, and analyst Gil Luria upgraded his rating to "Neutral" with a \$225 target ( ).
* **Strong Earnings & Strategic Acquisition**
In Q1 FY2026, Salesforce posted better-than-expected results:
* Revenue: **\$9.83B**, up 8% YoY
* Adjusted EPS: **\$2.58/share**
As a result, it raised its full-year forecast to **\$41–41.3B**, and EPS to **\$11.27–11.33**. It also announced plans to acquire **Informatica for \$8B**, bolstering its AI and data capabilities ( , ).
* **Macro Trends Impacting SaaS Valuation**
A broader market concern is that SaaS giants like Salesforce may face valuation pressure due to slowing top-line growth—from >20% in 2021–2022 to an expected \~9% in 2025—as competition from agile AI startups intensifies ( ).
* **Recent Volatility**
On August 21, CRM’s weakness contributed to a **318-point drop in the Dow Jones**, pulling the index down roughly 69 points ( ).
---
### 3. Company Overview (Snapshot)
* **Founded**: March 1999 by Marc Benioff and co‑founders ( ).
* **Nature**: A leading cloud-based CRM and enterprise software provider. Member of the S\&P 500 and Dow Jones Industrial Average ( ).
* **Business**: Offers Sales Cloud, Service Cloud, Marketing Cloud, Commerce Cloud, AI tools (like Agentforce and prior Einstein-based AI features), Slack, Tableau, MuleSoft, and more ( ).
---
### Summary Table
| Category | Key Highlights |
| ------------------------ | ---------------------------------------------------------------------------------------- |
| **Price & Range** | \~\$248.29; \~32–36% below 52-week high |
| **Recent Momentum** | +1% Friday; Outperformed peers on Aug. 13 (+2.32%) ( , ) |
| **AI Tool Adoption** | Agentforce growth slowed by decision fatigue & unclear ROI |
| **Activist Involvement** | Starboard boosted its stake—potential catalyst |
| **Earnings & Outlook** | Q1 beat; raised FY26 guidance; acquiring Informatica |
| **Valuation Risk** | Slowing growth in SaaS sector amid rising AI competition |
| **Sector Influence** | Contributed significantly to Dow’s decline on Aug. 21 |
---
### Final Thoughts
Salesforce (CRM) stands at a crossroads. Its foundational strength in enterprise cloud software and AI investments—boosted by a strategic acquisition—are clear long-term advantages. Yet, growth is tempered by cautious customers, heightened competition, and investor pressure. Activist involvement and upgraded guidance showcase potential upside, but execution—especially on AI adoption and margin improvement—remains crucial.

SALESFORCE - CRM - Fractal found and applied to the chart - LONGThis is not a trade call. I am new to fractals trading. ;-)
In addition to what I see a strong bullish move from a seasonal perspective.
Trade is active with a 7% stopploss which is historically the max drawdown for a CRM trade starting from today until early October.
Cheers and good luck!
Vibe coding a risk to Salesforce moatSalesforce (CRM) is facing structural disruption. Not cyclical. Structural. The threat isn’t from Microsoft or Oracle. It’s from culture. From code.
Vibe coding, fast, open-source, AI-native development, is gaining speed. It’s cheaper, faster and skips bloated architecture. It’s not about replacing CRM software. It’s about rethinking workflows.
Salesforce is vulnerable at the bottom. SMEs don’t want complex SaaS stacks. They want modular tools, cheap, fast, scalable. This is where vibe code thrives. No legacy clients. No enterprise red tape.
As SMEs shift, the threat creeps upstream. Large corporates follow. Once adoption takes hold, momentum builds.
This is the Innovator's Dilemma. The incumbent is too invested to pivot. Too big to self-disrupt. So the change is ignored until it’s too late.
Yes, Salesforce has scale and capital. But it's built to sell software, not to be software. Culture eats strategy. Code eats incumbents.
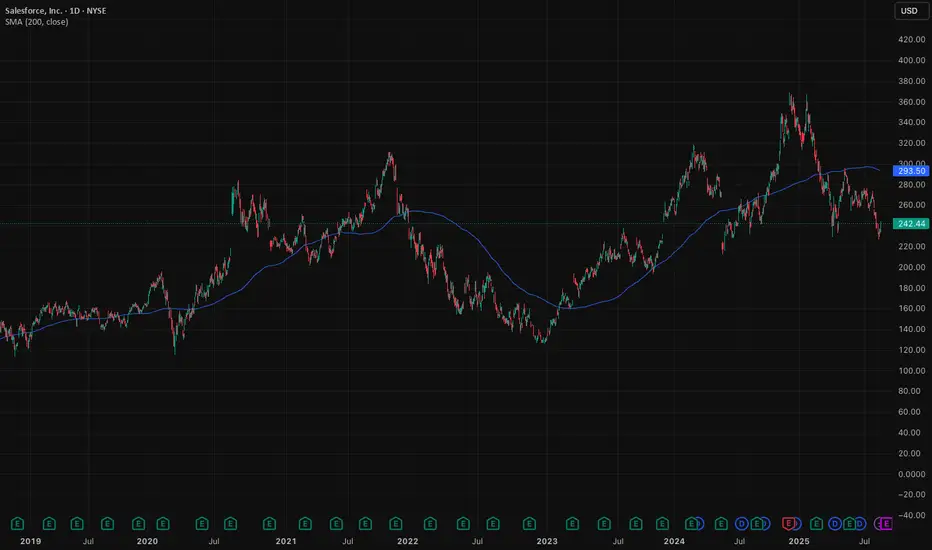
Technicals are cracking. CRM is trading below its 200-day moving average. RSI is drifting lower. No panic, just quiet decay. Valuation isn't reassuring either, CRM trades at roughly 23–26× forward earnings, a discount to its historical average. That signals caution, not comfort.
Disrupt or be disrupted.
The risk isn’t earnings. It’s irrelevance.
The forecasts provided herein are intended for informational purposes only and should not be construed as guarantees of future performance. This is an example only to enhance a consumer's understanding of the strategy being described above and is not to be taken as Blueberry Markets providing personal advice.
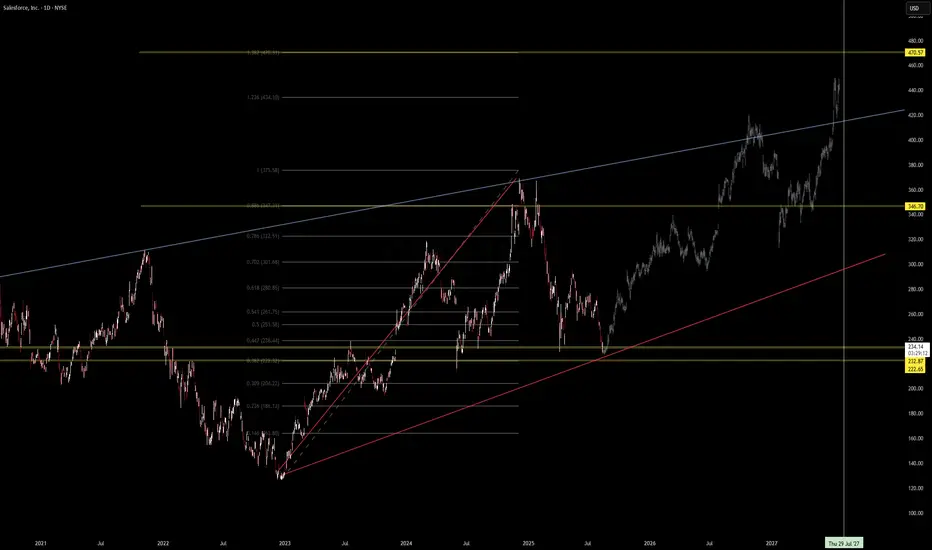
Salesforce (CRM) – From Base to Breakout📈 Salesforce (CRM) – From Base to Breakout
Back in 2023, CRM was trading in the $222–$233 range — a textbook accumulation zone that set the stage for what we’re seeing now. Fast forward, and the stock has broken above long-term resistance, pushing past the $375 level and heading toward key Fibonacci extension targets at $434 and $470.
This breakout isn’t just about price; it’s a case study in patience, technical alignment, and respecting the base-building process. Strong trend structure, clean breakout, and momentum all point to sustained strength — as long as the breakout holds above $346.
The lesson here?
Identify the base early
Watch for structural breakouts
Let momentum work in your favor
Markets reward those who prepare during quiet periods.
#Trading #TechnicalAnalysis #Stocks #Investing #MarketInsights #CRM #Salesforce #Breakout
Crm classic double top monthly Seems pretty straight forward - second top usually reaches slightly higher and with a clear head and shoulders forming on the weekly it seems like a no brainer to be short to 215 and if that breaks which I think it will could be a long tumble down to the 150s

CRM Bullish Double bottom unfolding🚀 CRM Bullish Double bottom unfolding
Ticker : Salesforce, Inc. (CRM)
Timeframe : 1D (Daily Chart)
Setup Type : Potential Double Bottom / Range Breakout
Bias : Bullish Reversal
Technical Breakdown
CRM is showing signs of forming a potential bottoming structure after a sharp decline and a period of sideways consolidation. We're currently sitting near the bottom of the range, and this could offer a favorable long setup with clearly defined risk and reward.
Look at the Blackstone's chart where a double bottom appeared in a very similar moment and offered a great opportunity to join the rally.
Here’s what’s happening:
Price has tested the same support level twice, around $259, hinting at a possible Double Bottom pattern.
If buyers step in from here and push price above the resistance zone near $275–278, we could see a strong continuation move.
The Volume Profile (VPVR) shows a big high-volume node above $275, meaning once that level is cleared, there’s room to run.
🎯 Educational Trade Plan
Entry idea : On confirmation of support around $259 or breakout above $278
Stop Loss : Below support, ~3% risk
Target 1 (Easy TP): 5.5% – retest of previous highs near $290
Target 2 (Full Move): 11% – around $310, aligned with the broader resistance and VPVR value area
💡 Why This Matters
This setup offers a tight stop and healthy reward , perfect for traders looking for calculated entries. It's also a great teaching moment:
-> When price consolidates near support with clear structure and nearby volume gaps, breakouts can be explosive once resistance gives way.
-> If CRM confirms the bounce, we could be at the early stages of a bullish swing back to value.
✅ Key Takeaways for Traders
Structure : Potential double bottom or range play
Location : Near strong support
Volume : Favorable above resistance
Risk Management : Clean stop just below lows with great risk/reward ratio.
💬 Does this setup align with your view on CRM?
🚀 Hit the rocket if this helped you spot the opportunity and follow for more clean, educational trade ideas!

CRM bullish setupOptions Plays (Sept/Oct Expiry)
🔹 Bullish Swing (if you believe CRM bounces)
1. Call Debit Spread (defined risk)
• Buy Sept/Oct $260 Call
• Sell Sept/Oct $280 Call
• Low cost, targets a move back to resistance. Max gain if CRM closes >$280.
2. Straight Calls (higher risk/reward)
• Buy Oct $260 Calls (at/near money).
• Gives time for CRM to recover to $280–300 zone.
⸻
🔹 Neutral to Slightly Bullish
1. Put Credit Spread (if you think $240 holds)
• Sell Oct $240 Put
• Buy Oct $230 Put
• Collect premium if CRM stays above $240 by October.
⸻
🔹 Bearish Hedge (if support fails)
• Buy Oct $240 Puts
• If CRM breaks $245, this protects downside toward $220.
