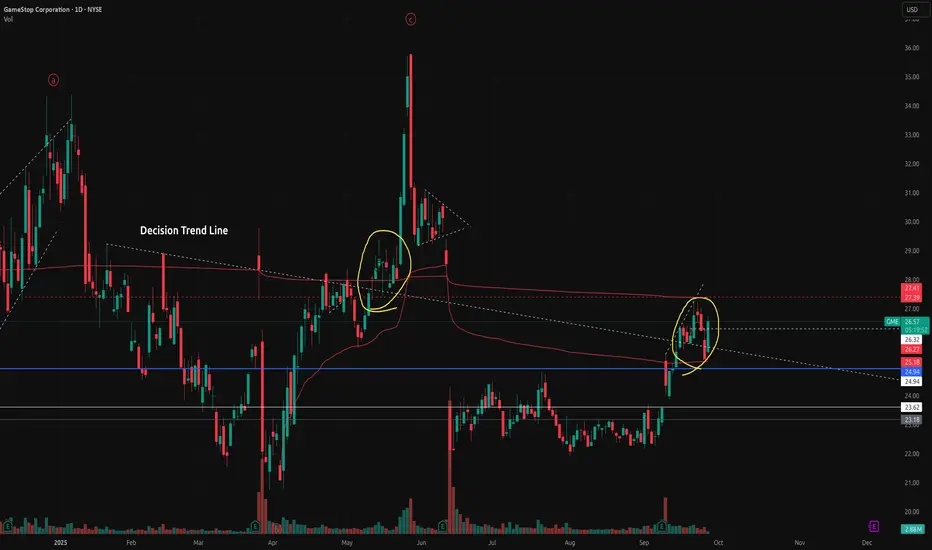
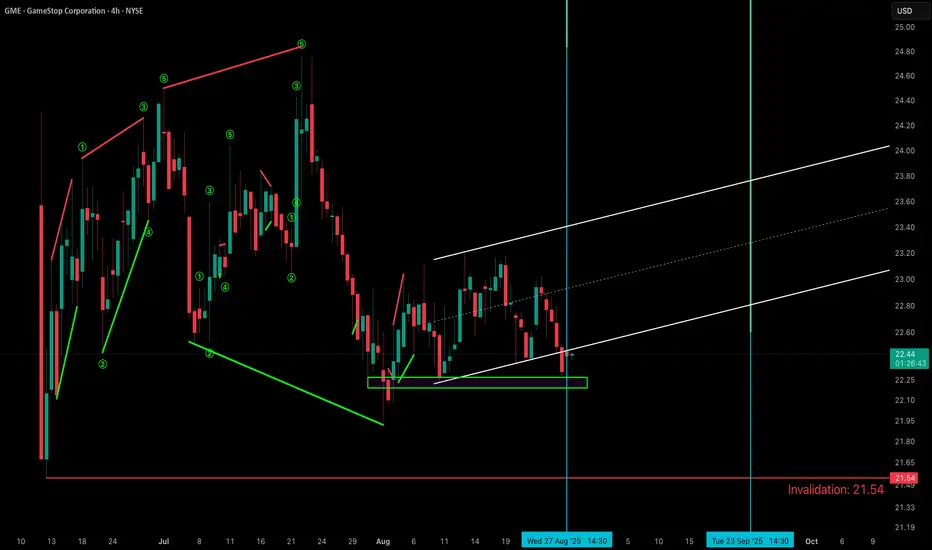
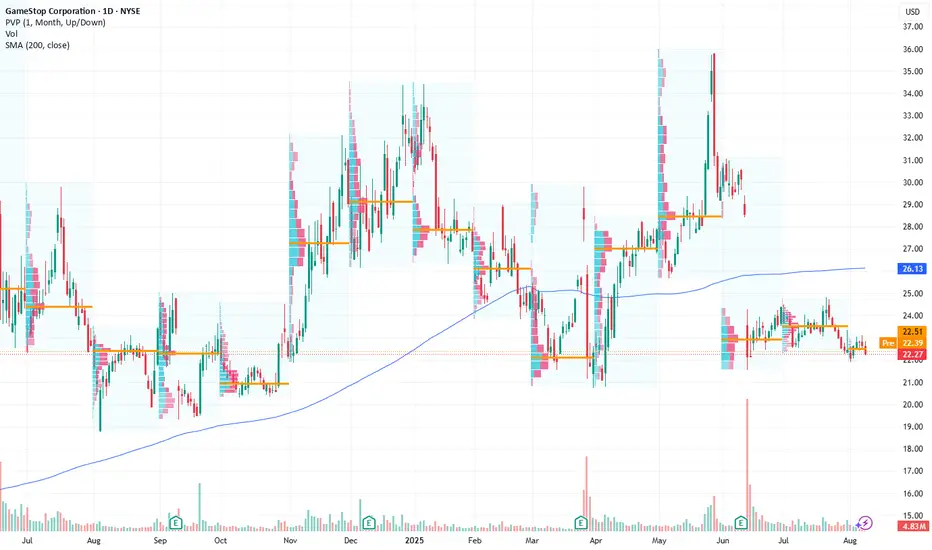
GME - Time for Giants again?GME is not a stock I have a clear wave-count on by any means, but elliot wave theory is not the only means by which I trade. I selectively look at volume/market structures to make decisions. And let me say, for ALL of 2025, this 'Decision Trend Line' has been the deciding factor between GME running or GME falling.
Only ONCE has it broken through and retested, the last time it did this? Mid may, when prices quickly soared on Bitcoin rumors.
GME is a company that fundamentally has turned some things around, but I'm not ignoring this clear technical breakthrough and retest.
The time of giants is near again.
GS2C trade ideas
GME(GameStop Corporation) 4H Pre-Earnings SetupGME’s been chopping sideways for the past few months, ranging tightly between $21.50 – $23.50, forming a solid base within a Demand Zone.
Major flush from ~$37.50 occurred in early June post-earnings selloff, followed by range-bound consolidation — classic post-pump retrace and equilibrium setup.
Price is sitting just above a fresh demand zone (21.34 – 21.53) with a potential upside move targeting prior supply zone at $30.05 – $31.05 — clean structure.
🧾 Earnings:
Last Quarter (Jun 10):
EPS surprise: +112.5% ($0.17 vs $0.08 est.)
Revenue miss: -2.35%
Upcoming (Sep 9):
EPS est: $0.19
Revenue est: $900M
Analysts expect YoY revenue growth of 3.1% (a reversal from last year’s -31.4%)
Q2 earnings drop tomorrow, Sept 9 — high volatility expected.
Market is watching for signs of turnaround post-restructuring rumors and broader retail strategy updates.
📈 Technical Setup:
Demand Zone: 21.34 – 21.53 ✅
Supply Zone: 30.05 – 31.05 🚨
🎯 Trade Idea (Swing Setup):
Entry: $22.75 (current market)
Stop Loss: $21.51(below demand zone)
Take Profit: $30.19 (mid-supply zone)
RRR: ~6.0 (excellent setup)
🧮 Risk Management:
Max capital risk: 1–3% of total portfolio.
🧰 Trade Management:
Consider moving SL to breakeven once price hits $24.5–25 (first structure resistance).
Scale out 50% at $27, hold rest for full TP.
Trail stops aggressively after break above $28.
“The market is a device for transferring money from the impatient to the patient.” — Warren Buffett
⚠️ Disclaimer:
This is not financial advice. Trade at your own risk. Always do your own research and use proper risk management.

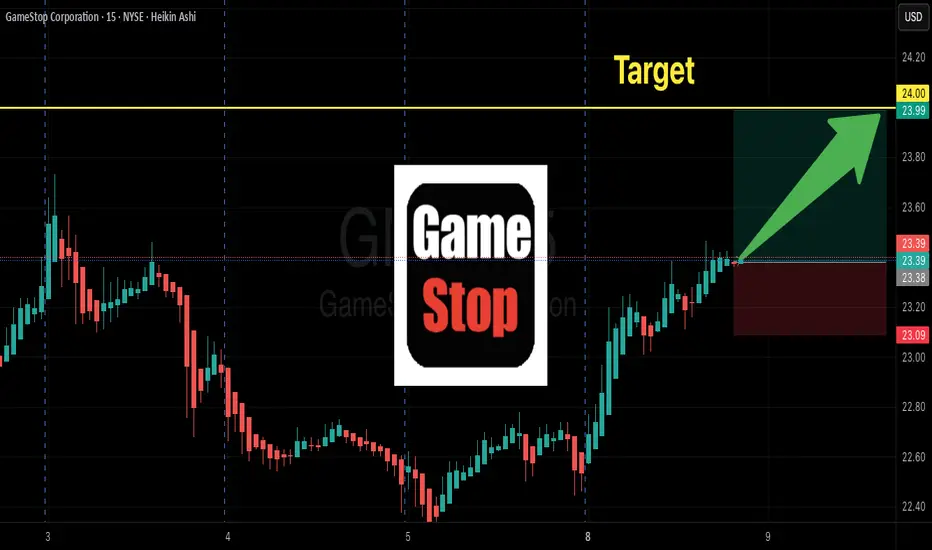
GME Market Strategy: Risk-Managed Swing to Resistance🚨 GME: GameStop's Great Heist! 🎮💰 Bullish Swing/Day Trade Plan
Asset: GameStop Corporation (GME)Market: NYSE (Stock)Strategy: Swing/Day Trade with a "Thief's Layered Limit Order" Approach 😎
Get ready, traders! We're about to pull off a bullish heist on GameStop (GME) with a slick, calculated plan to outsmart the market! 📈 This setup is packed with technical firepower and a cheeky vibe to keep it fun yet professional. Let’s dive into the Thief’s Wealth Strategy Map and steal some profits! 🕵️♂️
📊 Technical Breakdown: Why GME is Ripe for the Taking
Our bullish setup is backed by a rock-solid technical foundation. Here’s the intel:
🔥 382 EMA Breakout: GME has smashed through the 382-period Exponential Moving Average, signaling strong bullish momentum. This breakout is our green light for action! 🚦
💥 Accumulation Zone Pressure: Buyers are stacking up in the accumulation zone, pushing prices upward like a crew of bullish bandits ready to raid the market.
🕯️ Heikin Ashi Reversal Candle: A gorgeous bullish Heikin Ashi candle has emerged, screaming BUYING POWER and confirming the trend reversal. The bulls are in control! 🐂
🗝️ Thief’s Edge: We’re using a layered limit order strategy to sneak into the market at multiple price points, maximizing our entry precision.
🕵️♂️ The Thief’s Entry Plan: Layered Limit Orders
This isn’t your average “buy and pray” strategy. We’re using a layered limit order approach to enter like sneaky market thieves. Set your buy orders at these levels:
🪙 $24.00
🪙 $24.50
🪙 $25.00
🪙 $25.50
🪙 $26.00
Pro Tip: Feel free to add more layers based on your risk appetite and account size. The more layers, the merrier the heist! 😜 You can also enter at any price level within this range if you prefer a single strike. Just keep it sharp and calculated!
🛑 Stop Loss: Protect Your Loot
🛡️ Set your stop loss at $23.00 to guard against unexpected market traps. ⚠️
Note: Dear Ladies & Gentlemen (Thief OGs), this is my suggested stop loss, but it’s your heist! Adjust it to suit your risk tolerance. Trade smart, and don’t get caught by the market cops! 👮♂️
🎯 Target: Cash Out Before the Barricade!
🎰 Our profit target is $31.00, where a police barricade zone (aka strong resistance) awaits. This level is flagged as overbought with a potential trap for greedy thieves. 🪤 Escape with your profits before the market clamps down!
Note: Thief OGs, this is my target, but you’re the boss of your trades. Take profits at your own discretion and secure the bag! 💸
🔗 Related Pairs to Watch (Correlated Assets)
To maximize your market intel, keep an eye on these correlated assets (all in USD):
🎥 NYSE:AMC Entertainment (AMC): Another meme stock darling, often moving in tandem with GME. Watch for similar bullish setups or divergences.
📊 AMEX:SPY (S&P 500 ETF): GME’s wild swings can be influenced by broader market sentiment. If SPY is bullish, GME’s momentum could get an extra boost!
📱 NYSE:BB (BlackBerry): Another retail-favorite stock with potential for correlated volatility. Check for breakout patterns here too.
Key Correlation Points:
🚀 NYSE:GME and NYSE:AMC : Often ride the same retail-driven waves, especially during short squeezes or social media hype.
⚖️ AMEX:SPY Influence: If SPY shows weakness, GME’s bullish momentum might face resistance. Stay alert!
🔍 NYSE:BB as a Signal: If BlackBerry is pumping, GME might follow suit.
📝 Final Notes for the Heist
This is a high-octane, bullish setup designed for swing or day traders with a taste for calculated risk. The Thief’s Layered Limit Order Strategy gives you flexibility to enter the market like a pro, while the technicals (382 EMA breakout, Heikin Ashi, and accumulation pressure) provide a solid foundation. 🏦
Stay sharp, manage your risk, and don’t get greedy—escape with your profits before the market throws up a barricade! 🚓
✨ “If you find value in my analysis, a 👍 and 🚀 boost is much appreciated — it helps me share more setups with the community!”
#Hashtags: #GME #StockMarket #SwingTrading #DayTrading #Bullish #TechnicalAnalysis #TradingStrategy #MemeStocks

GME - Bullish mode againDisclaimer - I'm not a Diamond hand GME type but this is a very bullish formation, technically.
GME is back on uptrend a while ago but going sideways.
With the recent developments from their earnings call with CASH on their balance sheet and Warrants for the shareholders (Record date - 3 Oct 2025) blah blah... grabbed everyone's attention.
Ref: infomemo.theocc.com
Technical takeaways -
- The Chart turned very bullish and heading for the gap fill upto 29-30
- Weekly closed above 200MA and above 50MA
- Above the highest volume shelf (~22)
Long anywhere here
Target 1 - 29
Target 2 - 32
Target 3 - 41
Target 4 - 50
Stop loss - 21

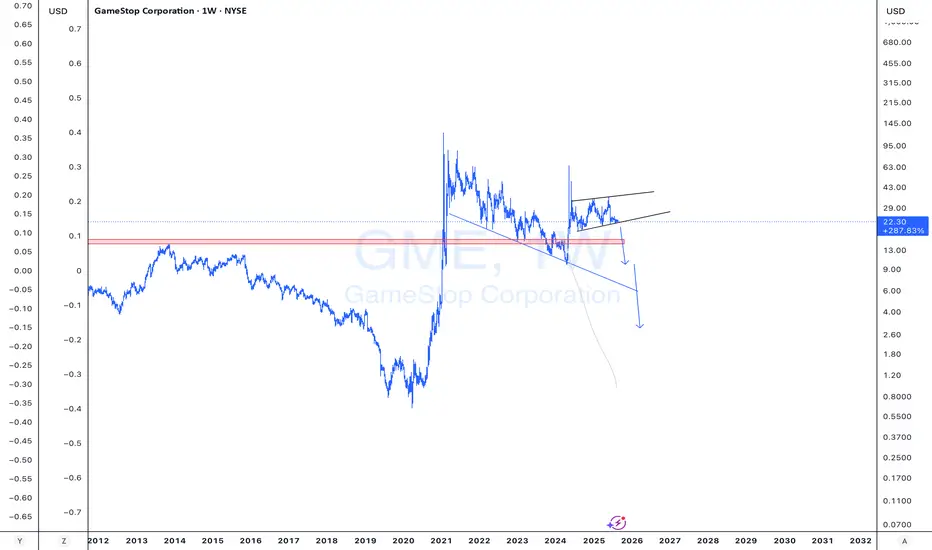
GME §8-)OK boys and girls – a little weekend fantasy for you (sneaky giggle 😏).
See those pink zones?
Notice what happened every time the market broke out there?
Now look at the whole width of those zones (highlighted in green).
What if that entire fat chunk is actually one giant buy zone? A monster pit where smart money is scooping up loads… quietly, secretly…? 🤔💸
Alright, enough daydreaming:
Don’t FOMO 🚫🐑
Have a happy weekend 😎🎉

GME warchestRemember when they kept shorting GME and double down and shorted more. Anything below $28. will multiply by 3 or more

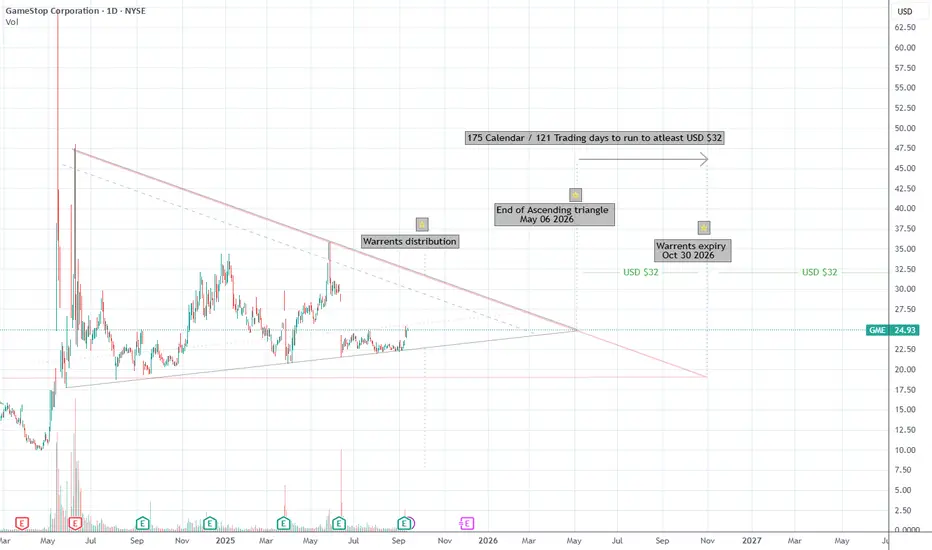
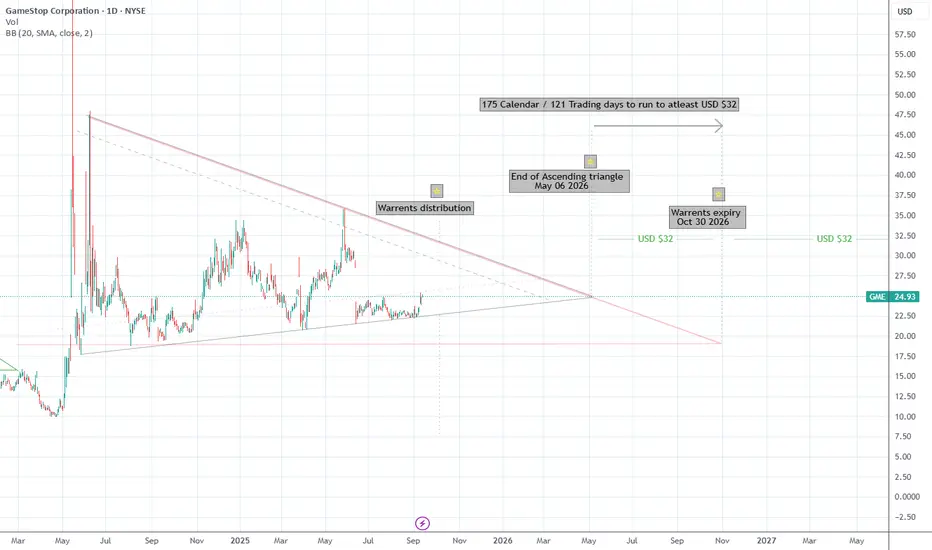
GME - A Dive Into RC's Thought ProcessWe are currently in a 1 year ascending triangle.
After the ascending triangle phase is complete at around $24.70, we will have 175 Calendar days to run to GME USD $32 (Roughly %30) where Dividend warrants will expire in the money or worthless.
For reference only
Potential for a new Bull run for "GME"GME has closed above the purple line in my Trend Following Indicator (it is 30 weeks EMA). This is a sign for a possibility of uptrend (possibility to start Stage 2 "Clamping stage"). However, there is still gap in 23.17$. Therefore, if you want to apply trend following strategy, you may buy at break out (25.44) and make sure to set stop loss at least (three times ATR (20)) at 22.6$ below the gap. The risk in this trade should not exceed 2% of your total capital.
The second principle in trend following strategy is to add to the winners. You can Pyramid one quarter of your initial position with each half ART rise in price (maximum four times). By doing so, you will maintain the risk on capital with 2% and pyramiding risk will be subjected on the profit only.
The main goal for trend following strategy is to ride a big move. Thus, if stop loss is hit, repeat the process again till you catch the move. Therefore, position sizing and risk management is a key in trend following strategy.
All this calculation is available in my indicator Trend Following System-1.
This is not a financial advice. it is just an education of Richard Dennis who invested 1,600$ and gain profit more than 200 million dollars by applying Trend Following Strategy.

GameStop's $24.93 Price Eyes Breakout Amid Retail Sentiment SpikCurrent Price: $24.93
Direction: LONG
Targets:
- T1 = $28.50
- T2 = $32.00
Stop Levels:
- S1 = $23.40
- S2 = $21.80
**Wisdom of Professional Traders:**
This analysis synthesizes insights from thousands of professional traders and market experts, leveraging unique knowledge and trend indicators to identify promising opportunities with GameStop. By evaluating data patterns and behavioral trends, this collective wisdom highlights how retail trader sentiment and technical price setups converge to define actionable price movements in the stock.
**Key Insights:**
GameStop has recently emerged as a popular trading symbol among active retail investors, stemming from historical momentum in 2021 and its continued cult-like following within online trading forums. The stock's volatile nature creates an opportunity for traders looking to capitalize on short-term price movements driven by rapid sentiment shifts.
From a technical perspective, GameStop's recent price consolidation near the $24.50-$25.00 range forms a notable support level critical to maintaining bullish momentum. If this level holds, upward price potential targets the mid-$28 range, reflective of strengthening retail interest paired with increased upside volume. Additionally, RSI levels hovering near oversold territory signal room for a rebound to higher price intervals aligning with broader indicators.
**Recent Performance:**
After stabilizing from previous declines earlier this year, GameStop has demonstrated volatility largely centered between a $22-$26 range over the past weeks. Failure to breach critical downside support in recent trading sessions has heightened market demand, positioning the stock for increased speculative trading as volumes pick up above its average level.
**Expert Analysis:**
Analysts tracking GameStop note improvements in trading activity, suggesting accumulation by retail traders confident in the company's near-term outlook. GameStop’s unique retail-driven dynamics limit reliance on traditional valuation metrics, with technical factors—such as MACD crossover signals and volume surge—taking primacy in defining actionable setups.
Several professionals point to elevated short interest levels as a catalyst for potential upside moves amid retail buying pressure. This unique interplay creates a high-risk/high-reward scenario emphasizing vigilance around critical stop-loss levels.
**News Impact:**
Recent announcements around leadership shifts continue to generate mixed sentiment from long-term investors, but the focus remains on the stock’s price action and trading momentum rather than on fundamental shifts. In addition, broader market steadiness among consumer retail equities boosts the outlook for similar stocks, adding to the case for near-term bullish price movement in GameStop.
**Trading Recommendation:**
Given market sentiment, technical indicators, and active retail participation, traders should consider a long position on GameStop with defined stop-loss levels to mitigate downside risk. If the consolidation holds above $24, breakout potential toward $28.50 and $32.00 remains plausible. Keeping risk management of stops at $23.40 and $21.80 solidifies a structured position on this speculative trade opportunity.
Do you want to save hours every week?
GME - A Dive Into RC's Thought ProcessWe are currently in a 1 year ascending triangle.
After the ascending triangle phase is complete we will have 175 Calendar days to run to GME USD $32 where Dividend warrants will expire in the money or worthless.
For reference only
OTC Market📉 Pump and Dump Strategies: Why They’re Toxic
1. What is a Pump and Dump?
Definition: A promoter secretly buys a large block of a penny stock, then hypes it with false/misleading claims (insider info, patents, big deals, etc.).
Pump phase: Price rises because traders chase momentum and FOMO sets in.
Dump phase: Promoter unloads shares at inflated prices → latecomers take the losses.
Similarity: Works like a Ponzi — profits for the first in, big losses for the last in.
2. Why Penny Stocks?
Thinly traded → small amounts of money can move prices 100%+.
Low price illusion → “cheap” stocks attract naive traders.
Limited disclosure → OTC markets don’t have the same transparency or SEC filings as major exchanges.
3. The Psychology Behind It
FOMO Bias: Investors see a stock up 200%, assume more gains are coming, and rush in.
Herd Mentality: More people pile in as the rumor spreads (now accelerated by Twitter, Reddit, Discord, etc.).
Bias Reinforcement: Early winners brag about profits, pulling more late buyers in.
4. Historical Example
John “Lebanon” (alias) in 1999–2000 promoted penny stocks online.
At 16 years old, made ~$1M before SEC settlement forced him to repay most gains.
Shows how profitable but illegal these schemes can be.
5. Data Against OTC Stocks
Study (“The Twilight Zone,” Brüggeman et al.):
Reviewed 10,000 OTC stocks (2001–2010).
Average return: –27%
Median return: –37%
Translation: For every one stock that goes +1000%, dozens collapse to near zero.
Skewed distribution: A few outliers give false hope, but most are losers.
6. The Wolf of Wall Street Parallel
1990s “boiler rooms” = cold-call centers pushing penny stocks.
Today → replaced by social media hype (same playbook, faster reach).
The JAMN chart (2011) shows exactly how volume spikes first, then price spikes, then crashes back to pre-pump levels.
7. Why They’re So Dangerous
Illegal under SEC/FINRA rules.
Immoral — only insiders benefit.
Zero-sum (or worse) — short-term trading is mostly zero-sum, but pump-and-dump leaves many big losers.
Retail trap — latecomers almost always lose money.
✅ Takeaways for Investors & Traders
Avoid OTC penny stocks as a long-term investment vehicle.
If something sounds like a guaranteed win, it’s likely a promotion, not a discovery.
Don’t chase 500–1000% moves — statistically, you’re far more likely to buy the loser than the winner.
Focus instead on regulated exchanges, liquid names, and proven strategies (like your futures, gold/silver seasonality, REITs, etc.).
👉 In one line: Pump-and-dump strategies aren’t just illegal — they’re designed to transfer money from the many to the few, and history plus data show OTC penny stocks are graveyards for capital.
📉 Shorting Penny Stock Runners on the First Red Day
1. Strategy Idea
Premise: Ultra-low-priced stocks that spike +100% to +500% in a short time (3 days or less) almost always collapse back to their base price.
Why? Because these moves are usually fueled by hype (press releases, chat rooms, “AI stock,” “cannabis stock,” etc.) and thin liquidity.
Execution: Wait for the first red hourly candle (close below the previous close) after the parabolic move, then short.
2. Criteria to Screen Stocks
Price: Low price, small-sized companies.
Volume: At least 100k shares traded daily during the spike (liquidity for entry/exit).
Spike: Stock up 100%+ in 3 trading days or less.
Catalyst: Often weak (paid promotion, vague press release, sector hype).
Float: Preferably low float (<20M shares) → parabolic spikes fade faster.
3. Entry & Exit Rules
Entry (Short):
Only enter on the first red day close after the multiple-day run.
Confirmation = intraday lower highs + heavy selling volume.
Exit (Cover):
Near support (often halfway back down the spike).
Or use VWAP intraday as a guide — cover if reclaimed. I would look for entry around the bands and have the TP/SL at the next band.
Stop-Loss:
If price reclaims highs → cut.
Keep risk tight (these can gap against you).
Sometimes it just keep going up.
4. Risk Management
Penny stocks are highly manipulated — never size too big.
Rule of thumb: Risk no more than 1–2% of account per trade.
Consider using options (puts) if available — limits max loss.
Avoid overnight shorts on day 1 red — promoters can gap the stock up again. Safer to short intraday or skip.
5. Example Playbook
Day 1–3: Stock goes from $0.70 → $2.20 (+214%).
Day 4 (First Red Day): Closes at $1.95 after hitting $2.40 intraday.
Short Entry: End of Day 4 at $1.90.
Target: Cover at $1.20–$1.40 (50–70% retrace).
Stop: Above $2.40 intraday high.
6. Pros & Cons
✅ Pros
High-probability setup (over 70%+ collapse rate historically).
Clear entry signal (first red day).
Works repeatedly because human FOMO behavior never changes.
❌ Cons
High borrow fees (hard-to-borrow shares).
Risk of “second leg” pumps.
Regulators watch shorting penny stocks closely — need proper broker.
7. Tools to Implement
Screeners:
TradingView stock screener → filter “Float 1M to 20M, New High 1 Month, Pre-Market Gap >2%, and ATR(14) > 0.5 or ADR > 5%”. Relative Volume helps, if you see it go lower with a fading volume, then it's a sign of bullish reversal.
Chart Pattern Recognition: Look for parabolic blow-offs with volume climax. I track VWAP.

GME Q2 Earnings Beat + Warrant Dividend: $32 Now the MagnetGameStop’s latest quarterly results came in stronger than expected, reinforcing the turnaround narrative. At the same time, the board announced an unusual “dividend” in the form of warrants, each giving shareholders the right to buy one share at $32 until October 2026 (record date: October 3, 2025).
With this strike price clearly visible, $32 now acts as a magnet for price action in the coming months. Market participants know that above this level the warrants gain real intrinsic value, and below it they are only speculative. It’s reasonable to assume there’s a high probability of the market testing or reaching $32 ahead of the record date.
From a technical perspective, yesterday’s breakout plus strong earnings leaves room for higher targets. According to my chart analysis, the next potential upside levels are descripted by Fibonacci's Trend-based extended figure.

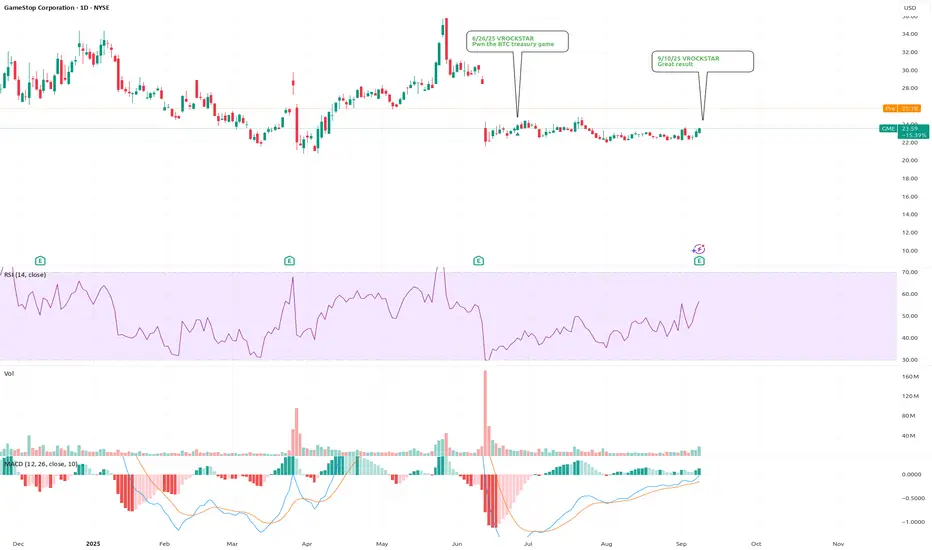
9/10/25 - $gme - Great result9/10/25 :: VROCKSTAR :: NYSE:GME
Great result
- nice help from Switch 2
- bye bye Canada drag and other SG&A excess
- trading card revenue continues to climb in importance (and my personal DD shows they are holding back a lot of cards - pun intended)
- the FY revenue estimate is probably 20-25% lower than mine, and typically a mgmt CC (which they don't do- maybe some day) would really hype this thing
- took a swing AH and am already out (don't shoot!) and honestly think there's good merit for it to keep running
- just too many battle scars this last Q from retail that beat and dunked shortly thereafter for me not to notice- even if this one defn a bit different
- it's on the short list to own into YE and 2026 if we do get back toward the starting pt - call it $22/23 zone. not expecting it per se, but that's where i have my trigger
- congrats ryan and the gme holders - this one is a totally diff animal today and continues to hit on all cylinders
V
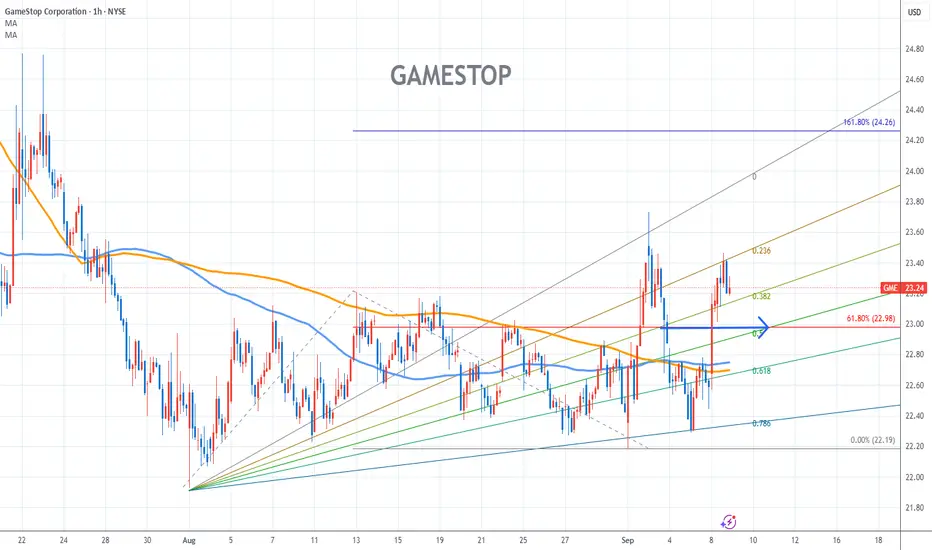
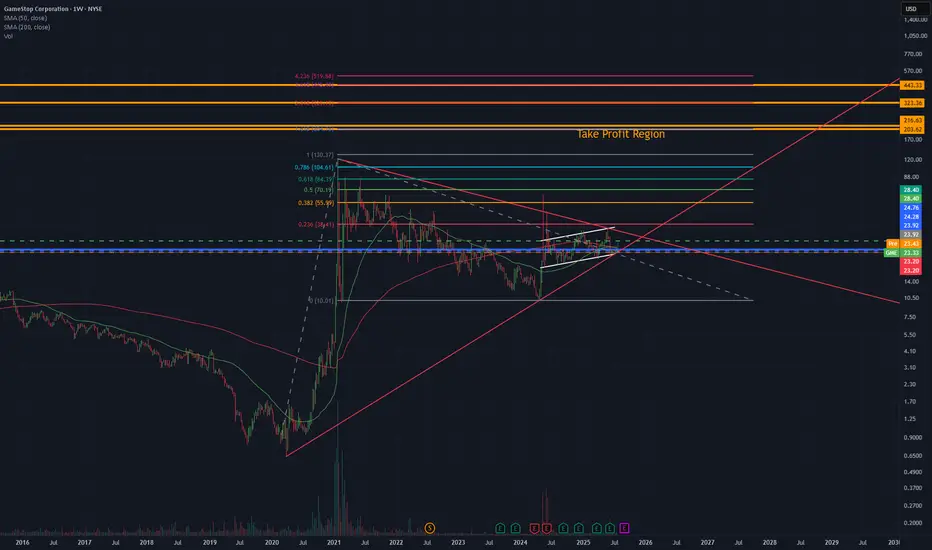
GameStop Stock Chart Fibonacci Analysis 090825Trading Idea
1) Find a FIBO slingshot
2) Check FIBO 61.80% level
3) Entry Point > 23/61.80%
Chart time frame:C
A) 15 min(1W-3M)
B) 1 hr(3M-6M)
C) 4 hr(6M-1year)
D) 1 day(1-3years)
Stock progress:A
A) Keep rising over 61.80% resistance
B) 61.80% resistance
C) 61.80% support
D) Hit the bottom
E) Hit the top
Stocks rise as they rise from support and fall from resistance. Our goal is to find a low support point and enter. It can be referred to as buying at the pullback point. The pullback point can be found with a Fibonacci extension of 61.80%. This is a step to find an entry-level position. 1) Find a triangle (Fibonacci Speed Fan Line) that connects the high (resistance) and low (support) points of the stock in progress, where it is continuously expressed as a Slingshot, 2) and create a Fibonacci extension level for the first rising wave from the start point of the slingshot pattern.
When the current price goes over the 61.80% level, that can be a good entry point, especially if the SMA 100 and 200 curves are gathered together at 61.80%, it is a very good entry point.
As a great help, TradingView provides these Fibonacci speed fan lines and extension levels with ease. So if you use the Fibonacci fan line, the extension level, and the SMA 100/200 curve well, you can find an entry point for the stock market. At least you have to enter at this low point to avoid trading failure, and if you are skilled at entering this low point, with the fibonacci6180 technique, your reading skill of to chart will be greatly improved.
If you want to do day trading, please set the time frame to 5 minutes or 15 minutes, and you will see many of the low points of rising stocks.
If you prefer long-term range trading, you can set the time frame to 1 hr or 1 day
GME Options Flow Screams Upside To $24C – Tactical Call Buy!
# 🎮🔥 GME Earnings Lottery Ticket: \$90 Risk for 200%+ Upside!
📊 **Earnings Analysis Summary (2025-09-08)**
💡 **Trade Idea:**
👉 Buy **1x GME \$24.00 CALL** (exp. 2025-09-12) at **\$0.90** (pre-earnings close entry).
This is a **single-leg naked call**, pure tactical play.
---
### 🧩 Why This Trade?
* 📉 **Fundamentals Weak**: Revenue –16.9% YoY, thin margins.
* 💵 **Massive Cash Cushion**: \$6.39B → no bankruptcy risk.
* 📈 **Options Flow HOT**: Heavy call OI at \$24/\$25 → gamma squeeze risk.
* 🎯 **History of Surprises**: 75% beat rate, often outsized moves.
* ⚡ **IV Elevated but Fair**: Calls priced \$0.50–\$1.10 → reasonable lottery ticket.
---
### 📊 Scores (1-10)
🔻 Fundamentals: 3
📈 Options Flow: 8
📊 Technicals: 5
🌎 Macro: 5
✅ Overall Conviction: **72% MODERATE BULLISH**
---
### 📌 Trade Plan
🎯 Entry: \$0.90 limit (pre-earnings close)
🛑 Stop Loss: \$0.45 (–50%)
💰 Profit Targets:
* +150% = \$2.25 (scale out 50%)
* +200% = \$2.70 (full take profit)
📆 Exit: within 2 hrs post-earnings to avoid IV crush
---
### ⚖️ Risk/Reward
* Max Loss: **\$90**
* Breakeven: \$24.90 (needs +10.1% move)
* Upside: +200% to +300% possible if GME squeezes
---
📊 **TRADE DETAILS**
* 🟢 Instrument: GME
* 🟢 Direction: CALL
* 🎯 Strike: 24.00
* 💵 Entry: 0.90
* 🛑 Stop: 0.45
* 📅 Expiry: 2025-09-12
* 📈 Confidence: 72%
* ⏰ Earnings: 2025-09-09 (AMC)
---
🚀💎🙌 This is a **lottery-style upside bet**: risk a small ticket, catch a big move if earnings surprise + gamma squeeze align.
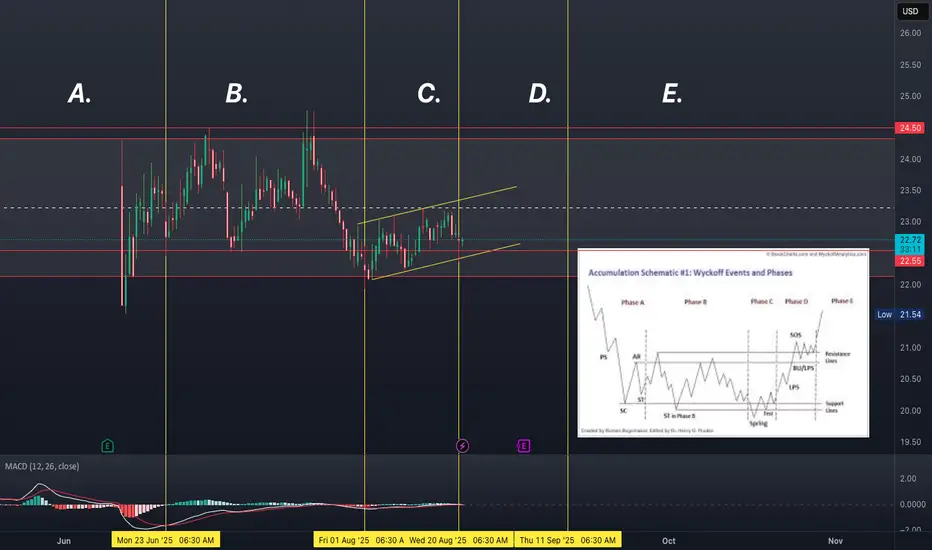
GME Breakout Alert | Gann Cycle Turning Point📅 27th Aug → Gann date hit today
📅 Next Key Date → 23rd Sep
After nearly 3 months of sideways consolidation, momentum is building.
Enough is enough — the setup is primed for a breakout. ⚡
GameStop ($GME) Collapse ImminentNYSE:GME showing signs of major technical distress.
This whole meme thing had to end somewhere. At the end of the day, that was easy money for anyone looking to make a quick buck.
Just ask yourself, if you controlled tens of millions of shares at 25X their average historical trading range, why would you hold that?
And that's exactly what has been going on for the last several years. The weird thing is that it lasted so long and seemed to have a dedicated following. After all, a movie was made about the whole phenomenon (I never saw the movie).
This thing likely goes very quickly on the break.
Gamestop: A RequelI have been wrong about a lot on GME...like a lot (jury is still out on 20 week cycle)
But what im still assured of is the fact that GMEs structure is still, from a MACRO perspective bullish (i will let someone else debate the fundamentals..I trade on TA only)
But the question every GME'er wants to know is will it squeeze again?
My answer, strictly from a TA perspective is: MOST LIKELY
When: JANUARY 2026
BTW it will likely squeeze no matter if The Cat comes back or not (he probably will..remember i said it)
Ok so im going to explain to you in a series of charts why from a TA perspective I'm ALMOST CERTAIN GME WILL SQUEEZE AGAIN
And because I love this chart

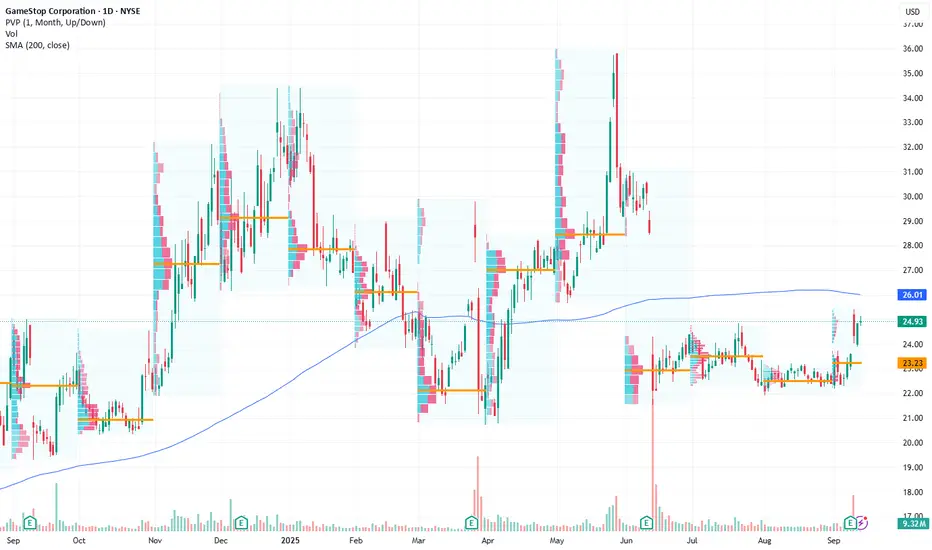
$GME Accumulate phasePossible accumulation phase, hence why institutions are eating up shares these past few weeks. Breaking lower would scratch this idea and instead, become distribution.
$203 TargetTrade closed when i updated it for some reason, so ill re-post.
Same idea, same target, keep waiting n relax

Looking for $203Super meaningful description, chart explains itself and numbers behind in borrows and shorts are lined up, sooner than later gonna move... tgt 200-210
GameStop Faces Key Resistance Amidst Market VolatilityCurrent Price: $22.27
Direction: LONG
Targets:
- T1 = $23.10
- T2 = $23.80
Stop Levels:
- S1 = $21.80
- S2 = $21.40
**Wisdom of Professional Traders:**
This analysis synthesizes insights from thousands of professional traders and market experts, leveraging collective intelligence to identify high-probability trade setups. The wisdom of crowds principle suggests that aggregated market perspectives from experienced professionals often outperform individual forecasts, reducing cognitive biases and highlighting consensus opportunities in GameStop.
**Key Insights:**
GameStop (GME) has been a hallmark of high volatility trading, with the stock positioned in a narrative that oscillates between speculative fervor and macroeconomic challenges. The company continues to grapple with reinventing its business model while navigating an incrementally competitive gaming and digital tech environment. Professional traders note the critical importance of tracking price action near the $23 resistance zone, which could act as a catalyst for a breakout if bullish sentiment strengthens. The current price offers a favorable risk-reward setup for a cautiously optimistic long play, targeting likely price appreciation near key technical levels.
**Recent Performance:**
GameStop has experienced erratic price behavior in the past week, trading in a narrow range as investors await concrete updates from the company. Despite low volume trading days, the stock managed to hold above the $22 mark, indicating buyers’ reluctance to let the price dip further amidst speculative bets on upcoming earnings. The stock's overall trend remains cautious, with lower lows avoided narrowly, leaving a window open for potential upside.
**Expert Analysis:**
Many experts are split between skepticism about GameStop’s future relevance in the modern gaming retail space and the hope for a turnaround narrative driven by e-commerce. Technical analysts emphasize the stock's close adherence to support lines near $21.40, with a notable resistance tranche between $23.00 and $23.50. Momentum indicators like RSI and MACD show mixed readings but lean toward upward potential should buying interest outpace historical trendlines.
**News Impact:**
Recent management adjustments at GameStop have garnered market interest, though skepticism remained high regarding execution capabilities. Broader market movements, particularly within growth stocks, have had indirect effects on GameStop's price action. Additionally, any meaningful updates in the company’s digital commerce strategy could act as significant catalysts.
**Trading Recommendation:**
With the price currently at $22.27 and approaching key technical resistance, traders could consider a moderately bullish stance, setting tight stop losses at $21.80 and $21.40 for risk mitigation. Upside targets of $23.10 and $23.80 align with prior resistance levels and risk-reward ratios. However, this idea hinges on positive trading momentum and sufficient volume for a sustained breakout. Consider position size adjustments if volatility increases.
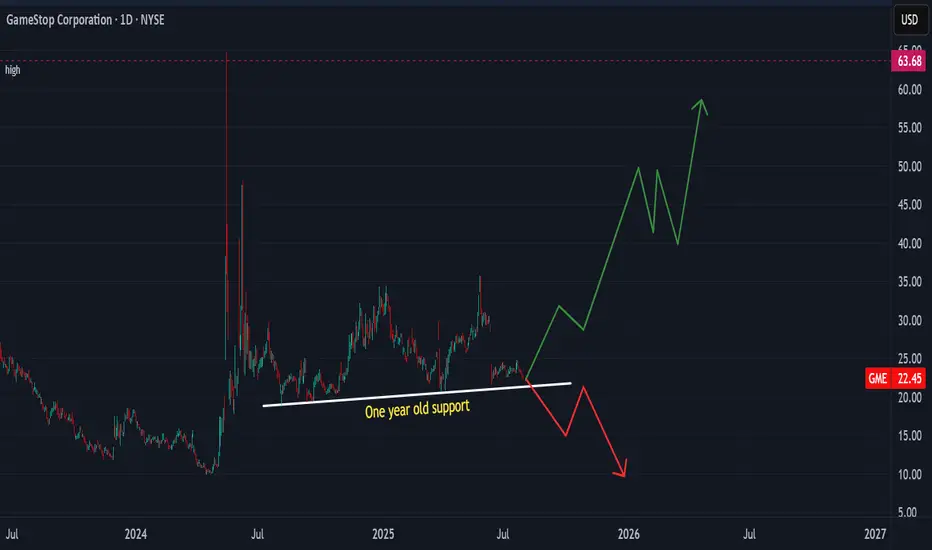
THIRD TIME IS A CHARM (SUPPORT BREAK OR FURTHER ADVANCE)Price action has been holding the one year support line from July 2024 until now. A break will see GameStop price declining further to the old support at 10.00 USD. However, price is favourably expected to rise further to test the 47.00 USD and an extension to the old high if this support holds.
Set tight stop-loss below support line.
Use reasonable margin as per account size.
Trade safe