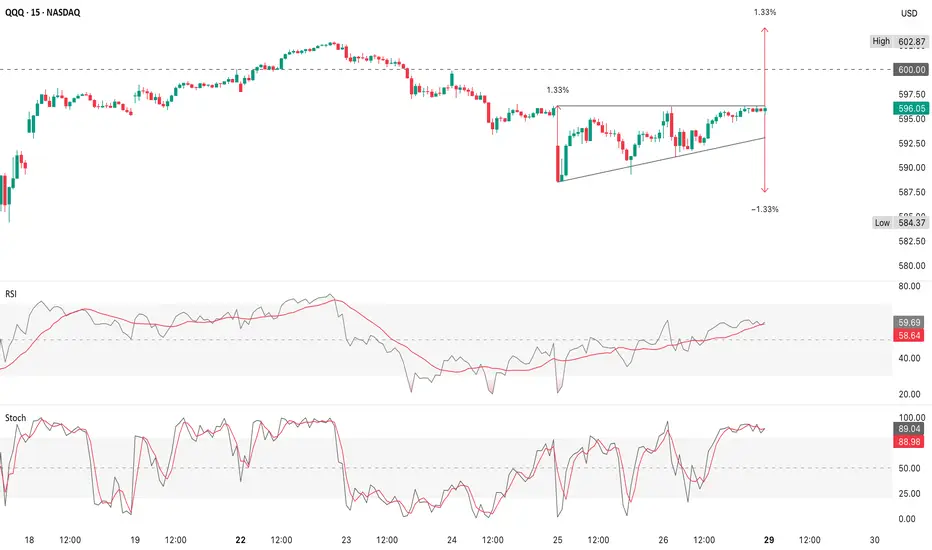
QQQ Springboard PatternThe 15m intraday chart suggests a rising wedge/ascending triangle forming under $597–$598 resistance
The measured move shown is about ±1.33% from the breakout
That puts upside potential near $603 (recent high) or downside risk toward $584–$585
RSI is around 59 - climbing, but not overbought yet
Key facts today
Key stats
About Invesco QQQ Trust Series I
Home page
Inception date
Mar 10, 1999
Structure
Unit Investment Trust
Replication method
Physical
Dividend treatment
Distributes
Distribution tax treatment
Qualified dividends
Income tax type
Capital Gains
Max ST capital gains rate
39.60%
Max LT capital gains rate
20.00%
Primary advisor
Invesco Capital Management LLC
Distributor
Invesco Distributors, Inc.
ISIN
US46090E1038
QQQ is one of the most established and actively traded ETFs in the world, albeit one of the most unusual. The product is one of a few ETFs structured as a unit investment trust. Per the rules of its index, the fund only invests in nonfinancial stocks listed on NASDAQ, and effectively ignores other sectors too, causing it to skew massively away from a broad-based large-cap portfolio. QQQ has huge tech exposure, but it is not a 'tech fund' in the pure sense either. The fund's arcane weighting rules further distance it from anything close to plain vanilla large-cap or pure-play tech coverage. The ETF is much more concentrated in its top holdings and is more volatile than our vanilla large-cap benchmark. Still, the fund has huge name recognition for the underlying index, the NASDAQ-100. In all, QQQ delivers a quirky but wildly popular mash-up of tech, growth, and large-cap exposure. The fund and index are rebalanced quarterly and reconstituted annually.
Related funds
Classification
What's in the fund
Exposure type
Electronic Technology
Technology Services
Stock breakdown by region
Top 10 holdings
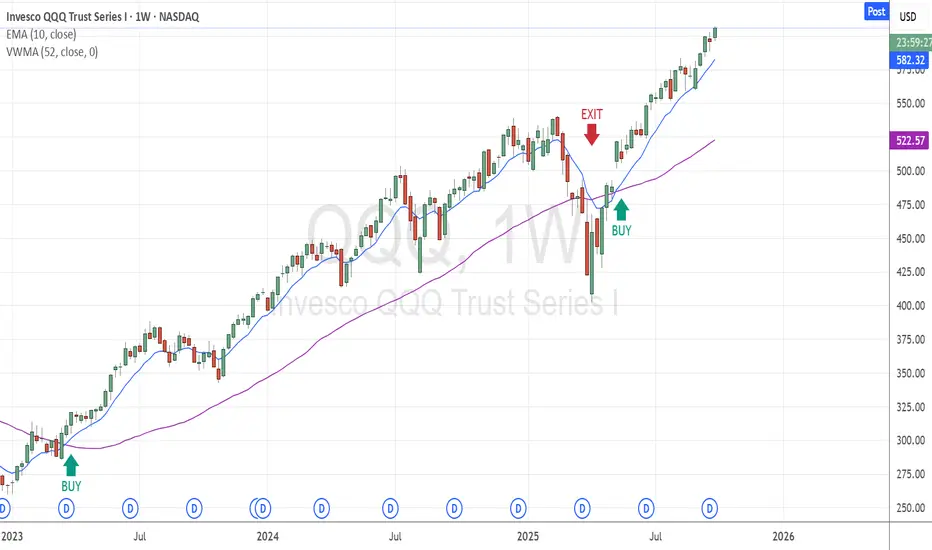
Simple Investment Strategy (Long Term only)This strategy is designed for long-term investors using a simple, two-indicator setup on the weekly chart:
• VWMA (Volume-Weighted Moving Average) – 52-period
• EMA (Exponential Moving Average) – 10-period
✅ Entry Signal (Buy)
• Enter a position when the 10-period EMA crosses above the 52-period
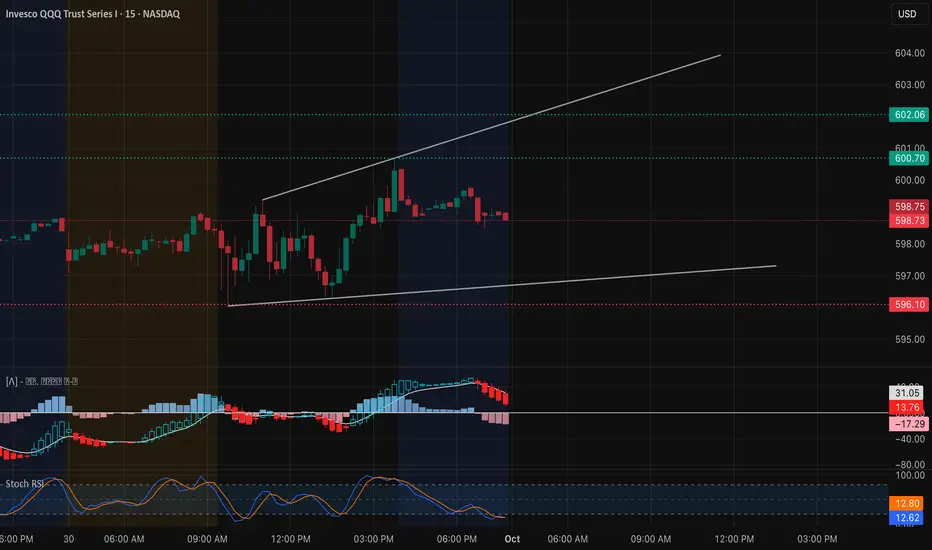
QQQ Oct. 1 – Holding $600, Gamma Pin in Play Intraday View (15-Min Chart)
QQQ has been grinding higher but is now consolidating just above the key $600 handle. The wedge channel shows buyers defending dips, though MACD and Stoch RSI are cooling off.
* Support Levels: $598.75, $596.10, $592.78
* Resistance Levels: $600.70, $602.06, $604.01
* In
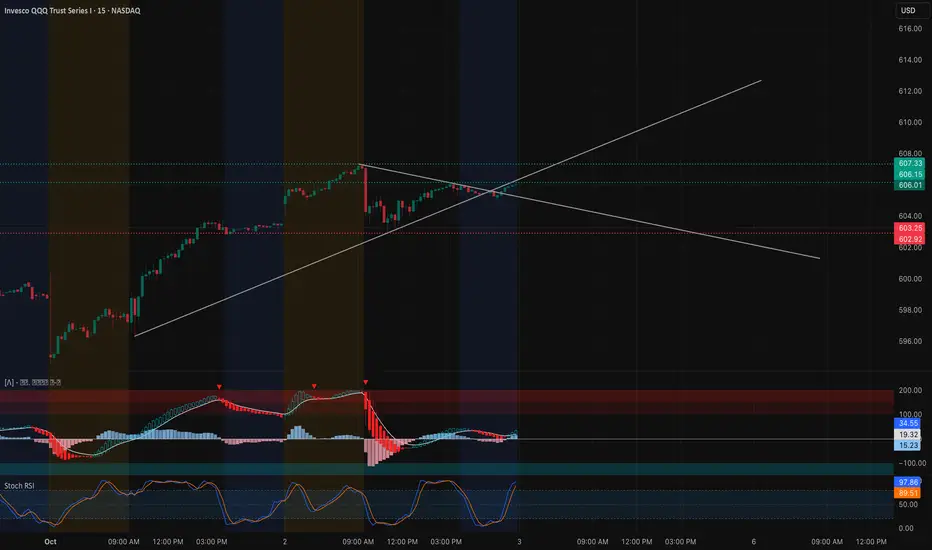
QQQ Tightening Up – Gamma Levels Will Decide Oct 3 Intraday Technical Outlook (15m Chart)
The QQQ closed near $606.01, coiling into a wedge formation after a strong upward push. On the 15-minute chart, the price is sitting right at a confluence of support and resistance trendlines:
* MACD: Starting to recover after a bearish dip, showing early signs
QQQ Daily AnalasysQQQ is in a short-term pullback inside a long-term uptrend. Watch 582–578 support for signs of a bounce. A breakdown could target 559–560. Upside resistance is 594–602.
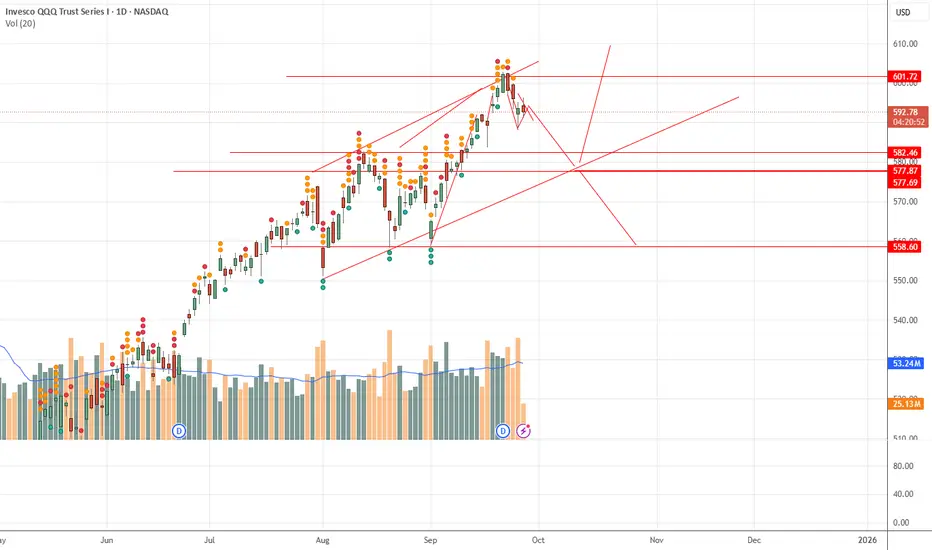
QQQ SEP-OCT 2025QQQ is consolidating near the upper resistance zone after hitting 5.5B volume. Strong supports are at 570 and 530, with a critical open gap around 490 that could act as a magnet if momentum fades. Institutional flows show distribution near highs, but trend support remains intact.
Upside target: 60

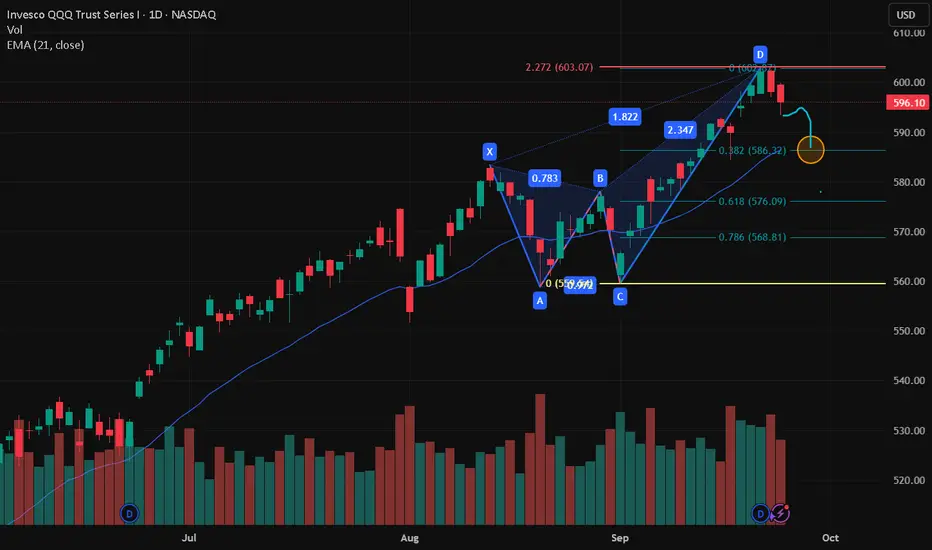
$QQQ completed 2.272% extensionNASDAQ:QQQ completed a 2.272% extension and reached the max of the Harmonic Pattern. I'm a Long only investor. I have sold some NASDAQ:QQQ every day since $593 to raise cash.
Huge Dark Pools and Prints... Will this time be Different?Stock Market Forecast | Mag 7 TSLA NVDA AAPL AMZN
QQQ CME_MINI:NQ1! CME_MINI:ES1! SP:SPX NASDAQ:NDX stock market Forecast

$QQQ Tomorrow’s Trading Range 9.26.25
This is tomorrow’s trading range for SPX - Look at that Island gap in the upper part. What do you think? End of the rally?
Rates were cut, equities are overvalued and it’s time to reverse this beast. Just my opinion - trade the chart not my opinion.
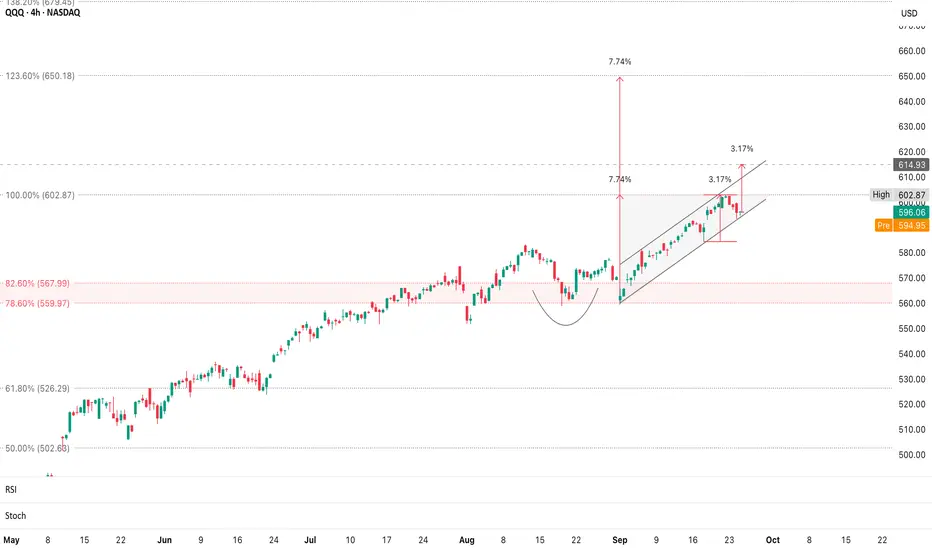
QQQ Channel SupportQQQ is consolidating after a strong rally & holding the rising channel keeps upside targets alive, but a breakdown risks a retrace to mid-$560s
If QQQ holds the channel and clears $602.87, the extension target is $650+ (123.6% Fib)
A break below the channel and $595 could pull back to $560–$567
See all ideas
Displays a symbol's price movements over previous years to identify recurring trends.
Frequently Asked Questions
An exchange-traded fund (ETF) is a collection of assets (stocks, bonds, commodities, etc.) that track an underlying index and can be bought on an exchange like individual stocks.
NDQ assets under management is 328.44 B EUR. AUM is an important metric as it reflects the fund's size and can serve as a gauge of how successful the fund is in attracting investors, which, in its turn, can influence decision-making.
Since ETFs work like an individual stock, they can be bought and sold on exchanges (e.g. NASDAQ, NYSE, EURONEXT). As it happens with stocks, you need to select a brokerage to access trading. Explore our list of available brokers to find the one to help execute your strategies. Don't forget to do your research before getting to trading. Explore ETFs metrics in our ETF screener to find a reliable opportunity.
NDQ invests in stocks. See more details in our Analysis section.
NDQ expense ratio is 0.20%. It's an important metric for helping traders understand the fund's operating costs relative to assets and how expensive it would be to hold the fund.
No, NDQ isn't leveraged, meaning it doesn't use borrowings or financial derivatives to magnify the performance of the underlying assets or index it follows.
Yes, NDQ pays dividends to its holders with the dividend yield of 0.47%.
NDQ shares are issued by Invesco Ltd.
NDQ follows the NASDAQ 100 Index. ETFs usually track some benchmark seeking to replicate its performance and guide asset selection and objectives.
The fund started trading on Mar 10, 1999.
The fund's management style is passive, meaning it's aiming to replicate the performance of the underlying index by holding assets in the same proportions as the index. The goal is to match the index's returns.