$SHOP: Higher Low and Flat Base Set-UpOverview of Recent Price Action
SHOP recently experienced a pullback of approximately 25% from its all-time high (ATH). Such retracements are a typical pattern for stocks that have been in a sustained long-term uptrend. The recent dip allowed the stock to reset its base, which means that any subseq
Next report date
—
Report period
—
EPS estimate
—
Revenue estimate
—
1.89 CAD
2.77 B CAD
12.17 B CAD
1.22 B
About Shopify Inc.
Sector
CEO
Tobias Albin Lütke
Website
Headquarters
Ottawa
Founded
2004
ISIN
CA82509L1076
FIGI
BBG008P8T6V8
Shopify, Inc. is a global commerce company that provides essential internet infrastructure for commerce, offering trusted tools to start, scale, market, and run a retail business of any size. The Company's software enables merchants to run their business across all of their sales channels, including web and mobile storefronts, physical retail locations, social media storefronts and marketplaces. The Shopify platform provides merchants with a single view of their business across all of their sales channels and enables them to manage products and inventory, process orders and payments, fulfill and ship orders, build customer relationships, source products, leverage analytics and reporting and access financing, all from one integrated back office. The company was founded on September 28, 2004 and is headquartered in Ottawa, Canada.
Related stocks

Shopify (NYSE: $SHOP) Hit by Cyber Monday OutageShopify (NYSE: NASDAQ:SHOP ) faced a major disruption on Cyber Monday as thousands of merchants were unable to log in or access point-of-sale systems during the busiest online shopping day of the year. The outage peaked around 11 a.m. EST, with more than 4,000 reports on Downdetector. Shopify confi

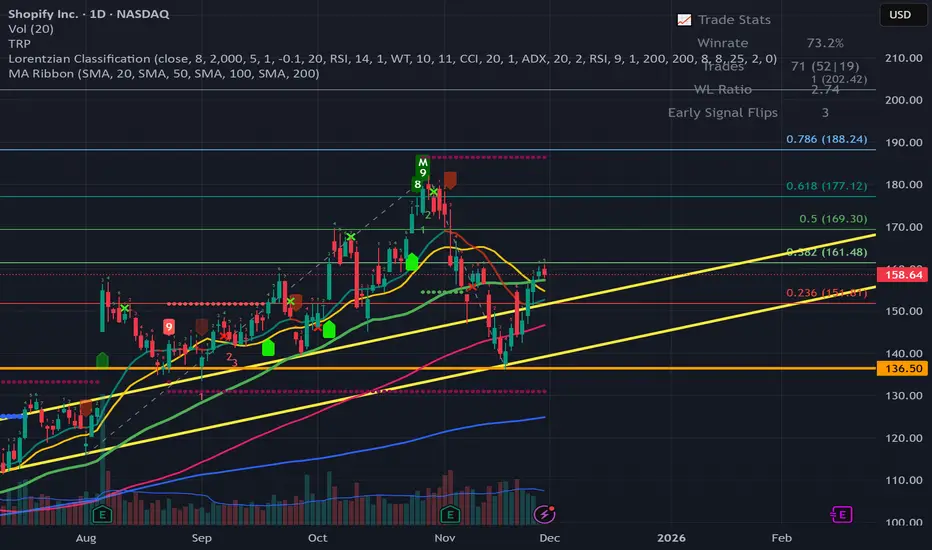
SHOP - Find a Support on Long Term Trend ChanelHello Everyone, Followers,
SHOPIFY is 3rd one for today.
Shopify maintains a healthy structure inside its ascending trend channel.
🔍 Chart Highlights
- Price bounced strongly from the lower yellow trendline, defending long-term structure.
- SHOP is now facing resistance at 161 next resistanc
Shopify bullish sentiment setting up for short-term gainsCurrent Price: $145.56
Direction: LONG
Confidence Level: 58% (Given the weak but present bullish cues from X sentiment combined with the absence of bearish conviction from professional traders, my confidence is modest but leaning to the upside)
Targets:
- T1 = $148.50
- T2 = $151.00
Stop Levels:
Shopify Breakout of ChannelShopify NASDAQ:SHOP is painting a breakout on the daily timeframe from the descending channel.
The next area of resistance is sitting right at the mid-channel trendline of the ascending channel.
Watch for the first test at around 165, clearing the path to the main target around 195 at the top of

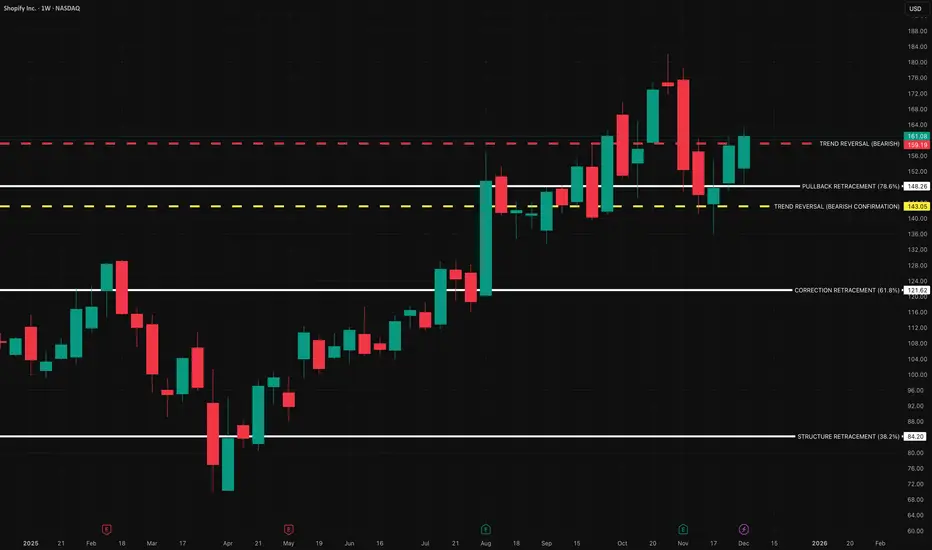
$SHOP | COVERAGE INITIATED — Personal Position Update [W49]COVERAGE INITIATED — Bullish Classification (Trend Shift Identified)
SHOP — WEEK 49 TREND REPORT | 12/05/2025
Ticker: NASDAQ:SHOP
Timeframe: W
This is a reactive structural classification of SHOP based on the weekly chart as of this timestamp. Price conditions are evaluated as they stand
Shop inverse H&S to 250Shopify has printed an inverse head and shoulders pattern. Look for a rise to the psychological level of 250 before resistance and possibly higher (indicated on the chart by the vertical "B" line).

SHOP in BUY ZONEMy trading plan is very simple.
I buy or sell when at either of these events happen:
* Price tags the top or bottom of parallel channel zones
* Money flow volume spikes beyond it's Bollinger Bands
So...
Here's why I'm picking this symbol to do the thing.
Price in buying zone at bottom of channe

Shopify is holding its ground within a strong ascending channelShopify Inc. NASDAQ:SHOP is holding its ground within a strong ascending channel on the daily timeframe.
After facing resistance near $250, price pulled back to retest the lower boundary of the channel around $223, a level that could now act as key support.
As long as it stays above this trendli

SHOP QuantSignals V3 Earnings 2025-11-03SHOP QuantSignals V3 Earnings 2025-11-03
SHOP Earnings Signal | 2025-11-03
• Direction: NEUTRAL | Confidence: 55%
• Entry Plan: Open | Expiry 2025-11-07
• Strike Focus: $167.50
• Entry Range: $7.55
• Target 1: $11.03
• Stop Loss: $5.15
• Implied Move: $20.75 (12.0%)
• 24h Move: -2.15%
• Flow Intel:

See all ideas
Summarizing what the indicators are suggesting.
Neutral
SellBuy
Strong sellStrong buy
Strong sellSellNeutralBuyStrong buy
Neutral
SellBuy
Strong sellStrong buy
Strong sellSellNeutralBuyStrong buy
Neutral
SellBuy
Strong sellStrong buy
Strong sellSellNeutralBuyStrong buy
An aggregate view of professional's ratings.
Neutral
SellBuy
Strong sellStrong buy
Strong sellSellNeutralBuyStrong buy
Neutral
SellBuy
Strong sellStrong buy
Strong sellSellNeutralBuyStrong buy
Neutral
SellBuy
Strong sellStrong buy
Strong sellSellNeutralBuyStrong buy
Displays a symbol's price movements over previous years to identify recurring trends.
Frequently Asked Questions
The current price of SHOP is 222.78 CAD — it has decreased by −1.72% in the past 24 hours. Watch Shopify, Inc. Class A stock price performance more closely on the chart.
Depending on the exchange, the stock ticker may vary. For instance, on TSX exchange Shopify, Inc. Class A stocks are traded under the ticker SHOP.
SHOP stock has fallen by −0.69% compared to the previous week, the month change is a −1.63% fall, over the last year Shopify, Inc. Class A has showed a 39.93% increase.
We've gathered analysts' opinions on Shopify, Inc. Class A future price: according to them, SHOP price has a max estimate of 281.67 CAD and a min estimate of 171.57 CAD. Watch SHOP chart and read a more detailed Shopify, Inc. Class A stock forecast: see what analysts think of Shopify, Inc. Class A and suggest that you do with its stocks.
SHOP reached its all-time high on Oct 29, 2025 with the price of 253.10 CAD, and its all-time low was 2.59 CAD and was reached on Feb 12, 2016. View more price dynamics on SHOP chart.
See other stocks reaching their highest and lowest prices.
See other stocks reaching their highest and lowest prices.
SHOP stock is 2.94% volatile and has beta coefficient of 3.62. Track Shopify, Inc. Class A stock price on the chart and check out the list of the most volatile stocks — is Shopify, Inc. Class A there?
Today Shopify, Inc. Class A has the market capitalization of 290.02 B, it has increased by 1.86% over the last week.
Yes, you can track Shopify, Inc. Class A financials in yearly and quarterly reports right on TradingView.
Shopify, Inc. Class A is going to release the next earnings report on Feb 18, 2026. Keep track of upcoming events with our Earnings Calendar.
SHOP earnings for the last quarter are 0.48 CAD per share, whereas the estimation was 0.47 CAD resulting in a 1.78% surprise. The estimated earnings for the next quarter are 0.70 CAD per share. See more details about Shopify, Inc. Class A earnings.
Shopify, Inc. Class A revenue for the last quarter amounts to 4.01 B CAD, despite the estimated figure of 3.83 B CAD. In the next quarter, revenue is expected to reach 5.04 B CAD.
SHOP net income for the last quarter is 363.61 M CAD, while the quarter before that showed 1.25 B CAD of net income which accounts for −71.00% change. Track more Shopify, Inc. Class A financial stats to get the full picture.
No, SHOP doesn't pay any dividends to its shareholders. But don't worry, we've prepared a list of high-dividend stocks for you.
As of Dec 7, 2025, the company has 8.1 K employees. See our rating of the largest employees — is Shopify, Inc. Class A on this list?
EBITDA measures a company's operating performance, its growth signifies an improvement in the efficiency of a company. Shopify, Inc. Class A EBITDA is 2.41 B CAD, and current EBITDA margin is 15.78%. See more stats in Shopify, Inc. Class A financial statements.
Like other stocks, SHOP shares are traded on stock exchanges, e.g. Nasdaq, Nyse, Euronext, and the easiest way to buy them is through an online stock broker. To do this, you need to open an account and follow a broker's procedures, then start trading. You can trade Shopify, Inc. Class A stock right from TradingView charts — choose your broker and connect to your account.
Investing in stocks requires a comprehensive research: you should carefully study all the available data, e.g. company's financials, related news, and its technical analysis. So Shopify, Inc. Class A technincal analysis shows the buy rating today, and its 1 week rating is buy. Since market conditions are prone to changes, it's worth looking a bit further into the future — according to the 1 month rating Shopify, Inc. Class A stock shows the buy signal. See more of Shopify, Inc. Class A technicals for a more comprehensive analysis.
If you're still not sure, try looking for inspiration in our curated watchlists.
If you're still not sure, try looking for inspiration in our curated watchlists.