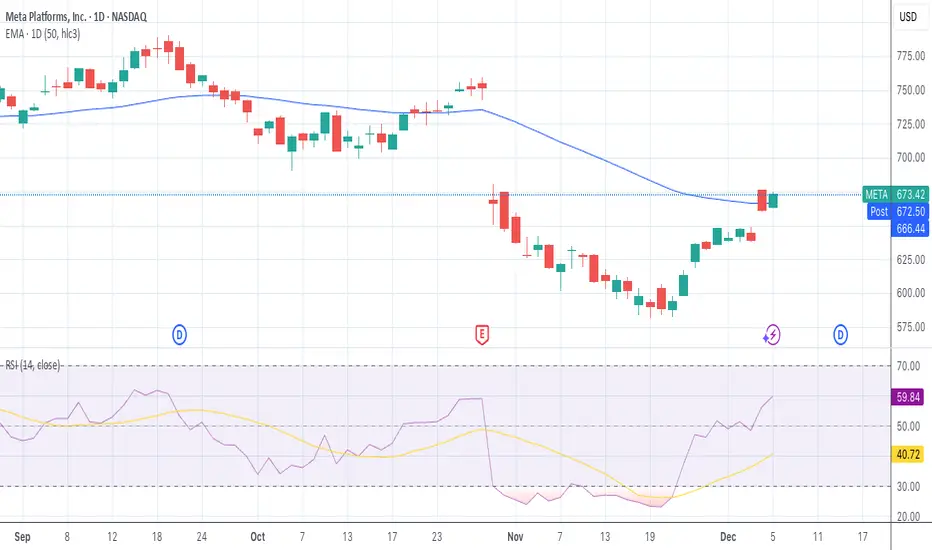
Meta came back on track ?Short Answer "Not Really"
however, the recent closing prices seem to remain below the 50‑day SMA, which suggests the trend is not clearly “recovered” yet.
In other words: there might be short‑term bullish momentum, but it’s not yet confirmed by a sustained close above the 50‑day average — the usual threshold many technicians watch.
Takeaway (technical): META seems to be in a sort of “neutral to slightly bullish long-term, but under pressure medium‑term” zone. It’s not decisively broken out — but if it climbs above and sustains above the 50‑day SMA, many technical analysts might view that as a bullish trigger.
Meta Platforms Inc Shs -A CAD hedged- Canadian Depositary Receipt Repr Shs Reg S
No trades
Trade ideas
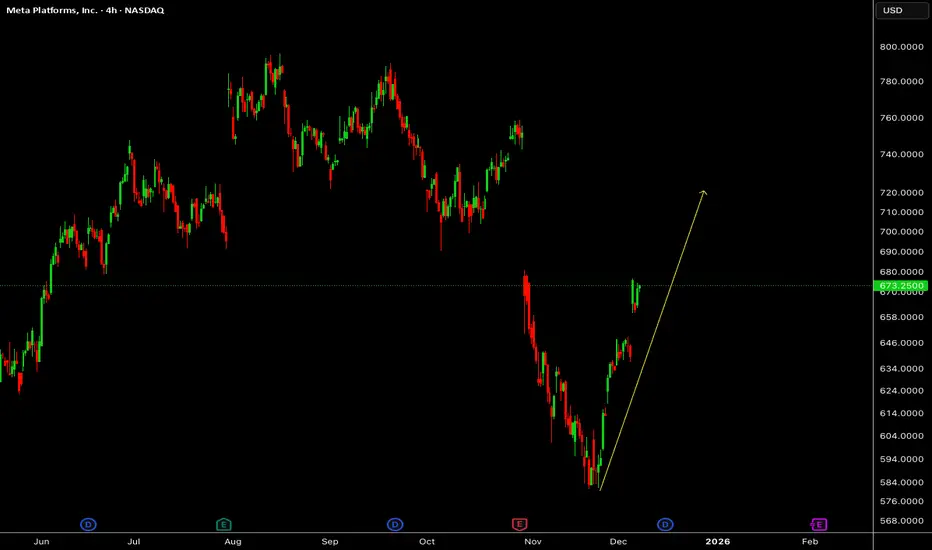
Meta Wave Analysis – 3 December 2025
- Meta reversed from support zone
- Likely to rise to resistance level 700.00
Meta recently reversed up from the support zone between the round support level 600.00 and the support trendline of the daily Down Channel from July.
The upward reversal from this support zone started the active short-term impulse wave 1 of the intermediate impulse wave (C).
Meta can be expected to rise further to the next round resistance level 700.00 (former monthly low from July and October).

META Bearish Edge Play: Katy AI Predicts Downtrend Despite BulliMETA Weekly Signal | 2025-12-08
Instrument: META
Direction: PUT (Short Bias)
Strike Price: $660.00
Expiry: 2025-12-12 (4 days)
Entry Range: $6.45 – $6.55 (mid $6.50)
Target 1: $10.32 (60% gain)
Target 2: $13.50 (109% gain)
Stop Loss: $4.50 (30% loss)
Position Size: 3% of portfolio
Confidence: 65% (Medium)
Risk Level: MODERATE
🧠 Analysis Summary
Katy AI: Predicts consistent downward trajectory; short-term pullbacks to ~$638.86 (-4.11%)
Technical: Current price $666.25 below VWAP $668.30; weekly momentum neutral; 2-week performance negative (-0.63%); RSI oversold at 28.6
News Sentiment: Mixed; sector rotation away from mega-caps, AI news favors NVDA/SoftBank
Options Flow: Extremely bullish PCR 0.36 → contrarian put opportunity; unusual activity at $980 call
⚡ Trade Rationale
Contrarian play vs. bullish options flow
Katy AI’s precise bearish trajectory provides timing edge
Balanced delta selection (0.4–0.6) mitigates risk
Tight stop loss protects against low VIX volatility compression
⚠️ Notes
Katy confidence moderate (50%) → reduce position size
Monitor VIX for volatility expansion opportunities
Aggressive call flow at $980 may create gamma risk if momentum reverses

Waiting for correction. and then buy in declineIdeal buy price : 570
SL : 525
Target : 990, 1308
Manage your risk.
It is at trap zone. It can rise to 708 then it may be fallen to ideal price levels 570-550.
Let's see.

$META | COVERAGE INITIATED — Personal Position Update [W49]COVERAGE INITIATED — Bullish Classification (Trend Shift Identified)
META — WEEK 49 TREND REPORT | 12/05/2025
Ticker: NASDAQ:META
Timeframe: W
This is a reactive structural classification based on the weekly chart as of this timestamp. Price conditions are evaluated as they stand — nothing here is predictive or forward-assumptive.
⸻
Author’s Note — Personal Position Update
I initiated my own position on [ NASDAQ:META ] during Week [ 49 ], entering at $ [ 673.42 ].
This decision follows my personal criteria: I only participate when my system identifies a verified structural trend shift supported by both a confirmed weekly flag and a qualifying candle state. This note reflects my activity only and is not a suggestion for anyone else.
As of this update, my position is currently up ~ [ 0% ] from my entry.
My structural exit level is $ [ 670.20 ] on a weekly-close basis. This level will continue to adjust upward automatically as the structure strengthens. If price closes below that threshold, my system classifies the trend as structurally compromised, and that is where I personally exit.
This update exists solely to document my own participation and the structural levels I monitor. It is not predictive and does not imply any future outcome.
⸻
Structural Integrity
• 1) Current Trend Condition [ Numbers to Watch ]
• Current Price @ $
• Trend Duration @ +0 Weeks
( Bullish )
• Trend Reversal Level ( Bearish ) @ $
• Trend Reversal Level ( Bearish Confirmation ) @ $
• Pullback Correction Retracement @ $
• Correction Structural Support @ $
⸻
2) Structure Health
• Retracement Phase:
Uptrend (operating above 78.6%)
• Position Status:
Caution (interacting with structural layers)
⸻
3) Temperature :
Warming Phase
⸻
4) Momentum :
Neutral
⸻
Structural Alignment
NEUTRAL STRUCTURAL CONDITION
This mark represents a period where directional behavior was unclear. Market movement here reflected compression, chop, or indecision — neither trend direction was dominant. It does not signal continuation or reversal, only that price action was not showing strong alignment in either direction.
⸻
Methodology Overview
This classification framework evaluates directional conditions using internal trend-interpretation logic that references price behavior relative to its structural layers. These relationships are used to identify when price movement aligns with the framework’s criteria for directional phases, transition points, or regime shifts. Visual elements or structural labels reflect these internal interpretations, rather than explicit trading signals or preset indicator crossovers. This framework is observational only and does not imply future outcomes.

META QuantSignals V3 | Moderate Risk alretMETA Swing Signal — (2025-11-28)
Instrument: META
Direction: BUY CALLS 📈
Confidence: 60% (Medium)
Horizon / Expiry: 14 days → 2025-12-12
Strike Focus: $650.00
Entry Range: $12.50 – $13.50 (mid $13.00)
Target 1: $19.00 (+50%)
Target 2: $25.00 (+100%)
Stop Loss: $8.50 (-35%)
Position Size: 3% of portfolio
Risk Level: Moderate — sector volatility and mixed technical signals
Katy AI Signal
Bullish prediction targeting $680–$700 in 14 days
Strong AI sector momentum and technical breakout potential
Katy LLM Conflict: LLM recommended CALLS, but Katy chart shows PUTS (-8.40% predicted) — medium confidence
Technical Context
Current Price: $645.62 (near session high $646.25, above VWAP $606.50)
Support: $600–$610
Resistance: $650–$660
Momentum: Bullish after 6.93% intraday gain
Market Context: STRONG_BULLISH overall; SPY & QQQ bullish
Options Flow
Put/Call Ratio 0.73 → bullish sentiment
Some hedging at $730 put, but overall call buying interest
Neutral flow bias, supports potential upside
Trade Setup & Strategy
Why This Trade: Captures AI sector momentum in large-cap tech swing play
Timing Advantage: Enter after significant intraday gain; aligns with continuation pattern
META: What’s Setting Up Next?META has recovered sharply from its recent drop, and the structure now hints at a developing continuation phase. The current climb may still be part of a broader move forming to the upside, with momentum showing signs of strength. As price builds within this emerging pattern, the next leg could unfold once the short-term consolidation completes, making this an intriguing chart to watch for follow-through.
**Disclosure:** We are part of Trade Nation's Influencer program and receive a monthly fee for using their TradingView charts in our analysis.
META — Watching for a Potential GAP Closure.Hello Everyone, Followers,
META is the second one for Today.
After disappointing financial report, It created big GAP between 742 to 680 .
The GAP is still unfilled.
Then META has shown a solid rebound after weeks of heavy selling. The chart is now structured around one key element:
🔍 Chart Highlights
- Price is now broke the 631 and closed over this level. This level is now our new Support level.
- The GAP zone around 680–700 remains open and is a magnet if momentum continues.
- The long-term yellow trend support line held beautifully — buyers stepped exactly where they should.
-A push into the GAP zone is the logical next step if META holds above 630 - 631.
🔹 Outlook
- META has room to retest the GAP area near 700–720.
- A breakout above the 50 MA strengthens this scenario. (Green Line)
- A rejection could bring the price back toward 595.
🔹 My Plan
If META closes multiple days above 631, I expect continuation into the GAP region.
If it pulls back, 595 is my key support area to watch.
If you enjoy and like clean, simple analysis — follow me for more.
This is just my thinking and it is not invesment suggestion , please do not make any decision with my anaylsis.
Have a lovelly Sunday to all and Good Start a Week.
#META #SPX500 #NASDAQ

Patience pays off? Long METAI've been patient with META. I've been wanting to go long here since earnings, but I also wanted to see if we'd get closer to the lower trendline. Luckily I waited. But I'm at a point I don't want to wait longer to start my position/trade.
The reasons:
1. That lower trendline has held since October 2022. I might do something I rarely do which is set a stop loss somewhere like $530, just in case. But I think the bulls will jump back in here.
2. Look at the MACD. The last time it looked like this, Meta went on a run from $490 to about $750.
3. There's bullish divergence starting to appear in the RSI which is also oversold at 26.5
4. For the past 2 quarters, the POC is almost exactly where we are. This volume should at least slow the drop, and potentially work as a floor to bounce off of.
I'm not planning on holding this long term, but I will if I have to.
I just bought 25% of my trade and I'll DCA 3 more red days as long as it stays above the trend line. If it drops below the trendline, I'll hold and wait to see what happens with the structure.
I have 3 targes as usual:
Take Profit 1 = $650 (I think the 200day will be there) and I'll sell 50% of my position.
Take Profit 2 = $680 (there's some volume resistance there) and I'll sell 50% of my remaining position.
Take Profit 3 = $850 or if it touches the upper trendline.
Good luck!

META — WEEK 49 TREND REPORTNASDAQ:META — WEEK 49 TREND REPORT
Ticker: NASDAQ:META — 12/02/2025 @ 647.10$
Timeframe: WEEKLY
This is a reactive structural classification of NASDAQ:META based on the weekly chart as of this timestamp. Price conditions are evaluated as they stand — nothing here is predictive or forward-assumptive.
⸻
1) Current Trend Condition
• Trend Duration: +9 weeks (Bearish)
• Trend Reversal Level (Bullish): 670.20$
• Trend Reversal Level (Bullish Confirmation): 688.75$
• Pullback Support: 645.90$
• Correction Support: 525.73$
⸻
2) Structure Health
• Retracement Phase:
Correction (approaching 61.8%)
• Position Status:
Unstable (price below both structural layers)
⸻
3) Temperature :
Cooling Phase
⸻
4) Momentum :
Bearish
⸻
5) Market Sentiment
Bearish
⸻
Author’s Note
This analysis is fully reactive, not predictive. Market conditions, trend structure, and behavior are classified as they appear in real time. The objective is to identify where directional shifts first occurred, where structural integrity remains intact, and where it would begin to weaken if key levels were breached.
Predictive analysis projects outcomes that do not exist yet. Without price confirmation, prediction is built on baseless assumptions. This framework avoids that entirely by responding only to verified structural changes and live conditions.
The levels shown simply identify where the current trend structure first shifted and where it would begin to lose integrity if breached. Recognizing these boundaries allows for clearer interpretation of market behavior without relying on forward guarantees, speculative projections, or unsupported assumptions.
⸻
Methodology Overview
This classification framework evaluates directional conditions using internal trend-interpretation logic that references price behavior relative to its structural layers. These relationships are used to identify when price movement aligns with the framework’s criteria for directional phases, transition points, or regime shifts. Visual elements or structural labels reflect these internal interpretations, rather than explicit trading signals or preset indicator crossovers. This framework is observational only and does not imply future outcomes.

META Weekly QuantSignals Report — Bearish Bias DetectedMETA Weekly Trading Information
Ticker: META
Date: 2025-12-05
Model: QuantSignals V3 Weekly
Direction: BUY PUTS
Confidence: 58% (Medium)
Expiry: 2025-12-12 (7 days)
Strike Focus: $600
Entry Range: $0.15 – $0.17
Profit Target: $0.32
Stop Loss: $0.08
Weekly Momentum: NEUTRAL (-0.10%)
Options Flow: Bullish — PCR 0.32 (contrarian risk)
Risk Level: 🔴 HIGH (short-dated weekly / gamma risk)
⚠️ Katy vs LLM Conflict
LLM: BUY CALLS
Katy Prediction: BUY PUTS (-4.07% move)
Conflict Level: HIGH
➡️ Katy shows consistent bearish trajectory to $650.98.
🧠 Summary
META trades near weekly highs, showing MACD bearish divergence and Katy AI forecasting a steady decline through the week. Despite bullish options flow, sentiment may be overly optimistic. Best used as a small contrarian position due to high uncertainty.
Meta ( $META) Rises on New AI Publisher Deals & Key Support TestMeta Platforms (NASDAQ: META) gained fresh bullish momentum on Friday after announcing a series of high-profile AI content partnerships with major global publishers, including USA Today, CNN, Fox News, People Inc., The Daily Caller, Washington Examiner, and France’s Le Monde.
These agreements will enable Meta to feed real-time news updates into its AI chatbot ecosystem, deepening the company’s reach in the rapidly expanding AI-powered information market. While financial terms weren’t disclosed, the partnerships significantly elevate the quality, diversity, and timeliness of content available within Meta’s AI systems at a time when competition across the sector is intensifying.
The move also acts as a strategic counterbalance to headwinds surrounding mixed reception to Meta’s Llama 4 model and scaled-down spending on its metaverse ambitions. By redirecting resources toward AI assistants and core applications, Meta aims to strengthen engagement and remain competitive against rivals aggressively investing in similar publisher-driven content pipelines.
Analysts believe these partnerships could meaningfully enhance AI performance, improve user retention, and create new commercial pathways in Meta’s broader digital ecosystem.
Technical Analysis
The META chart reflects a healthy long-term bullish structure despite recent corrective pressure. Price has pulled back from the $796 high and is currently trading in the $670 region, with a deeper dip still possible.
The chart shows a rising trendline established since late 2023, currently aligning near the $580–$600 zone, which stands out as a high-probability support area. Should price retest this trendline and hold, META could rebound strongly toward the previous all-time high around $796, with potential continuation above that level upon breakout.

META - Weekly - Dealing With a Fibonacci LayerThe asset is currently at a crucial Fibonacci resistance layer, suggesting a near-term ceiling or range-bound trading zone, which complicates immediate price action, although the 200-day EMA appears to be the more reliable support level compared to the 100-day EMA. This technical caution is amplified by a pattern of decreased weekly volume since early 2024, mirroring the distribution phase seen before the July 2021 correction, which strongly indicates a likely, gradual correction to the $500 or potentially the $300 level. Fundamentally, the company remains robust in the long term due to strong annual net income and revenue growth, normal debt levels, and ample free cash flow and cash equivalents; however, the significant quarter-over-quarter drop in net income from Q2 2025 to Q3 2025 raises short-term skepticism about its immediate health, aligning with the bearish technical outlook for a substantial correction before the long-term fundamentals can drive the next major upswing.
Not financial advice, always do your due diligence
Leave a like👍 and/or comment💬.
We appreciate and value everyone's feedback!
- RoninAITrader

META — Setting Up for a Potential 50% Upside?META (Weekly Chart) is showing a strong technical setup after a healthy multi-week correction. Price has bounced exactly from the long-term rising trendline + 100-WMA zone — a region that has historically acted as a strong accumulation area.
🔍 Key Bullish Signals
Bullish candle forming near structural support, indicating buyers stepping in.
Price holding above major MAs: 100W, and 200W → long-term trend intact.
MACD flattening near zero-line, often a precursor to a fresh weekly bullish crossover.
A bounce from the current trendline opens room to the next Fibonacci cluster at
~$980–$1,000, which is approximately +50% from current levels.
🎯 Upside Projection
Current Price: ~$648
Potential Target (Fib 2.618 extension): ~$990
➡️ Estimated Upside: ~50%
If META confirms a weekly close above the current range resistance, the path toward higher Fib zones becomes technically valid.

META – Weekly Chart📈 META – Weekly Chart Overview
A technical rebound may be starting to form.
Several signals from The Wave system are aligning:
✅ Price in the buy zone
META has retraced into a historically strong demand area, perfectly overlapping with the Wave buy signal zone.
This region has acted as a springboard multiple times in the past.
✅ Undervaluation on higher timeframes
The stock is currently trading near its dynamic trendline support, combined with oversold readings on momentum indicators.
This suggests the correction might be approaching exhaustion.
✅ Momentum turning
The stochastic is bottoming out exactly where previous weekly reversals occurred.
RSI also shows early signs of stabilisation.
🎯 Potential scenario
If buyers step in from this level, META could aim for the upper resistance area marked on the chart, offering an attractive risk-to-reward of 3.3 — a favourable setup for medium-term swing traders.
🛑 Invalidation
A clean break below the SL area would shift the structure and invalidate the bullish setup.
This is a textbook example of waiting for high-probability zones rather than chasing the price, discipline always pays.

looking good this bouncemaybe if NVDA dips a bit with google, the money rotates to Meta, time will tell

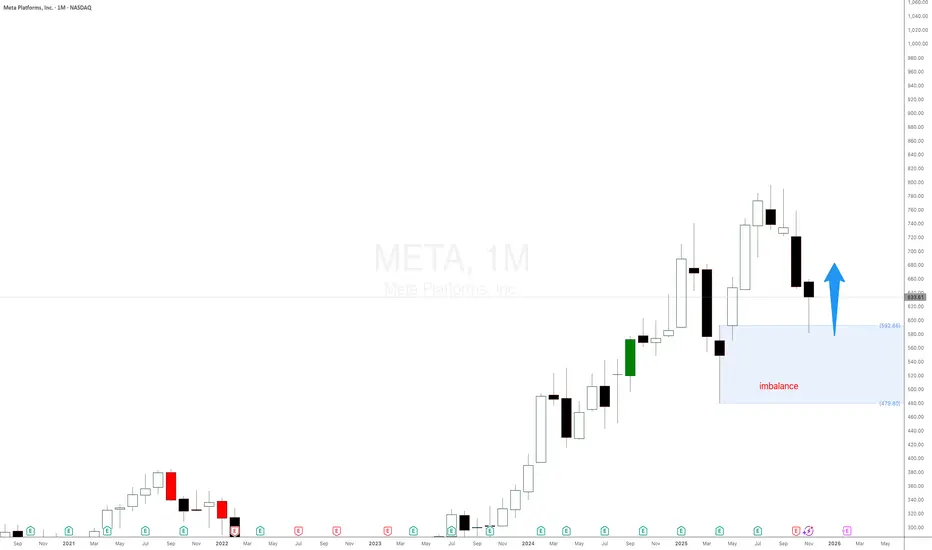
Meta Plafforms stock $META is exploding as expectedMETA Platforms NASDAQ:META is reacting nicely to the monthly demand imbalance at $592 as mentioned in the last update. Using pure supply and demand price action. META’s big drop was predictable from the monthly and weekly imbalances, and how the current reaction was part of the plan all along. Expecting a decent rally.
QuantSignals V3: META Lacks Sufficient Momentum for TradeMETA QuantSignals Katy 1M Prediction 2025-11-26
Ticker: META
Signal Type: QuantSignals Katy 1M
Date: 2025-11-26
🔍 Analysis Summary
Current Price: $636.90
Final Prediction: $636.00 (-0.14%)
30min Target: $637.62 (+0.11%)
Trend: NEUTRAL
Confidence: 42.4% (Below trade threshold)
Volatility: 12.6%
⚠️ Trade Signal
No trade signal generated
Reason: Insufficient confidence and insufficient move size
Market shows flat momentum with tight trading range.
📌 Summary
0 trade signals generated from 1 analysis.
Recommendation: Wait for stronger trend or higher confidence before entering a trade.

LONG META ~630 - TARGETING 730-750After the stock took a major hit driven by a one-time tax charge, we could see the buyers decided to come in at ~600 level, the stock was bought the whole trading day of Nov 25th, and we can see it is turning into a bullish pattern.
RR is very good here and this potentially could lead to a huge move upwards.
Target price should be previous local highs - 740-750 (Feb/Jun/Oct)
Stop should be placed bellow 600 price level, and lose of that level should signal that this was a false move.
This move can lead to a 15-18% uptrend.
BH

Nasdaq Rallies into Thanksgiving, Meta Bounce Kicks InWall Street sentiment has perked up on renewed Fed cut bets, with the Nasdaq leading the way. This has allowed Facebook to finally rally from support levels I highlighted 3 weeks ago.
Matt Simpson, Market Analyst at City Index.

META’s Run Today Was Strong — Watching These Levels for Nov 26
META had one of the cleaner intraday trends today. The move off the morning base was almost textbook: steady higher highs, shallow pullbacks, and candles riding right along that rising trendline you drew on the 15-minute chart. Whenever you get a move that smooth, it usually means the order flow is very one-sided — and judging by the absence of deep pullbacks, buyers were the ones in control all day.
But after that last push into the 635–637 zone, the pace changed. The candles started flattening out, and META began drifting sideways right under resistance. That’s usually where the market takes a breath and waits for new orders to come in. The trend is still intact — nothing about the structure looks weak — but the last few candles clearly show hesitation near the top of the day’s range.
Let heck the 1-hour GEX chart below, the hesitation makes sense. The entire area above 637 is loaded with call walls. You’ve got multiple levels stacked between 640, 645, and then 650. When price runs into heavy GEX resistance like that, it often slows down because market makers start hedging the other way. It doesn’t mean META is bearish — it just means it needs real momentum or volume to break through those overhead layers.
Below price, META actually has a pretty friendly GEX landscape. There’s solid put support around the 615–620 zone, and a deeper cushion around 592 if the market ever decides to do a full reset. That lower band is why META rarely dipped today — option structure was keeping a floor beneath it.
Going into Nov 26, the levels are straightforward:
If META can break through 637 with a decisive candle — not just a wick — then 640 becomes the next magnet. And if the stock gets enough push to chew through that, the next meaningful level is 645. That’s where the thicker call wall sits.
If META slips back under 630 and stays there, we probably see a cleaner pullback into 625 or even 620 just to cool the trend. That’s the zone where buyers likely step back in, since it lines up with both intraday structure and GEX support.
Option Trading Plan
Calls only make sense if META can actually get a clean break over 637. That’s where the air pocket sits. Between 637 and 640, META usually moves fast because there’s less hedging friction.
Puts don’t make sense unless price loses 630 with conviction. Below that, 625 and 620 become natural targets. Above 630, put premiums will get eaten alive because the overall GEX structure still favors the long side.
Disclaimer
This is just my personal view based on chart behavior and options data. It’s not financial advice — always trade your own plan and manage your risk.

Meta - $450 Target - The Next Big Short?Even though Meta is holding up in the LLM race with Llama, Meta has had a massive failure (over $70B+) on the failed Metaverse project in which is their new namesake along with now the Australian social media ban for people 16 and younger, and people realizing the intensity of the data Meta collects on people. The stronghold Meta has on social media is coming to a pause, and at the same time questions are arising on whether or not they can differentiate themselves enough having a hard time tackling growth beyond Facebook's user stagnation point and advertising. That said, short volume is increasing, and the recent bull run could be due for a correction. The MACD trading indicators show two recent pushes over short volume, and at the same time, this seems to be the top of the bullish trendline. A retracement back to $450 making this a big short is possible. As always, none of this is investment or financial advice. Please do your own due diligence and research.

$META RetracementOK y'all Meta has been on a blaze for the last week It's time for some retracement perhaps filling that gap from last Thursday's take off.
Using the Fibonacci's on the 15 min Time Frame, I have labeled the stop loss entry level (Candle must close above SL) and take profits (If wicks I take profit; Trust issues lol). If your stomach gets the tingling feeling and that dopamine kicks in take profit.
Alerts set, Happy Trading!
Happy Birthday to my best friend Staci of 25 Years!
