LMT | Lockheed Martin Could Rise Higher | LONGLockheed Martin Corp. is a global security and aerospace company, which engages in the research, design, development, manufacture, integration, and sustainment of technology systems, products, and services. It operates through the following business segments: Aeronautics, Missiles and Fire Control (MFC), Rotary and Mission Systems (RMS), and Space. The Aeronautics segment researches, designs, develops, manufactures, integrates, sustains, supports, and upgrades advanced military aircraft, including combat and air mobility aircraft, unmanned air vehicles, and related technologies. The MFC segment is involved in air and missile defense systems, tactical missiles and air-to-ground precision strike weapon systems, logistics, fire control systems, mission operations support, readiness, engineering support and integration services, manned and unmanned ground vehicles, and energy management solutions. The RMS segment designs, manufactures, services, and supports various military and commercial helicopters, surface ships, sea and land-based missile defense systems, radar systems, sea and air-based mission and combat systems, command and control mission solutions, cyber solutions, and simulation and training solutions. The Space segment includes the production of satellites, space transportation systems, and strategic, advanced strike, and defensive systems. The company was founded in 1995 and is headquartered in Bethesda, MD.
LMTN trade ideas
Trade Alert: Enter $LMT OCT 31 2025 $510 CALLSEnter: NYSE:LMT OCT 31 2025 $510 CALLS
Buy in Price: $14.95 - $17.10
Take Profit: $33.79
Stop Bleeding: $13.16
ROI Potential: 126%
Exit Within: 67 Minutes

LMT watch $459-462: Key Resistance zone break will mark BOTTOM LMT has been grinding back up since last earnings dump.
Bears almost rejected price at Resistance zone $459.44-462.68
Bulls look to have broken through it but still in a dangerous place.
Look for a swing above zone then a RETEST for long entries.
=========================================================

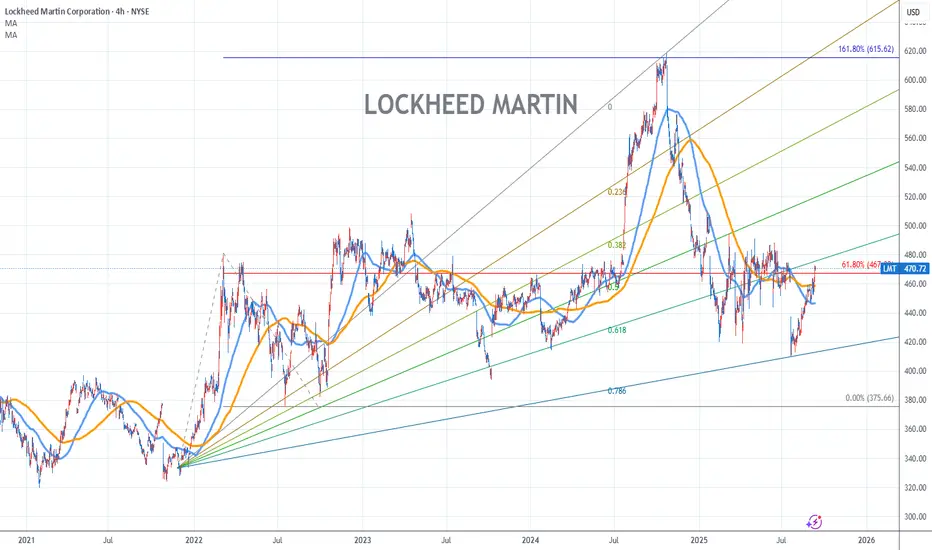
Lockheed Martin Stock Chart Fibonacci Analysis 091125
Trading Idea
1) Find a FIBO slingshot
2) Check FIBO 61.80% level
3) Entry Point > 467/61.80%
Chart time frame:B
A) 15 min(1W-3M)
B) 1 hr(3M-6M)
C) 4 hr(6M-1year)
D) 1 day(1-3years)
Stock progress:A
A) Keep rising over 61.80% resistance
B) 61.80% resistance
C) 61.80% support
D) Hit the bottom
E) Hit the top
Stocks rise as they rise from support and fall from resistance. Our goal is to find a low support point and enter. It can be referred to as buying at the pullback point. The pullback point can be found with a Fibonacci extension of 61.80%. This is a step to find an entry-level position. 1) Find a triangle (Fibonacci Speed Fan Line) that connects the high (resistance) and low (support) points of the stock in progress, where it is continuously expressed as a Slingshot, 2) and create a Fibonacci extension level for the first rising wave from the start point of the slingshot pattern.
When the current price goes over the 61.80% level, that can be a good entry point, especially if the SMA 100 and 200 curves are gathered together at 61.80%, it is a very good entry point.
As a great help, TradingView provides these Fibonacci speed fan lines and extension levels with ease. So if you use the Fibonacci fan line, the extension level, and the SMA 100/200 curve well, you can find an entry point for the stock market. At least you have to enter at this low point to avoid trading failure, and if you are skilled at entering this low point, with the fibonacci6180 technique, your reading skill of to chart will be greatly improved.
If you want to do day trading, please set the time frame to 5 minutes or 15 minutes, and you will see many of the low points of rising stocks.
If you prefer long-term range trading, you can set the time frame to 1 hr or 1 day
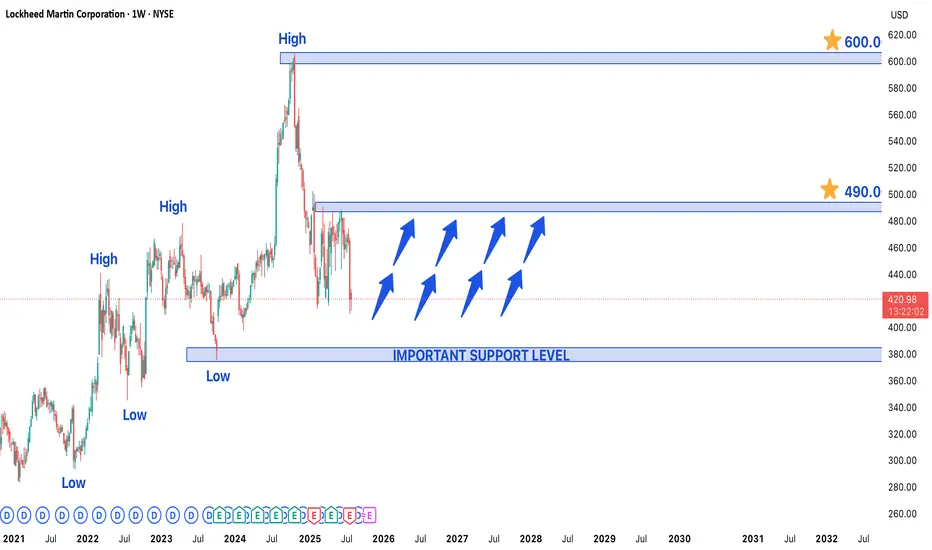
Lockheed Martin Stock in Bullish Trend - Key Levels to watchLockheed Martin (LMT) Stock in Strong Bullish Trend - Key Levels to Watch
Lockheed Martin's (LMT) stock is currently exhibiting a well-defined bullish trend, trading near a recent higher low that may serve as a crucial support level for the next upward move. The defense giant continues to benefit from robust global military spending and a strong contract pipeline, positioning the stock for potential further gains.
Technical Structure & Key Levels
- Higher Low Support: The current price zone represents a critical support area where buyers have previously stepped in, maintaining the upward trajectory
- Upside Targets:
- Near-term: $490 (previous resistance zone)
- Long-term: $600 (potential breakout extension)
- Major Support: $375 would act as strong demand zone if any deeper pullback occurs
Bullish Catalysts Supporting the Trend
1. Defense Sector Strength:
- Record US defense budget allocations for 2024-2025
- Increased NATO military spending amid global tensions
2. Contract Backlog:
- F-35 program continues to drive revenue
- Hypersonic weapons and space systems development
3. Technical Momentum:
- Price trading above key moving averages (50/200 DMA)
- Higher highs and higher lows confirm uptrend structure
Trading Strategy Considerations
- Optimal Entry:
- On bounces from current support level
- On breakout above $460 confirmation
- Risk Management:
- Stop-loss below $375 for longer-term positions
- Partial profit-taking near $490 resistance
- Confirmation Signals:
- Volume increase on upside moves
- Sustained closes above $460
Potential Risks to Monitor
- Geopolitical shifts affecting defense budgets
- Program delays (particularly in F-35 production)
- Broader market corrections impacting defense sector
Long-Term Outlook:
The combination of fundamental strength and technical positioning suggests LMT could progress toward $490 near-term, with $600 as a viable long-term target if the bullish structure holds. Traders should watch price action around current levels for continuation signals while remaining mindful of the $375 support as a critical level for the bullish thesis.
Lockheed Martin (LMT) Stock in Strong Bullish TrendLockheed Martin (LMT) Stock in Strong Bullish Trend - Key Levels to Watch
Lockheed Martin's (LMT) stock is currently exhibiting a well-defined bullish trend, trading near a recent higher low that may serve as a crucial support level for the next upward move. The defense giant continues to benefit from robust global military spending and a strong contract pipeline, positioning the stock for potential further gains.
Technical Structure & Key Levels
- Higher Low Support: The current price zone represents a critical support area where buyers have previously stepped in, maintaining the upward trajectory
- Upside Targets:
- Near-term: $500 (previous resistance zone)
- Long-term: $610 (potential breakout extension)
- Major Support: $375 would act as strong demand zone if any deeper pullback occurs
Bullish Catalysts Supporting the Trend
1. Defense Sector Strength:
- Record US defense budget allocations for 2024-2025
- Increased NATO military spending amid global tensions
2. Contract Backlog:
- F-35 program continues to drive revenue
- Hypersonic weapons and space systems development
3. Technical Momentum:
- Price trading above key moving averages (50/200 DMA)
- Higher highs and higher lows confirm uptrend structure
Trading Strategy Considerations
- Optimal Entry:
- On bounces from current support level
- On breakout above $460 confirmation
- Risk Management:
- Stop-loss below $375 for longer-term positions
- Partial profit-taking near $490-500 resistance
- Confirmation Signals:
- Volume increase on upside moves
- Sustained closes above $460
Potential Risks to Monitor
- Geopolitical shifts affecting defense budgets
- Program delays (particularly in F-35 production)
- Broader market corrections impacting defense sector
Long-Term Outlook:
The combination of fundamental strength and technical positioning suggests LMT could progress toward 500 near-term, with $610 as a viable long-term target if the bullish structure holds. Traders should watch price action around current levels for continuation signals while remaining mindful of the $375 support as a critical level for the bullish thesis.

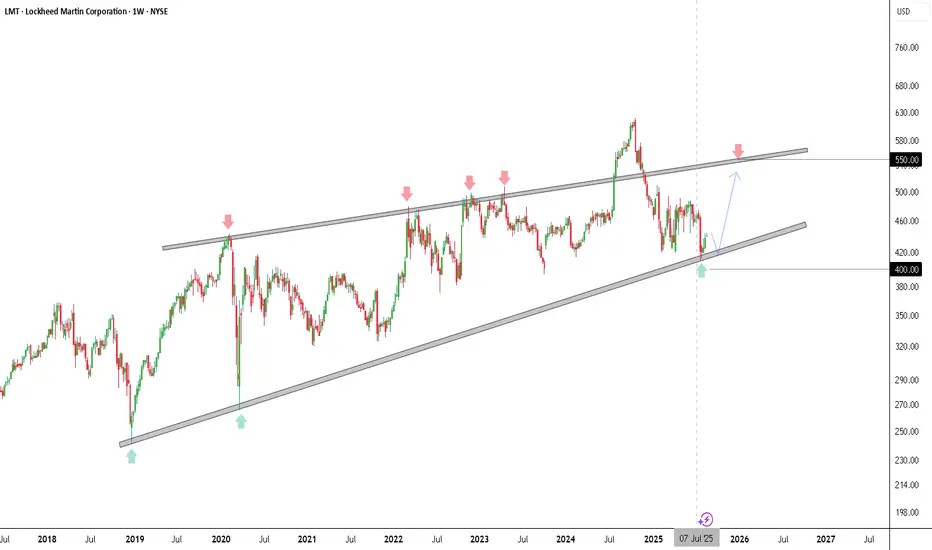
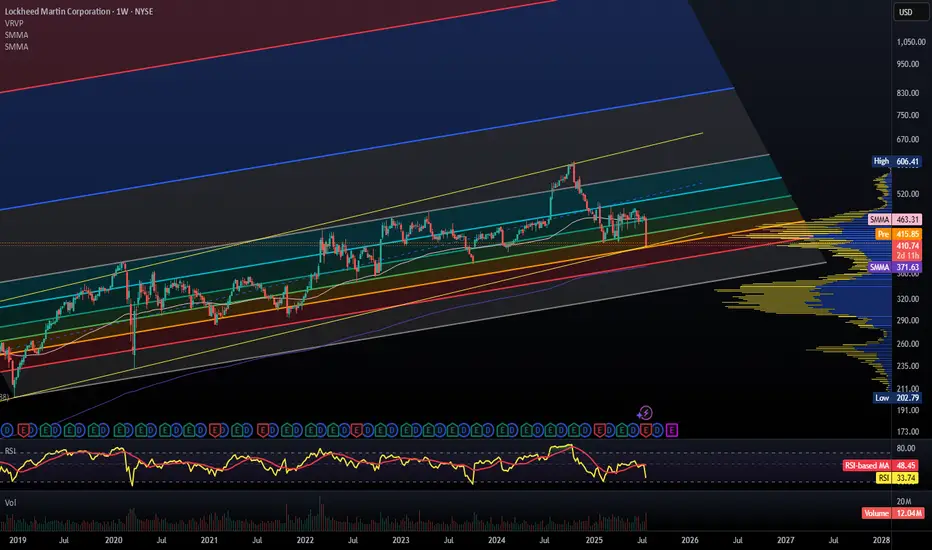
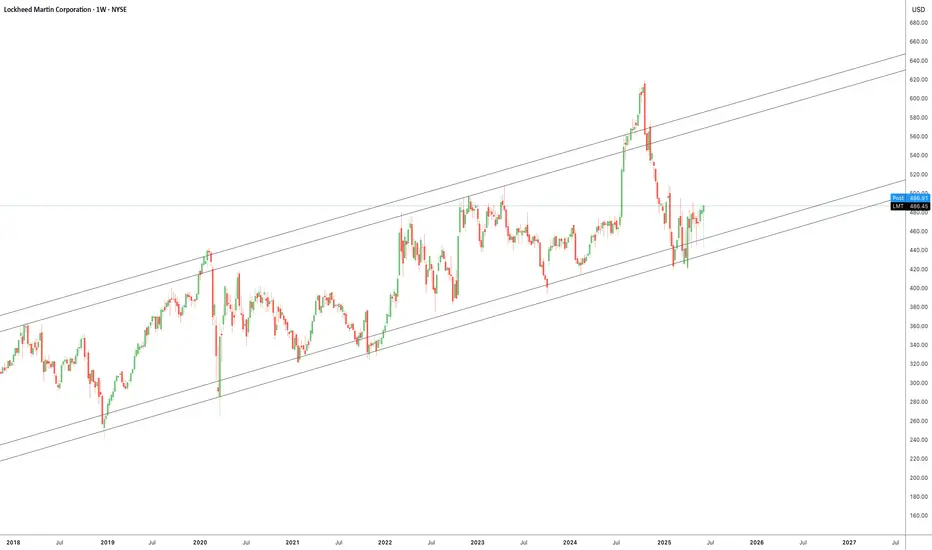
LMT Weekly Chart - Potential Bounce from Rising TrendlineThe weekly chart of Lockheed Martin (LMT) shows a well-defined rising wedge pattern, marked by multiple touches on both the upper and lower trendlines over the past several years. Price recently tested the lower trendline around $420–$430, providing a potential support area and signaling a high-probability bounce scenario. This aligns with previous historical reactions, as seen in similar touches in 2019 and 2020.
The chart suggests a potential upward move toward the upper trendline near $550, pending confirmation. Traders should watch for bullish candlestick formations or price action signals around the lower trendline to validate the entry.
Trade Setup:
Entry: Long around $430 after confirmation of support bounce.
Target Profit (TP): $550, coinciding with upper trendline resistance.
Stop Loss (SL): $400, slightly below the lower trendline to mitigate downside risk.
Timeframe: Weekly chart; ideal for swing trading.
Confirmation: Monitor for strong weekly green candles, bullish engulfing patterns, or accumulation volume signals near support.
The rising wedge pattern indicates that as long as the lower trendline holds, the bias remains bullish in the medium term. However, a decisive breakdown below $400 would invalidate this setup and signal potential deeper correction.
LMT 200 points drop from the top to last years lowBullish case:
200 point drop from the top
High volume at last year's low which coincide with the 420 zone.
Thinking this could be a bear trap below the trendline and or a fakeout.
Bearish case: Dead cat bounce amid peace talks to end the Ukraine war and last attempt to stay above the trendline amid the weekly bear flag.
Conclusion: I lean toward the bullish side as the volume spike at last year's low is a good zone for bulls to show up.
iCurlyCae | Free Trade IdeaDisclaimer: I am not a financial advisor and this is, in no way, financial or trading advice. I am simply sharing options trading strategies that I use, and have been successful with in the stock market. This presentation is for entertainment and educational purposes only. There are significant financial risks involved with trading and I am not responsible for your losses in the market should you decide to utilize the information and/or strategies discussed within this presentation. By choosing to proceed you are acknowledging your understanding of this disclaimer.

LMT back to strong supportBy my technical analysis we can expect LMT to bounce back by 10-15% at least.
Lockheed 25-07-14 - 467 USD - moving higherLockheed with high demand for following products:
- Himars
- F -35
- rockets for Patriot System
Gap around 540 USD. Moving average preparing for golden cross.
Expect 540 USD within 12 Months.
LMT – Long Setup IdeaLMT – Long Setup
Current: \$463.01 | Premarket: \$464.01 (+0.22%)
---
📊 Why I’m Eyeing the Long:
✅ Strong base at \$450–460 – buyers defending this level hard for months. Solid floor.
✅ Premarket green after red day = possible bounce play incoming.
✅ Deutsche Bank PT \$472 – not huge, but confirms it’s not dead weight.
✅ Defense sector = safety play in choppy markets. War tension = bullish tailwind.
✅ Low vol + tight range = setup for breakout. Watching for volume push.
---
🎯 Trade Plan:
• Entry: $460–464 zone
• Short- Term TP: $480
• Medium-Term TP: $500+
• SL: Clean below $450 (tight risk)
---
📅 Earnings in 13 days – this could move early.
⚠️ Watch volume at open.
---
Just my setup – trade your plan. Let’s see what the tape gives us.

Buy Idea: LMT @ around $480This war is really happening right now between Israel, Iran, and the United States.
Because of this, countries are spending more money on weapons, defense systems and military gear.
The U.S. and its friends are about to increase their defense budgets and Lockheed Martin is one of the biggest companies that supplies fighter jets, missiles, and radar systems.
A buy signal just appeared near $480 and the stock has strong support around $454. That means it has a good chance of going up without falling too much. If this uptrend continues, we could see the price go back to $600 or even higher.
This is a good time to buy because everything is working in Lockheed’s favour right now.
The war is growing, defence spending is rising and national security is a big topic. Lockheed could also win more government contracts soon.

U.S. – Iran Tensions: How Geopolitics Could Rattle the MarketsRising tensions between the United States and Iran are once again casting a shadow over global markets. From oil prices to defense contractors and transport stocks, this situation has the potential to ignite volatility across several key sectors.
🔍 What Traders Should Watch:
Oil & Energy Stocks – If conflict escalates, crude oil prices could spike due to potential supply disruptions in the Strait of Hormuz, a vital chokepoint. Keep an eye on:
XOM (ExxonMobil)
CVX (Chevron)
SLB (Schlumberger) – oil services could ride the volatility.
Defense & Aerospace – Rising geopolitical risk often boosts defense budgets and demand for military equipment. Critical stocks to watch:
LMT (Lockheed Martin)
RTX (RTX Corp)
NOC (Northrop Grumman)
Airlines & Transportation – Higher oil prices and risk aversion usually hit these hard:
DAL (Delta)
AAL (American Airlines)
FDX (FedEx)
Gold & Safe Havens – In uncertain times, money often flows into safer assets:
GLD (Gold ETF)
TLT (20+ Year Treasury Bond ETF)
📊 This setup could offer both long and short opportunities depending on your strategy. Stay updated on news and technical levels to avoid getting caught on the wrong side of the move.
💬 What sectors do you think will benefit the most if this tension escalates? Drop your thoughts below 👇
🛑 Disclaimer: This is not financial advice. Always do your own research before investing.

What happens when war whispers... and Wall Street listens? 🦅🔥
"🌍 📉📈
Lockheed Martin ( NYSE:LMT ) just pierced through a tightening triangle 🔺— like a fighter jet breaking the sound barrier ✈️💥
Coincidence? 🤔 Or is this price action a signal of something brewing behind the scenes? 🕵️♂️
⚔️ Global tension is rising.
💰 Defense budgets are booming.
And NYSE:LMT ?
Quiet no more. 📢
🎯 Trade Setup:
📌 Entry: $470.50
📈 Target: $481+
🛑 Stop-loss: Below trendline
The chart speaks 📊. The world watches 🌐.
👁️🗨️ Are you paying attention?
#LMT #DefenseStocks #StockBreakout #WarTrade #TradingWithEdge #MarketMoves #Geopolitics #TradingViewSetup

LMT longforming an ascending Triangle. Looking for that breakout. With the current war news. This is looking very bullish.
Taking some option calls and holding till my target of $490-500. Thats just me. DO YOUR OWN RESEARCH PLEASE! this is not advise just my thoughts on LMT.
How will Israel-Iran war affect Lockheed Martin?Why LMT Could Go Up
Defense Stocks Rally on Tensions
-LMT surged ~3–4% recently after Israel’s major strike on Iran’s nuclear facilities, similar to gains seen in other defense names like RTX and Northrop Grumman.
F-35 & Advanced Weapons in Spotlight
-Israel deployed its F‑35I Adir (built by Lockheed) in the strike, demonstrating the jet’s central role in modern military operations.
-With growing international demand for advanced fighters and missile systems, sales could accelerate.
Backlog & Contract Strength
-LMT carries a massive order backlog (~$55 billion), recently securing large contracts like Patriot missile updates and naval systems—critical as global militaries boost budgets .
Analyst Upgrades
-JPMorgan, among others, upgraded LMT to “Buy” in response to geopolitical risk benefiting defense spending.
Risks & Headwinds
Volatility is Short-Term
-Defense stocks often jump in response to geopolitical escalation but can also retreat swiftly once tensions de-escalate .
Broader Market Pressures
-While LMT benefits directly, overall markets declined (~1–2%) and oil spiked on conflict fears—this broader risk sentiment can limit long-term flows into equities .
Execution & Budget Risk
-LMT depends on consistent defense budgets. Any shifts in U.S. or allied priorities, or cost overruns, could weigh on future growth.
Valuation Uncertainty
-Even after the recent rise, LMT trades around $486, likely pricing in many upside expectations. Limited catalysts beyond ongoing conflict could constrain further gains.
-Disclaimer: This analysis is for informational and educational purposes only and does not constitute financial advice, investment recommendation, or an offer to buy or sell any securities. Stock prices, valuations, and performance metrics are subject to change and may be outdated. Always conduct your own due diligence and consult with a licensed financial advisor before making investment decisions. The information presented may contain inaccuracies and should not be solely relied upon for financial decisions. I am not personally liable for your own losses, this is not financial advise.

Lockheed Martin (LMT): Defense Supercycle + Trend ContinuationOverview Summary
Lockheed Martin ( NYSE:LMT ), one of the largest defense contractors globally, is entering a critical inflection point, both technically and geopolitically. With rising global conflict risk and structural shifts in defense spending, Green Zone Capital is re-accumulating long-term positions across the defense sector, particularly in LMT.
Recent geopolitical escalations, such as the ongoing Russia–Ukraine war, tensions between Israel and Iran, and broader global instability sparking WW3 discussions, are fueling a sustained rise in defense budgets. As a primary supplier to the U.S. Department of Defense and allied nations, LMT is uniquely positioned to benefit from this potential multi-year war cycle.
Technical Setup
LMT has traded in a clearly defined long-term rising channel for years, and it recently pulled back to the lower bounds of this channel near $450, a historically strong support level that has acted as a major accumulation zone since early 2023.
Key Technical Highlights:
Major pullback from $600 highs in late 2024
Established support zone $450 confirmed with multiple rejections
Breakout from recent consolidation structure signals momentum shift
Targeting $600–$620, the upper range of the channel, which aligns with prior highs
This bounce offers a strong risk-reward setup, especially for long-term investors seeking stability, dividends, and exposure to defense-driven macro trends.
Macro Tailwinds for LMT
Defense Supercycle: Global conflicts are shifting defense budgets upward, with NATO allies pushing toward the 2% GDP defense spending threshold.
Product Dominance: Flagship programs like the F-35, THAAD missile systems, and space assets remain top priorities for governments worldwide.
Reliable Cash Flow & Dividends: LMT generates consistent free cash flow and rewards long-term shareholders with increasing dividends.
Increased Demand for Aerospace, Satellites, and ISR systems as modern warfare requires more data, AI-powered decision support, and space-based command infrastructure.
Green Zone Capital Outlook
We believe Lockheed Martin is undervalued at current levels given the asymmetric risk profile of today’s geopolitical landscape. With defense spending likely to remain elevated through 2025–2028 and potential for prolonged global military operations, LMT offers long-term exposure to a defensive compounder with upside momentum.
This position is now part of Green Zone Capital’s defense and industrial equities allocation, and we will continue monitoring global macro catalysts and trend development. Our current outlook targets a move back toward $600+, supported by both fundamental strength and long-term technical structure.
LMT sky high rocket stock LMT has been experiencing some intense changes in geopolitical conflict for next week. Leading analysts to observe closely LMT price behavior according to avg volume. We’re al expecting LMT to rise just above $520 by next week in order to accommodate some liquidity. Keep buying if not yet more.

LMT Bull rally NOW LMT has seen major consolidation in the last month. Analysis agrees that although a rough match was felt with recent US shorting orders this was a minor bump on the road since many other project are abead and other kitties such as Germany and Italy are ramlling up defense and air capabilities. LMT is going towards $520 by next week.

LMT Short (Military)LMT is now net short on the regression break.
I am not taking this trade - It is just a good indicator of the global wars and their progress or escalation.

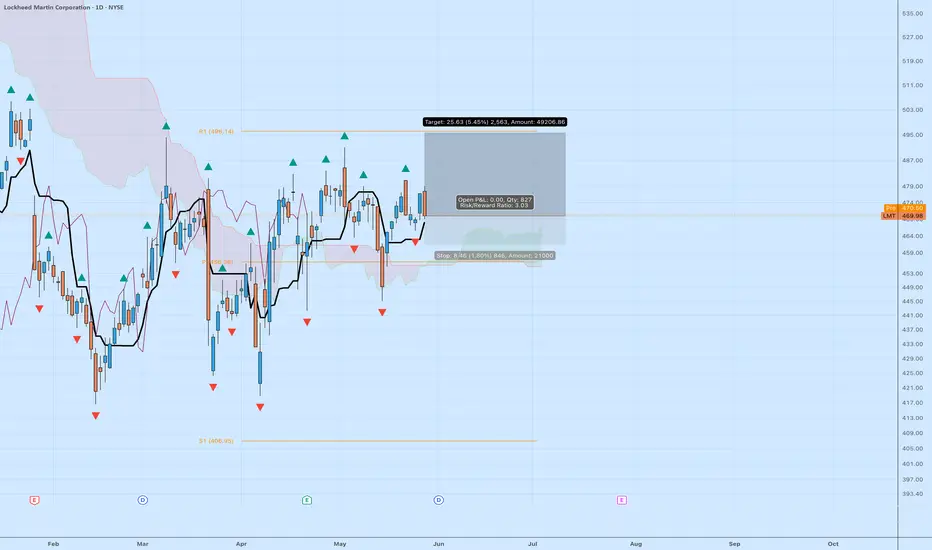
Took a Small Position in $LMT (Lockheed Martin)Spotted a solid risk/reward setup here on the daily.
✅ Entry: $469.98
🎯 Target: $495.61 (+5.45%)
🛑 Stop: $461.52 (–1.80%)
🔁 R:R = 3.03
🕹️ Trading just above the cloud with support from the base line — if momentum builds and breaks the recent resistance range, this could move fast.
Just nibbling for now, watching for confirmation before scaling.
#LMT #DefenseStocks #SwingTrade #Ichimoku #RiskReward #TradingView #StockMarket
Safe Entry LMT Currently stock price near P.High (Previous High) which acts as strong resistance, Current stock news with USA golden defense shield (wutever it called) support the stock to change tides and to start moving UP strongly.
Each Take Profit Line is where you focus and check for any selling pressure to secure your profit as swing trader if you mid term trader just wait till it hits the last Take Profit Line.
In worse case scenario if price didnt go Above Current strong resistacne (which I strongly believe it will go higher and go through it easily) the P.Low(Previous Low) Acts as Strong Support level for safest entry.
And to get in easily and safely wait for this scenario to happen:
Scenarios One: strong buying volume with reversal Candle.
Any Pre-market strong buying also Confirm the direction from current price level.
Both indicate buyers stepping in strongly. NEVER Join in unless one showed up.
Note: at Take Profit Lines Always watch out for any selling pressure to exist your position and secure profit.
