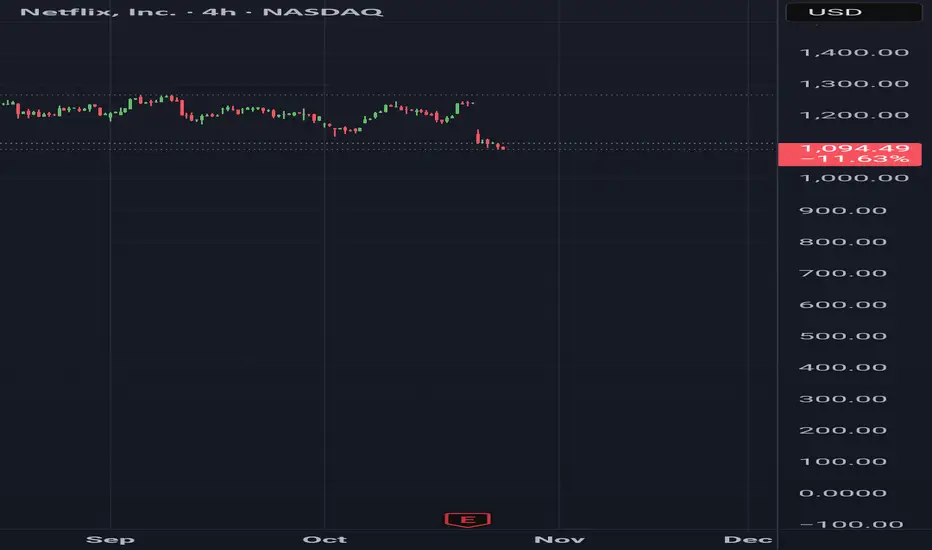
Netflix NFLX - Survive the Elon Musk onslaught?Despite all adversity Netflix still stands tall. Can NFLX show some signs of recovery after hitting EMA support? You can never count Netflix out. This company always finds a way to win. Be aware of the reverse stock split. This will drop the price to a 10 for 1 adjusted price. Then it will be more affordable for those sitting on the fence?
Trade ideas

Case Studies of Global Sustainable Investment SuccessIntroduction
Sustainable investing, also known as Environmental, Social, and Governance (ESG) investing, has rapidly evolved into a mainstream financial strategy that aligns profitability with ethical and environmental responsibility. Over the past two decades, sustainable investments have demonstrated that pursuing positive social and environmental outcomes can coexist with — and even enhance — financial performance. This shift has been driven by rising investor awareness, corporate accountability, and global commitments such as the Paris Agreement and the UN Sustainable Development Goals (SDGs). The following case studies from around the world illustrate how sustainable investing can yield both strong financial returns and measurable societal benefits.
1. Ørsted: Transforming from Oil to Renewable Energy Leadership (Denmark)
Ørsted, formerly known as Danish Oil and Natural Gas (DONG Energy), provides one of the most remarkable examples of corporate transformation toward sustainability. Once heavily dependent on fossil fuels, Ørsted made a bold decision in the early 2010s to transition to renewable energy, particularly offshore wind power.
Sustainable Strategy:
Ørsted sold its oil and gas assets, restructured its energy portfolio, and redirected capital into renewable projects. The company focused on offshore wind farms across Europe, Asia, and North America, becoming a global leader in clean energy production.
Impact:
By 2025, Ørsted aims to generate nearly 99% of its energy from renewables.
The company has reduced its carbon emissions by more than 86% since 2006.
Financially, Ørsted’s market capitalization has soared, outperforming traditional energy peers and making it a model for sustainable business transformation.
Key Lesson:
Sustainability-driven reinvention can enhance both brand reputation and long-term profitability, proving that renewable energy can be a major driver of shareholder value.
2. Tesla, Inc.: Accelerating the Global Shift to Clean Mobility (United States)
Tesla stands as a global symbol of the electric vehicle (EV) revolution and sustainable technology innovation. Founded by Elon Musk, the company disrupted the automotive industry with its vision of replacing fossil-fuel-based transport with electric power.
Sustainable Strategy:
Tesla’s approach integrates clean energy technologies — from electric cars and batteries to solar panels and grid storage solutions. The company’s Gigafactories are designed to produce renewable energy-powered batteries, reducing emissions across the value chain.
Impact:
Tesla has catalyzed a massive shift toward EV adoption, influencing global automakers to commit to electric transitions.
Its market valuation exceeded $1 trillion at one point, proving investor appetite for sustainability-driven innovation.
Tesla’s energy products, including Powerwall and Solar Roof, promote decentralized clean energy access.
Key Lesson:
Innovation and sustainability can go hand in hand. When a company’s mission aligns with global environmental goals, it can achieve both profitability and transformative societal impact.
3. Patagonia: The Model of Ethical and Environmental Responsibility (United States)
Patagonia, the outdoor clothing company, is widely recognized for embedding sustainability and ethics into its core business model.
Sustainable Strategy:
Patagonia’s sustainability journey began with eco-friendly product materials, such as organic cotton and recycled polyester. The company adopted a circular economy model, encouraging consumers to repair and reuse rather than discard products. It also donates 1% of its total sales to environmental causes and campaigns actively for conservation and climate justice.
Impact:
Patagonia has achieved a loyal customer base that values ethical practices, ensuring strong long-term growth.
The company became a certified B Corporation, meeting rigorous social and environmental performance standards.
In 2022, the founder Yvon Chouinard transferred ownership of Patagonia to a trust and non-profit organization to ensure all profits are used to combat climate change.
Key Lesson:
Sustainability and brand purpose can create lasting value. Ethical business models can build customer trust and longevity while addressing global challenges.
4. BlackRock’s Global ESG Investment Approach (United States)
BlackRock, the world’s largest asset manager, has been instrumental in mainstreaming sustainable investing.
Sustainable Strategy:
Under CEO Larry Fink’s leadership, BlackRock integrated ESG criteria into its investment processes. The company launched a suite of sustainable ETFs and committed to divesting from high-carbon assets while pushing companies to disclose climate-related financial risks.
Impact:
BlackRock manages over $500 billion in sustainable assets globally.
It has helped standardize ESG reporting and driven transparency in corporate sustainability.
Its influence has encouraged companies to adopt climate-conscious governance to attract institutional investors.
Key Lesson:
Large-scale asset managers can accelerate the global sustainability transition by redirecting capital flows toward environmentally responsible enterprises.
5. India’s Green Bonds and Renewable Energy Expansion (India)
India’s rise as a sustainable investment hub showcases how developing economies can balance growth and environmental stewardship.
Sustainable Strategy:
The Indian government and private corporations have increasingly issued green bonds to finance renewable energy, electric mobility, and climate-resilient infrastructure. Notably, the State Bank of India and Indian Renewable Energy Development Agency have issued green bonds to support solar and wind projects.
Impact:
India ranks among the top five countries in renewable energy capacity, with over 180 GW installed as of 2025.
Green bonds have attracted billions in foreign investment, strengthening India’s climate finance ecosystem.
Companies like Tata Power and ReNew Power have become leaders in sustainable energy generation.
Key Lesson:
Sustainable finance mechanisms, such as green bonds, are powerful tools for emerging economies to attract global investment while promoting low-carbon growth.
6. Unilever: Integrating Sustainability into Everyday Products (United Kingdom/Netherlands)
Unilever’s Sustainable Living Plan has become a benchmark for ESG integration across global consumer goods.
Sustainable Strategy:
Unilever committed to reducing its environmental footprint and improving social outcomes across its supply chain. It introduced initiatives like water-efficient production, fair trade sourcing, and recyclable packaging. Brands like Dove, Lifebuoy, and Ben & Jerry’s emphasize ethical production and social responsibility.
Impact:
Sustainable brands contributed more than 70% of Unilever’s revenue growth.
The company reduced its waste footprint and improved working conditions for millions across global supply chains.
Unilever’s sustainability leadership has improved investor confidence and brand loyalty.
Key Lesson:
Mainstream consumer goods companies can create significant global impact by embedding sustainability across operations, products, and supply networks.
7. Temasek Holdings: National Investment in Sustainability (Singapore)
Temasek, Singapore’s sovereign wealth fund, exemplifies how state-backed investments can lead sustainability transitions.
Sustainable Strategy:
Temasek’s portfolio increasingly favors companies with strong ESG performance, focusing on sectors like renewable energy, water management, food security, and electric mobility. The firm also set a goal to achieve net-zero portfolio emissions by 2050.
Impact:
Temasek allocated billions to climate tech startups, circular economy ventures, and green infrastructure projects.
It reports annually on its sustainability progress, ensuring transparency.
Its long-term vision strengthens Singapore’s reputation as a hub for sustainable finance.
Key Lesson:
Government-linked funds can drive national and regional sustainability agendas by integrating ESG principles into their investment frameworks.
Conclusion
The success stories of Ørsted, Tesla, Patagonia, Unilever, BlackRock, India’s green bond initiatives, and Temasek highlight that sustainable investing is not merely a moral choice but a strategic imperative for long-term profitability and resilience. These organizations have demonstrated that environmental stewardship, social equity, and sound governance enhance competitiveness, attract investment, and create lasting societal impact.
As global challenges like climate change, resource scarcity, and social inequality intensify, sustainable investments will play a crucial role in shaping a resilient and inclusive global economy. The path forward is clear — sustainability is not a niche strategy but the new foundation of global investment success.

Digital Dominates the Market and Old Methods Fall Behind1. The Rise of the Digital Era
The digital era began with the advent of computers and the internet but truly accelerated with smartphones, artificial intelligence (AI), big data, and automation. These technologies didn’t just improve existing systems; they created entirely new ways of doing business. Digitalization allowed information to flow faster, decisions to be data-driven, and processes to be more efficient.
For instance, e-commerce giants like Amazon, Alibaba, and Flipkart have replaced traditional brick-and-mortar stores as dominant retail forces. Customers now shop online, compare prices instantly, and get deliveries at their doorsteps — conveniences that were unimaginable two decades ago. Similarly, in finance, digital payment systems like UPI, PayPal, and cryptocurrency have made cash transactions almost obsolete in many regions.
2. Speed and Efficiency: The Core of Digital Dominance
One of the most significant advantages of digital systems is speed. Digital tools can process massive amounts of data in seconds, something manual systems could never achieve. Businesses can now analyze trends, predict demand, and make instant adjustments in pricing or supply chains.
For example, algorithms in stock markets execute millions of trades per second, optimizing profits based on market data — a task that human traders simply cannot match. In logistics, GPS tracking and automated warehouses ensure timely deliveries and reduced operational costs.
Efficiency is also enhanced through automation. Robots, AI chatbots, and machine learning systems perform repetitive tasks, allowing human workers to focus on creativity and strategy. This blend of automation and intelligence has become the new norm in production, healthcare, and customer service.
3. Data: The New Currency
In the digital world, data is power. Every click, purchase, and search generates valuable data that companies use to understand consumer behavior. This information helps businesses personalize products, target advertisements, and improve customer satisfaction.
Old methods relied on surveys or assumptions to gauge customer preferences, which were often inaccurate or outdated. Today, real-time analytics tools like Google Analytics, Meta Ads Manager, and CRM platforms provide detailed insights within minutes. As a result, companies can make evidence-based decisions instead of relying on guesswork.
For instance, Netflix uses viewer data to recommend shows, while Spotify curates music playlists using AI algorithms. These personalized experiences are key to retaining customers in the digital marketplace.
4. The Fall of Traditional Business Models
Traditional business methods, which depended heavily on manual labor, paperwork, and face-to-face interactions, are struggling to compete in a digital-first environment. The COVID-19 pandemic accelerated this shift — businesses without a digital presence suffered major losses or closures, while those that embraced technology thrived.
Brick-and-mortar retail stores have been replaced by online platforms. Newspapers are losing readers to digital media outlets and social networks. Even traditional banking, once reliant on in-person visits, has moved online through mobile banking and fintech apps.
Moreover, digital marketing has replaced conventional advertising. Television and print ads are losing relevance as companies turn to social media, influencer collaborations, and targeted online campaigns to reach audiences more effectively.
5. Global Connectivity and Market Expansion
Digital technology has eliminated geographical barriers. A small business in India can sell products to customers in Europe or the U.S. through online platforms. Social media allows brands to build global reputations, while digital payment systems and logistics networks simplify international trade.
Old methods, which relied on local marketing and limited reach, could never achieve this level of global exposure. Today’s startups can scale faster than ever before because the digital world provides instant access to millions of potential customers.
6. Innovation and Adaptation: The Key to Survival
In this digital-dominated market, innovation is the ultimate survival strategy. Companies that fail to adapt risk becoming irrelevant. Kodak is a classic example — once a photography giant, it fell behind because it ignored the rise of digital cameras. Similarly, Nokia, a leading mobile manufacturer, lost market share after failing to adapt to smartphone technology.
In contrast, businesses that embrace digital transformation, like Apple, Tesla, and Google, continue to lead their industries. They innovate continuously, leveraging AI, machine learning, and automation to stay ahead of competitors.
The lesson is clear: technology evolves rapidly, and only those willing to evolve with it can sustain success.
7. Digital Transformation in Key Sectors
a) Finance:
Fintech innovations have revolutionized banking. Digital wallets, online trading platforms, and blockchain technology have reduced dependency on traditional banking.
b) Education:
E-learning platforms like Coursera and Byju’s have replaced conventional classrooms for millions, offering flexibility and accessibility.
c) Healthcare:
Telemedicine, AI diagnostics, and wearable devices now monitor patient health remotely, reducing hospital visits.
d) Manufacturing:
Smart factories use IoT (Internet of Things) and robotics to enhance production efficiency.
e) Media and Entertainment:
Streaming services have replaced cable television, and social media has become a primary source of news and engagement.
Each of these sectors illustrates how old systems fade as digital tools redefine efficiency and user experience.
8. The Challenges of Digital Dominance
While digital transformation brings numerous benefits, it also presents challenges. Cybersecurity threats, data privacy concerns, and the risk of automation-driven unemployment are major issues. Small businesses often struggle to afford the technology required to stay competitive.
Furthermore, digital dependence can lead to inequality — regions with poor internet connectivity or digital literacy may fall behind economically. Hence, governments and organizations must focus on digital inclusion and cybersecurity to ensure a balanced digital future.
9. The Future: A Fully Digital Ecosystem
Looking ahead, the world is moving toward complete digital integration. Artificial intelligence, quantum computing, and blockchain will dominate future innovations. Physical money may vanish, replaced entirely by digital currencies. Autonomous vehicles, smart cities, and virtual reality workplaces are becoming realities.
The Internet of Everything — where every object is connected — will redefine how people live and work. Old methods will not disappear entirely, but they will become niche or nostalgic alternatives rather than mainstream options.
10. Conclusion
The dominance of digital technology marks one of the most profound shifts in human history. It has redefined efficiency, speed, and accessibility while transforming every aspect of business and daily life. Traditional methods, though valuable in their time, can no longer meet the demands of an interconnected, data-driven economy.
In the digital age, adaptation is not optional — it is essential. Those who embrace change, invest in innovation, and harness the power of data will lead the future. The world has entered an era where the digital dominates the market, and the old methods, while respected, inevitably fall behind.
Netflix Mini Pullback into LongNetflix can be setting up for a potential ABC correction, into the 1-1 extension on tech sector weakness and potential profit taking.
I am watching this stock for a potential buy zone at the lower end of the target, which would be a nice place for a longer term s/r structural flip for further continuation.

NFLX watch $1061-81: Crucial support zone that bulls MUST Hold NFLX has been struggling for months to make new highs.
Now testing a CRUCIAL support zone $1061.79-1081.84
Look for a clean Bounce or a reclaim if it falls through.

Understanding the Link Between War and Global Trade1. Historical Context: How War Shaped Trade Evolution
From the ancient Silk Road to modern-day global supply chains, trade has always been influenced by conflict. In medieval times, wars between empires often revolved around control of trade routes and access to resources such as spices, gold, or oil. The European colonial wars, for example, were largely driven by competition over global trade dominance.
In the 20th century, the two World Wars significantly reshaped global trade structures. After World War II, the devastation of Europe and Asia prompted the creation of new international trade institutions, such as the General Agreement on Tariffs and Trade (GATT) and later the World Trade Organization (WTO). These frameworks aimed to stabilize trade, rebuild economies, and prevent future conflicts through economic cooperation. Thus, while wars disrupt trade in the short term, they often lead to long-term structural changes in the global economic order.
2. Disruption of Supply Chains and Production
One of the most immediate impacts of war on trade is the disruption of global supply chains. Armed conflicts damage infrastructure—ports, roads, factories, and energy grids—making it difficult to produce and transport goods.
For instance, the ongoing Russia–Ukraine conflict has severely affected global trade in agricultural commodities like wheat, sunflower oil, and fertilizer. Both nations are major suppliers, and the conflict led to food price inflation worldwide. Similarly, wars in the Middle East often disrupt the oil supply, causing energy prices to surge globally and impacting industries dependent on stable fuel costs.
In addition to physical destruction, wars create logistical bottlenecks. Shipping routes may become unsafe due to blockades or military attacks, forcing traders to take longer, more expensive routes. Insurance premiums for shipping through conflict zones rise dramatically, adding further costs to international trade.
3. Trade Sanctions and Economic Warfare
In modern conflicts, nations increasingly use economic tools instead of direct military engagement. Trade sanctions, embargoes, and restrictions are often deployed as part of economic warfare.
For example, Western countries imposed extensive sanctions on Russia after its invasion of Ukraine in 2022. These sanctions targeted its energy exports, banking system, and access to international technology. While intended to pressure the Russian economy, such actions also disrupted global markets, particularly in Europe, which was heavily dependent on Russian gas.
Similarly, U.S.-China trade tensions illustrate how economic rivalry can take the form of trade wars rather than armed wars. Though not a traditional conflict, such economic confrontations can have similar destabilizing effects—reducing global trade efficiency, increasing tariffs, and forcing companies to diversify their supply chains.
4. Inflation, Commodity Prices, and Market Volatility
War creates economic uncertainty, which directly affects trade through market volatility and inflation. Investors tend to move away from risky markets during conflict, leading to currency fluctuations and reduced capital flow into affected regions.
Commodity prices—especially energy, metals, and agricultural products—often spike during wars. For instance, the Gulf Wars and the recent Russia–Ukraine war caused sharp increases in oil prices, which in turn raised the cost of transportation and manufacturing globally. These price shocks ripple through the entire global economy, reducing consumer spending power and slowing down international trade growth.
Inflation also becomes a significant challenge for importing countries, as the cost of raw materials and energy increases. Central banks may respond by tightening monetary policy, which can further slow global economic growth and trade expansion.
5. Shift in Trade Alliances and Global Power Dynamics
Wars often lead to the restructuring of global trade alliances. Countries may realign their economic partnerships based on political interests or security concerns.
For example, after the Cold War, the U.S. and Western Europe expanded trade with former Soviet bloc countries, integrating them into the global economy. In contrast, the Russia–Ukraine war has prompted Europe to seek energy independence from Russia, shifting its focus toward renewable energy and alternate suppliers like the Middle East, the U.S., and Africa.
China’s Belt and Road Initiative (BRI) can also be viewed as a strategic move to secure trade routes and minimize dependency on regions prone to conflict. Thus, wars accelerate geopolitical realignments that redefine global trade routes and dependencies for decades.
6. War-Induced Innovation and Industrial Transformation
Interestingly, wars have historically driven technological and industrial innovation, which later benefits global trade. Military research often leads to advancements in technology, logistics, and communication systems that are later adapted for civilian and commercial use.
For instance, World War II spurred innovations in aviation, shipping, and computing that laid the foundation for the modern global logistics industry. Similarly, the Cold War competition led to breakthroughs in electronics and space technology, which later revolutionized global communication and e-commerce.
In this sense, while wars initially disrupt trade, they can inadvertently stimulate industrial modernization and efficiency in the post-war period, enabling countries to rebuild stronger economic foundations.
7. Humanitarian and Labor Market Impacts
The human toll of war has a direct bearing on global trade through its effects on labor markets and migration patterns. Conflicts displace millions of people, leading to refugee crises and labor shortages in war-torn regions. At the same time, countries receiving refugees may experience labor surpluses or integration challenges.
For example, wars in Syria and Ukraine have caused large-scale migration toward Europe, affecting labor availability and domestic consumption patterns. Moreover, war reduces productivity as skilled workers flee conflict zones and industries struggle to operate under unstable conditions.
The resulting humanitarian crises also place financial burdens on neighboring countries, international aid organizations, and trade partners, altering the flow of goods, services, and capital in global markets.
8. Long-Term Economic Recovery and Reconstruction
Post-war periods often bring massive reconstruction efforts, which can revitalize trade. Rebuilding destroyed infrastructure creates demand for construction materials, machinery, and skilled labor, attracting global investment.
The Marshall Plan after World War II is a notable example—U.S. aid helped rebuild Western Europe, boosting transatlantic trade and fostering long-term economic growth. Similarly, post-war Japan and Germany transformed into industrial powerhouses due to international support and domestic reforms.
However, recovery depends on the scale of destruction, political stability, and international cooperation. Prolonged wars without resolution, such as those in parts of the Middle East and Africa, tend to keep trade volumes suppressed for extended periods.
9. Globalization, Interdependence, and the Future of Trade
In today’s interconnected world, the global economy is more interdependent than ever. This interdependence acts as both a deterrent to war and a source of vulnerability. On one hand, nations that are economically linked are less likely to engage in conflict due to the high mutual costs involved. On the other hand, when conflicts do occur, their ripple effects are felt globally—no economy remains isolated.
For instance, the Russia–Ukraine conflict affected everything from European gas prices to Asian fertilizer supplies and African grain imports. This has sparked debates about deglobalization, supply chain diversification, and strategic autonomy, as countries seek to reduce their exposure to geopolitical shocks.
Conclusion
The link between war and global trade is a complex web of disruption, adaptation, and transformation. While war undeniably brings destruction and economic instability, it also catalyzes long-term structural changes in trade systems, innovation, and geopolitical power dynamics. Modern conflicts, unlike historical ones, are fought as much with economic tools as with weapons, highlighting how trade itself has become a battleground for global influence.
As nations navigate the challenges of the 21st century—geopolitical tensions, resource competition, and economic sanctions—the future of global trade will depend on how effectively the world balances economic interdependence with security concerns. Ultimately, peace remains the most powerful driver of sustainable global trade, while war serves as a costly reminder of its fragility.

Netflix Daily & Weekly Chart: Critical Support Zone in PlaIn front of us is a daily chart of Netflix, and at first glance, you might think we’re staring at a straightforward top. But there’s more going on beneath the surface.
📉 Daily Chart Insight
We’re currently sitting at the bottom of a parallel down channel. That’s not just noise—it’s a potential inflection point. If price respects this lower boundary, we could see a rebound.
To invalidate that idea, we’d need a daily close below ~1067, the base of the channel.
📆 Weekly Chart Confirmation
Zooming out reveals two more confluences:
• 🔁 23.6% Fibonacci retracement from the May 22 to July 25 move lands at 1065.
• 📊 55-week moving average—a long-standing support—currently sits at 1060.
🧱 Add to that the February 2025 swing high at 1064, and we’ve got a cluster of support between 1060–1067. This zone has held before and could do so again.
📈 If price rebounds and breaks above 1142, we’re back in the middle of the range—and this setup starts to look more like a continuation than a top.
🔍 Watch this area closely. A decisive break below 1060 would shift the narrative. Until then, the bulls may still have a case.
Disclaimer:
The information posted on Trading View is for informative purposes and is not intended to constitute advice in any form, including but not limited to investment, accounting, tax, legal or regulatory advice. The information therefore has no regard to the specific investment objectives, financial situation or particular needs of any specific recipient. Opinions expressed are our current opinions as of the date appearing on Trading View only. All illustrations, forecasts or hypothetical data are for illustrative purposes only. The Society of Technical Analysts Ltd does not make representation that the information provided is appropriate for use in all jurisdictions or by all Investors or other potential Investors. Parties are therefore responsible for compliance with applicable local laws and regulations. The Society of Technical Analysts will not be held liable for any loss or damage resulting directly or indirectly from the use of any information on this site.

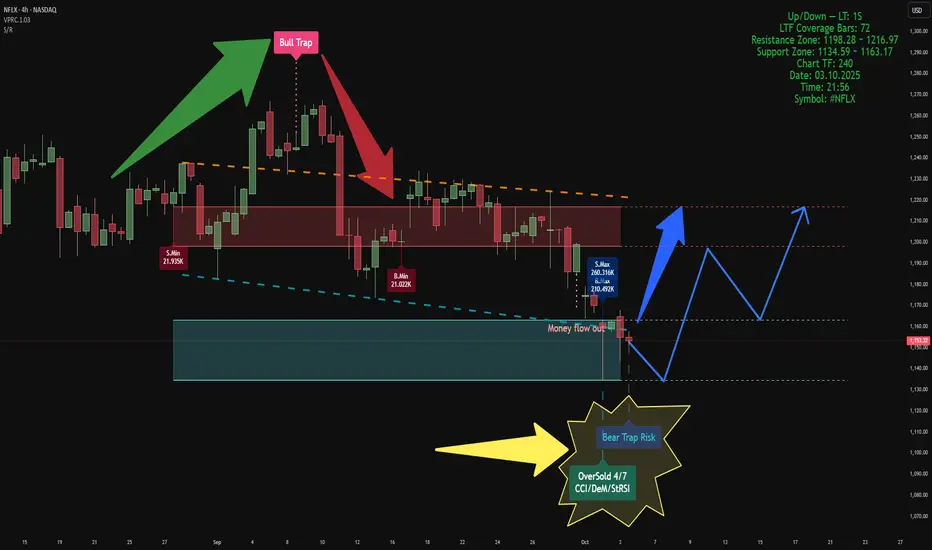
Volume-Based Market AnalysisUsing Indicators:
Smart Money Support/Resistance and ATAI Volume Analysis with Price Action V1.03
Analytical Configuration
This analysis combines two advanced indicators. The calculation period for both has been set to 52 bars, based on a lower timeframe of 1 second (1S), which provides 72 valid LTF candles. This configuration ensures that volume-based calculations remain within the valid data window for maximum accuracy.
Current Market Context
On the latest candle, a Bear Trap Risk signal appeared right after detecting an OverSold condition. This combination usually suggests weakening selling pressure near the end of a bearish leg and indicates the potential for buyer reaction. At that candle, both buy and sell volumes reached their highest values within the 52-bar window, but sellers maintained a slight advantage — approximately 260K sell volume versus 210K buy volume. This dominance by sellers in the OverSold zone reinforces the concept of volume exhaustion
Key Zones
• Support Zone: 1134 – 1163 USD
• Resistance Zone: 1198 – 1217 USD
Price is currently oscillating between these two zones. Based on the data, a short-term move toward the lower edge of the support zone is possible. If strong support holds, a rebound toward the upper boundary of resistance can be expected to retest or potentially break above it.
Structural Observation
In previous data, ATAI identified a Bull Trap at the resistance zone, which initiated the current bearish leg. Now, the emergence of a Bear Trap Risk near the support boundary is an intriguing reversal signal. If this trap functions similarly to the previous Bull Trap but in the opposite direction, we could expect a movement from the support base toward the resistance ceiling in the upcoming phase.
Summary
According to both indicators’ volume-based calculations, this is the most probable short-term scenario. However, this analysis is purely technical and volume-driven, and does not constitute any form of financial or investment advice.
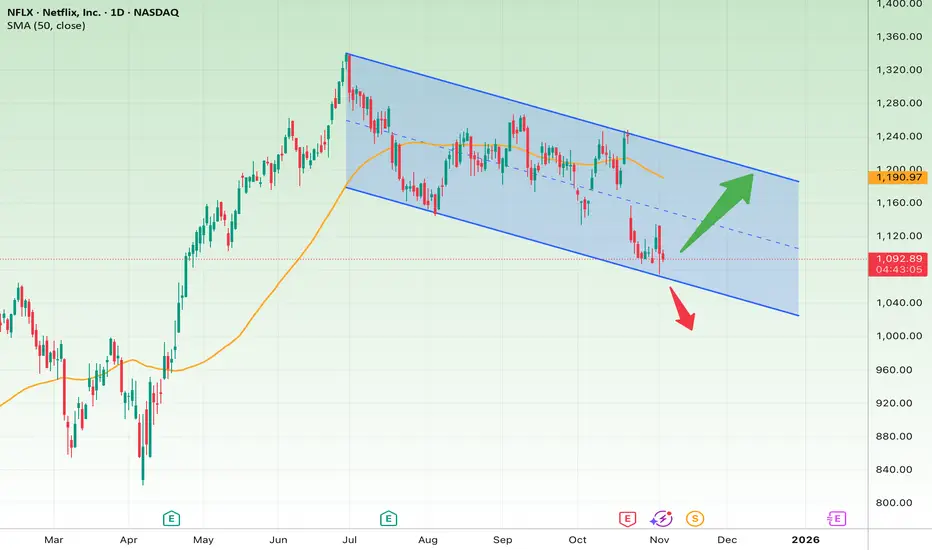
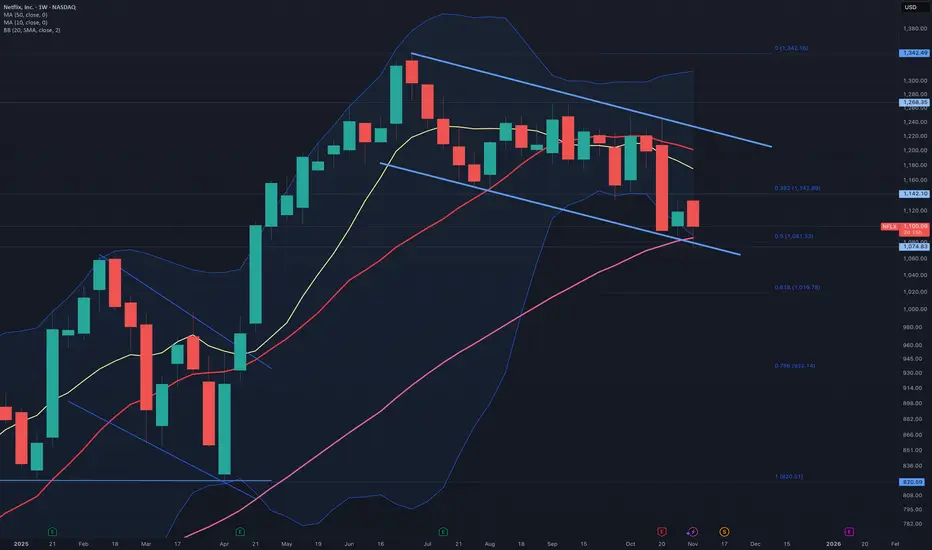
Netflix in a Downtrend ChannelThe Netflix (NFLX) daily chart shows a well-defined descending channel that started from around $1,350 and remains intact. The price is currently trading near the lower boundary of the channel ($1,080–$1,100) — a critical zone where buyers may attempt to step in or where a potential bullish divergence could form.
Short-Term Outlook (next few days to weeks):
In the short term, the $1,080 area acts as strong support. If the price manages to hold above this level and bounce back over $1,130, a corrective move toward $1,180–$1,200 is likely — an area that aligns with both the 50-day SMA and the midline of the channel.
However, a confirmed breakdown below $1,080 could trigger further downside toward $1,020 or even the lower channel line near $980.
• Bullish short-term target: $1,180–$1,200
• Bullish stop loss: Below $1,075
• Bearish short-term target: $1,020–$980
• Bearish stop loss: Above $1,130
Long-Term Outlook (1–3 months):
As long as the price remains within the descending channel, the broader trend stays bearish. Yet, the channel is starting to narrow, which often signals a potential end to the correction phase.
A breakout above the upper boundary ($1,220–$1,250) with confirmed closes would signal a trend reversal, opening the way toward $1,350–$1,400.
Conversely, if the lower channel support around $980 breaks down, the next downside target would be $915.
• Bullish long-term target: $1,350–$1,400
• Long-term stop loss: Below $980
In summary, Netflix is sitting at a decisive point within its downtrend channel — holding above $1,080 could spark a short-term rebound, while a breakdown could send the stock below $1,000 toward deeper support levels.
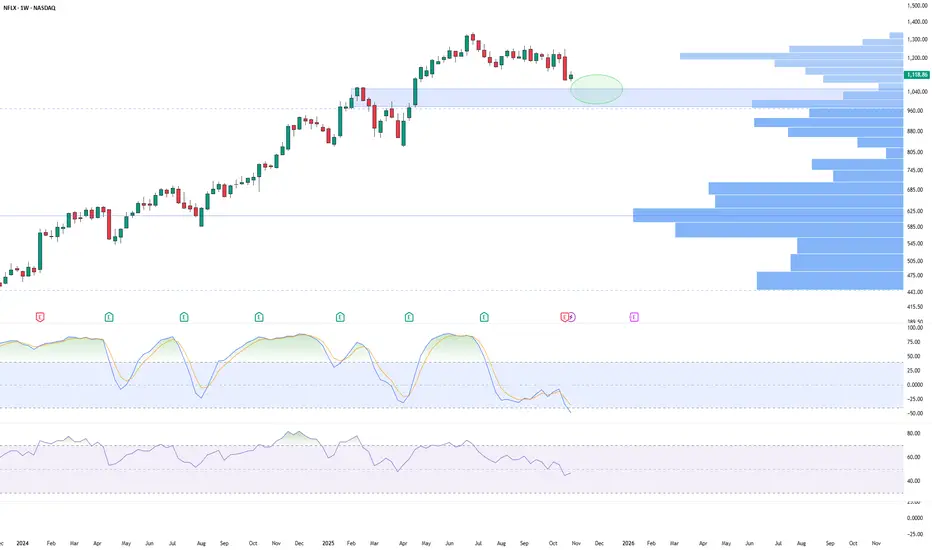
$NFLX: READY FOR A BOUNCE NASDAQ:NFLX is showing a bullish flag and has reached the 0.5 retracement level. It has also tested the 50-week SMA twice, indicating it may be ready for a bounce.
$NFLX | Weekly ChartNetflix enters the shortlist this week.
A potential buy zone is approaching, with momentum indicators turning interesting.
My custom indicator The Wave is flashing a potential long setup, right around the $1,000 area, maybe slightly above.
Earnings are already behind us, which clears the way for clean price action.
The long-term uptrend that started in late 2023 remains intact.
Bullish structure still in place and a possible setup forming for patient swing traders.
Let’s see how this zone reacts in the coming weeks.
Understanding Reserve Currency and Its Global RoleIntroduction: The Foundation of Global Financial Stability
In the intricate web of international finance, few concepts hold as much influence as the reserve currency. It is the lifeblood of global trade, the benchmark for economic stability, and a powerful symbol of national economic strength. A reserve currency is not merely a means of exchange—it is a cornerstone of global confidence. Countries around the world hold large quantities of certain currencies in their foreign exchange reserves to manage international trade, stabilize their domestic currencies, and meet external obligations.
Today, the U.S. dollar stands as the dominant reserve currency, though history has witnessed transitions—from the British pound sterling’s supremacy during the 19th and early 20th centuries to the dollar’s reign after World War II. However, with the world moving toward a multipolar economic system and technological innovations such as digital currencies reshaping finance, the concept and dominance of reserve currencies are being re-examined.
What Is a Reserve Currency?
A reserve currency is a foreign currency held by central banks and major financial institutions as part of their foreign exchange reserves. It is used to settle international transactions, influence exchange rates, and maintain financial stability. When a nation imports goods or services, settles debt, or intervenes in the forex market, it often uses a globally accepted currency like the U.S. dollar or the euro.
In simpler terms, it’s the currency other countries trust enough to use for global trade and as a store of value. A reserve currency must be stable, liquid (easy to buy and sell), and backed by a strong and credible economy.
Key examples of reserve currencies today include:
U.S. Dollar (USD)
Euro (EUR)
Japanese Yen (JPY)
British Pound Sterling (GBP)
Chinese Yuan (CNY) (gradually increasing in share)
Historical Evolution of Reserve Currencies
The evolution of reserve currencies mirrors global power shifts:
The British Pound Era (19th Century to Early 20th Century):
During the 1800s, the British Empire was at the height of its global influence. The pound sterling, backed by the gold standard and the vast colonial trade network, became the world’s primary reserve currency. It was trusted for its convertibility and Britain’s robust financial system.
The U.S. Dollar Ascendancy (Post-World War II):
After World War II, the Bretton Woods Agreement (1944) established the U.S. dollar as the central pillar of the global monetary system. The dollar was pegged to gold, and other currencies were pegged to the dollar. The U.S. economy’s post-war strength and stability made the dollar the most reliable global asset.
The End of the Gold Standard (1971):
In 1971, President Richard Nixon ended the dollar’s convertibility into gold—creating the modern fiat currency system. Despite this, the dollar maintained its dominance due to the size of the U.S. economy, military power, and the global acceptance of dollar-denominated assets such as U.S. Treasury bonds.
Emerging Competition (21st Century):
Over the past two decades, the euro and Chinese yuan have made gradual gains. However, no currency has yet displaced the dollar’s dominance, which remains unmatched in terms of global liquidity, trust, and network effects.
Why Reserve Currencies Matter
A reserve currency serves multiple purposes in global economics:
Facilitating International Trade:
Global trade is mostly conducted in reserve currencies. For instance, commodities like oil and gold are priced in U.S. dollars. This common currency standard simplifies transactions between countries and reduces exchange rate risk.
Store of Value for Central Banks:
Central banks hold reserve currencies to safeguard their economies from volatility. These reserves act as a financial cushion during crises—allowing countries to stabilize their currencies or pay for imports when domestic conditions are unstable.
Debt and Investment:
Governments and corporations issue bonds in reserve currencies, attracting global investors. This access to global capital reduces borrowing costs for countries whose currencies are considered stable.
Influence and Power Projection:
The nation issuing a reserve currency gains significant geopolitical leverage. The U.S., for example, can impose financial sanctions effectively because global trade and finance depend on dollar transactions.
The U.S. Dollar: The Reigning Reserve Currency
As of 2025, the U.S. dollar accounts for roughly 58–60% of global foreign exchange reserves, according to the International Monetary Fund (IMF). This dominance stems from several key factors:
Economic Strength:
The United States has the world’s largest economy, making the dollar a natural choice for trade and investment.
Deep and Liquid Financial Markets:
U.S. Treasury bonds are considered among the safest and most liquid assets in the world. Central banks and investors can buy and sell them easily, which increases confidence in the dollar.
Network Effect:
The more widely the dollar is used, the more attractive it becomes. This creates a self-reinforcing cycle that cements its dominance.
Military and Political Stability:
The U.S. government’s stability and global influence enhance trust in its currency, even in times of global uncertainty.
However, this dominance is not without challenges. The dollar’s centrality means that U.S. monetary policy—such as interest rate changes by the Federal Reserve—has global ripple effects, impacting borrowing costs, inflation, and trade balances worldwide.
The Euro and Other Contenders
The euro, introduced in 1999, was designed to rival the dollar’s supremacy. It represents a large economic bloc with a strong regulatory framework and deep capital markets. However, internal divisions among European Union members and debt crises in the region have limited its rise.
The Japanese yen and British pound remain important but secondary reserve currencies. Meanwhile, the Chinese yuan (renminbi) is gradually growing in use—thanks to China’s massive trade network and initiatives like the Belt and Road Initiative and the Asian Infrastructure Investment Bank (AIIB).
However, the yuan’s international acceptance is still constrained by capital controls, lack of full convertibility, and limited transparency in China’s financial markets.
Benefits for a Reserve Currency Issuing Nation
Holding the world’s reserve currency provides significant advantages to the issuing country:
Lower Borrowing Costs:
Global demand for U.S. Treasury securities allows the U.S. government to borrow at lower interest rates.
Trade Advantages:
The U.S. can purchase imports using its own currency, essentially creating demand for its dollars without needing foreign reserves.
Geopolitical Power:
The ability to impose sanctions, freeze assets, or cut off nations from the global dollar-based system gives the U.S. extraordinary influence in international affairs.
Financial Stability:
During crises, global investors often seek safety in dollar assets, reinforcing the U.S. financial system’s resilience.
Challenges and Criticisms of Reserve Currency Dominance
While being a reserve currency issuer has benefits, it also brings challenges:
The Triffin Dilemma:
Economist Robert Triffin highlighted that to supply the world with dollars, the U.S. must run trade deficits—exporting more dollars than it imports. However, persistent deficits can undermine confidence in the dollar’s long-term value.
Global Dependence on U.S. Policy:
When the Federal Reserve raises interest rates, capital often flows from emerging markets to the U.S., causing volatility and currency depreciation in those countries.
Weaponization of Finance:
The U.S. has increasingly used its control over the dollar-based system for sanctions. While effective politically, this has prompted other nations to seek alternative payment systems.
Emerging De-Dollarization Efforts:
Countries like China, Russia, and members of BRICS are actively exploring ways to reduce dependence on the U.S. dollar—such as bilateral trade in local currencies or creating shared digital currency systems.
The Rise of “De-Dollarization”
“De-dollarization” refers to the global movement to reduce reliance on the U.S. dollar for trade, finance, and reserves. This trend gained momentum after the U.S. imposed sweeping sanctions on Russia in 2022, freezing its dollar assets. In response, several nations began exploring alternative systems.
China and Russia have increased trade settlements in yuan and rubles.
India has initiated rupee-based trade mechanisms with select partners.
BRICS countries are discussing a potential common currency for trade and investment.
While these moves indicate gradual diversification, replacing the dollar entirely remains highly challenging due to its entrenched role in global finance and the lack of a fully equivalent alternative.
Digital Currencies and the Future of Reserve Systems
The next chapter in global currency evolution may be shaped by digital innovation. Central Bank Digital Currencies (CBDCs)—such as China’s Digital Yuan (e-CNY) and the potential Digital Euro—are being explored as tools for more efficient cross-border settlements.
These digital versions of national currencies could challenge traditional reserve systems by enabling direct international payments without intermediaries like SWIFT. If widely adopted, they could gradually reduce the dominance of traditional reserve currencies.
However, for digital currencies to serve as global reserves, they must ensure stability, convertibility, and global trust—conditions that currently remain under development.
A Multipolar Reserve Currency World
The global economy is slowly moving toward multipolarity, where several currencies share reserve roles instead of one dominant currency. This could enhance global stability by reducing overreliance on a single nation’s policies.
In such a system:
The U.S. dollar may remain dominant but with reduced share.
The euro and yuan could gain influence in regional trade.
Digital and commodity-backed currencies may emerge as alternative reserves.
However, such a transition would require decades of trust-building, regulatory cooperation, and geopolitical stability.
Conclusion: The Future of Global Monetary Balance
The concept of a reserve currency lies at the heart of global financial order. From the pound sterling’s imperial dominance to the U.S. dollar’s current reign, it has always reflected economic might, trust, and political influence.
Today, as globalization deepens and digital transformation accelerates, the future of reserve currencies may evolve beyond traditional boundaries. While the dollar’s supremacy remains intact for now, the push toward diversification, regional alternatives, and digital finance signals the dawn of a more balanced, interconnected, and resilient global monetary system.
The coming decades may not witness the fall of the dollar—but rather the rise of a more pluralistic reserve world, where power is shared, trust is distributed, and financial sovereignty becomes more evenly spread across nations.

Nflx I think the top has being made and a correction will happens . monthly Macd showing bulls are exahusted history I think meta and nflx are done for a while better staying away from those two if going long but that’s just my opinion .

NFLX - 2B REVERSAL PATTERN FORMATIONSharp drop after earnings ERRANTE:NETFLIX seems to be forming a new bottom around $1,095. Consolidating for some now and a 2b pattern is developing.
A lower candle in the same time frame invalidates the pattern.
NFA.
Good luck
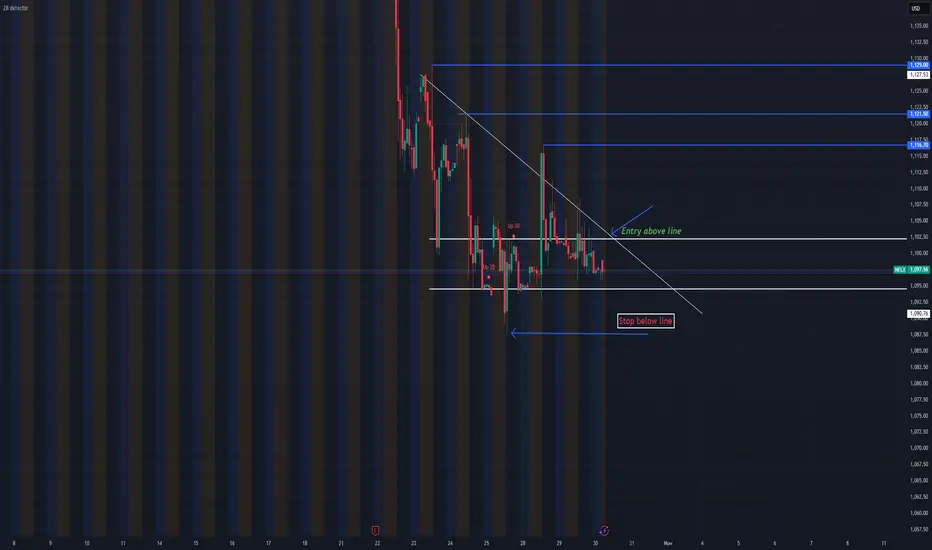
Key Levels to Watch for the Stock's Next MoveHas it broken the long-term trendline?
Is it the correction bottom and a reversal from the channel's lower bound?
De-Dollarization and Global Currency ShiftsIntroduction
For over seven decades, the U.S. dollar has been the undisputed king of global finance — the preferred reserve currency, the benchmark for international trade, and the foundation of global capital markets. However, recent years have seen increasing talk and tangible actions toward de-dollarization — the gradual movement away from dependence on the U.S. dollar in global trade, finance, and reserves. This shift is not merely theoretical but increasingly visible in trade agreements, reserve allocations, and cross-border payment systems. Understanding this process requires exploring its historical roots, current dynamics, major players, and the profound implications for the global economy.
1. Historical Dominance of the U.S. Dollar
The dollar’s dominance began after World War II, cemented through the Bretton Woods Agreement of 1944, which established the dollar as the central currency in the international monetary system. Under this system, other currencies were pegged to the dollar, which itself was backed by gold at a fixed rate of $35 per ounce. The U.S. economy, being the largest and most stable, became the anchor of global trade and finance.
Even after the Nixon Shock of 1971, when the U.S. abandoned the gold standard, the dollar maintained its supremacy due to America’s economic might, deep financial markets, and the establishment of the petrodollar system — where oil and other commodities were priced and traded in U.S. dollars. This gave the U.S. an “exorbitant privilege,” enabling it to run large deficits and influence global financial flows without losing credibility.
2. The Concept of De-Dollarization
De-dollarization refers to the global trend of countries reducing their reliance on the U.S. dollar for international trade, reserves, and financial transactions. It encompasses several dimensions:
Trade De-dollarization: Using alternative currencies for bilateral or multilateral trade settlements.
Financial De-dollarization: Diversifying reserves and foreign assets away from the dollar.
Institutional De-dollarization: Creating mechanisms that bypass U.S.-dominated systems like SWIFT.
While the dollar still dominates, de-dollarization is gradually reshaping the landscape, driven by economic pragmatism, geopolitical tensions, and the desire for monetary sovereignty.
3. Factors Driving De-Dollarization
a. Geopolitical Motivations
The most significant catalyst has been geopolitics. The U.S. has frequently used the dollar as a geopolitical weapon, imposing sanctions on nations like Russia, Iran, and Venezuela. This weaponization of the dollar has alarmed countries that fear similar vulnerabilities. For example, after Russia’s exclusion from the SWIFT system in 2022, Moscow and Beijing accelerated moves to use their national currencies for trade.
b. Economic Diversification
Emerging economies, especially China, India, Brazil, and Russia, are seeking greater autonomy in financial dealings. Holding large dollar reserves exposes them to U.S. monetary policy and inflation risks. Diversifying into gold, yuan, or euro assets reduces exposure to dollar volatility.
c. Rise of Alternative Economic Blocs
The BRICS alliance (Brazil, Russia, India, China, and South Africa) has become a strong advocate for a multipolar currency system. Their growing share of global GDP and trade makes it feasible to trade among themselves in local currencies, reducing the dollar’s centrality.
d. Technological Innovation and Digital Currencies
Blockchain technology and Central Bank Digital Currencies (CBDCs) are providing infrastructure for cross-border payments independent of the dollar system. China’s digital yuan and experiments by the European Central Bank and Reserve Bank of India are examples of monetary innovation accelerating de-dollarization.
e. U.S. Fiscal and Monetary Policies
Massive U.S. debt, persistent deficits, and inflationary pressures have raised concerns about long-term dollar stability. As the Federal Reserve’s interest rate policies cause volatility in global markets, many nations seek alternatives to reduce vulnerability to U.S. economic cycles.
4. Key Players in the De-Dollarization Movement
China
China is at the forefront of de-dollarization. Through its Belt and Road Initiative (BRI), it has expanded yuan-denominated trade and investment. The Cross-Border Interbank Payment System (CIPS) is Beijing’s alternative to SWIFT, facilitating international settlements in yuan. The digital yuan (e-CNY) further strengthens China’s ability to bypass the dollar in trade.
Russia
Following Western sanctions after the annexation of Crimea (2014) and the 2022 Ukraine war, Russia drastically reduced its dollar holdings, increasing reserves in gold and yuan. Russian oil and gas are now traded with countries like China and India in local currencies or through barter mechanisms.
India
India has begun signing bilateral trade agreements that allow settlement in Indian Rupees (INR). For example, the INR-Vostro account system facilitates trade with countries like Russia and Sri Lanka. India’s cautious yet steady participation highlights its interest in a diversified currency regime without abruptly destabilizing its financial relations with the West.
Middle East and Africa
Saudi Arabia, traditionally a key pillar of the petrodollar system, has signaled openness to accepting yuan or euros for oil sales, particularly with China. African nations engaged with BRICS and China’s infrastructure projects are also using local currency or yuan settlements, contributing to the multipolar trend.
European Union
The euro remains the second-most used currency in global reserves. The EU’s promotion of the euro in energy and technology trade aims to strengthen its global role and reduce dependence on U.S. financial systems, particularly in the face of unilateral sanctions.
5. Mechanisms of De-Dollarization
a. Bilateral Currency Swaps
Central banks are entering currency swap agreements, enabling direct trade in local currencies. China has over 40 such agreements worldwide, including with nations like Argentina, Pakistan, and Russia.
b. Local Currency Settlements
Countries like India, Brazil, and Indonesia are developing systems for local currency trade settlements, bypassing the dollar in invoicing and payment processing.
c. Multilateral Platforms
The Asian Infrastructure Investment Bank (AIIB) and the New Development Bank (BRICS Bank) are examples of financial institutions providing loans and investments in local currencies rather than dollars.
d. Gold Accumulation
Several nations have increased gold reserves as a hedge against dollar volatility. Central banks worldwide, led by China and Russia, are buying gold at record levels, viewing it as a neutral asset outside U.S. control.
6. Implications for Global Trade and Finance
a. Reduced Dollar Demand
As trade and financial flows diversify, global demand for U.S. dollars may decline gradually. This could weaken the dollar’s exchange rate and reduce the U.S.’s ability to finance its deficits cheaply.
b. Rise of Multipolar Currency System
A more balanced currency system may emerge, dominated by the U.S. dollar, euro, and Chinese yuan, with regional currencies playing niche roles. This diversification could enhance global stability but complicate exchange rate management and liquidity flows.
c. Shifts in Reserve Composition
According to IMF data, the dollar’s share of global reserves has declined from over 70% in 2000 to about 58% in 2024. This trend is expected to continue as central banks increase allocations to gold, yuan, and other assets.
d. New Trade Alliances
Countries prioritizing local currency trade are forming new alliances and payment networks, reshaping global trade routes. For instance, the India-Russia-China corridor and BRICS payment system are notable examples.
e. Impact on U.S. Influence
De-dollarization could gradually diminish U.S. geopolitical leverage. The ability to impose sanctions, control global liquidity, or influence monetary policy worldwide would be reduced. However, this process will likely be slow, given the depth and liquidity of U.S. financial markets.
7. Challenges and Limitations
While the momentum toward de-dollarization is real, several constraints limit its pace:
a. Lack of Deep Capital Markets
The U.S. still offers the largest, most liquid, and transparent capital markets. Alternatives like the yuan or rupee lack full convertibility, regulatory clarity, and global trust.
b. Network Effects
Once a currency dominates, it benefits from self-reinforcing network effects. Most global commodities are priced in dollars, and firms prefer it due to stability and universal acceptance.
c. Political and Institutional Trust
Many countries still view the U.S. legal and financial framework as safer than those of emerging powers. China’s capital controls and Russia’s geopolitical isolation hinder full global acceptance of their currencies.
d. Technological Fragmentation
Although CBDCs and digital platforms offer alternatives, interoperability and security issues remain unresolved. Competing systems could lead to inefficiency rather than integration.
8. Future Outlook: The Road Ahead
The world is unlikely to see the immediate end of the dollar era, but a gradual rebalancing is underway. The next decade could witness:
A tripolar currency system led by the U.S. dollar, euro, and Chinese yuan.
Expansion of digital and regional currencies for trade within Asia, Africa, and Latin America.
Declining U.S. dominance in global reserves but continued dollar primacy due to market depth.
Growth of commodity-backed and digital settlement systems to stabilize cross-border payments.
The dollar’s resilience should not be underestimated — it remains a symbol of trust, backed by strong institutions and deep markets. Yet, as emerging powers grow and technology disrupts traditional finance, the unipolar dollar era is transforming into a multipolar monetary order.
Conclusion
De-dollarization represents one of the most significant shifts in the global economic landscape of the 21st century. It is not an overnight revolution but a gradual evolution driven by geopolitical tensions, technological progress, and the rise of new economic powers. While the U.S. dollar will likely remain dominant for the foreseeable future, its uncontested supremacy is fading. The emerging multipolar currency world — led by the dollar, yuan, and euro — will redefine global finance, trade, and geopolitics.
In essence, de-dollarization is not just a financial adjustment; it is a statement of sovereignty, resilience, and the world’s ongoing journey toward a more balanced and diversified economic order.

BUY NFLXNFLX is due to fall down or short soon at 1,134.00 to 1,405.00, but for next week or maybe this week – it's time to BUY NFLX at 1,164.00, riding back up to 1,134.00 to 1,405.00 as Profit Targets, Stop Loss is at 1,132.00!
If anyone likes long mumbo jumbo garbage analysis, than this is NOT for you.
Also, if you are afraid of risk, failure, and want only a 100% sure thing, than
run as fast as you can from the market, because the market is NOT a sure thing,
so it is definitely NOT for you.
WARNING: This is just opinions of the market and its only for journaling purpose. This information and any publication here are NOT meant to be, and do NOT constitute, financial, investment, trading, or other types of advice or recommendations. Trading any market instrument is a RISKY business, so do your own due diligence, and trade at your own risk. You can loose all of your money and much more.

Netflix: A Correction Within a Strong UptrendNetflix: A Correction Within a Strong Uptrend
NASDAQ:NFLX has gone through a lot over the past few years, from huge growth to deep corrections, and lately we’ve seen a (healthy?) 20% pullback that brought the price right to the lower boundary of its long-term ascending channel.
At first glance, the break below the $1,150 level looked worrying, and it certainly brought some pessimism to the market . But the area between $1,070 and $1,100 is still a very strong support zone that shouldn’t be ignored. As long as this zone holds, the broader bullish structure remains intact. Let me share a zoom:
If the price drops below $1,050, that would be a sign of trouble, it would mean we’ve entered the previous correction zone and broken both key support and the lower line of the channel. That’s where the trade SL its logic, and cutting losses quickly becomes essential l. The downside risk from current levels is roughly 6%, which is acceptable in exchange for the potential upside.
On the bright side, the market remains bullish overall . Netflix keeps reinventing itself, improving margins, and showing solid fundamentals. Technically speaking, this correction looks textbook, the current pullback mirrors the size of the previous one (White arrows), and Fibonacci’s 61.8% retracement (blue arrow) level has once again acted as a key pivot point. This kind of pattern is a classic correction, not an impulse.
If the stock confirms a rebound from the channel support, the potential is significant: around +20% if price revisits previous highs, and up to +35% if Netflix breaks into new territory.
In short:
✅ Strong long-term uptrend still intact
✅ Correction looks healthy and technically clean
⚠️ Support at $1,070–$1,100 must hold
📈 Upside potential 20–35% vs. ~6% downside risk
Sometimes, opportunities like this appear only a few times in a cycle, Netflix might be one of them right now.

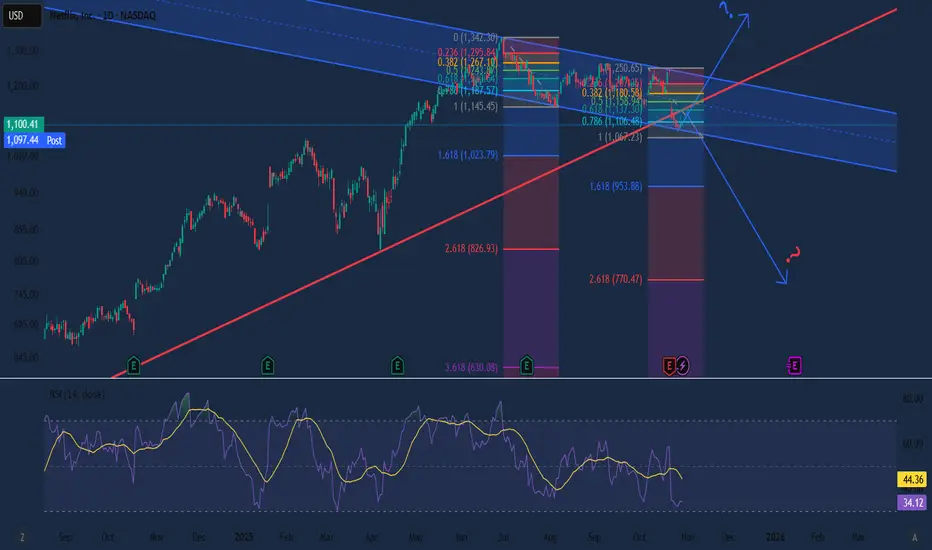
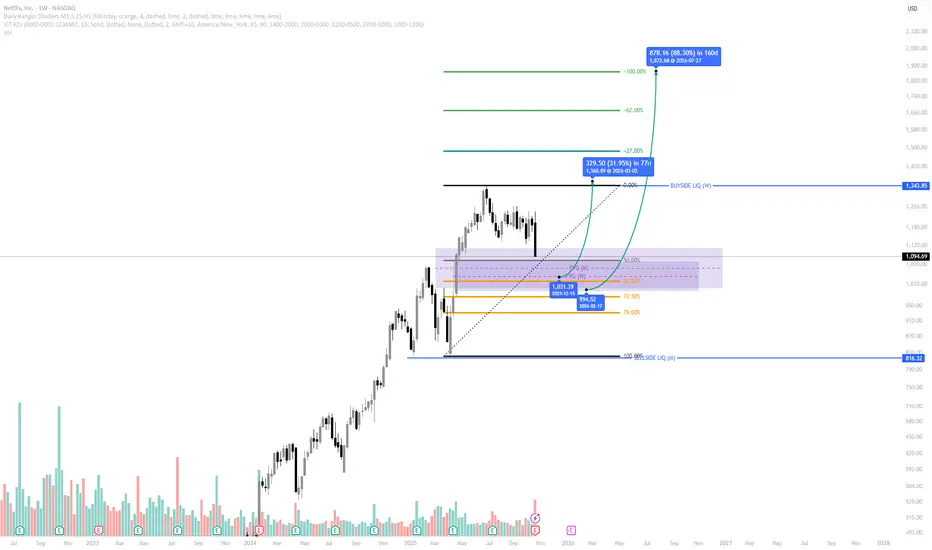
Netflix (NFLX) | FVG + OTE Entry Loading | Multi-Confluence ICT Netflix (NASDAQ: NFLX) is currently retracing into a high-probability multi-timeframe setup, aligning several ICT confluences that suggest a potential re-entry opportunity within a bullish continuation narrative.
Market Structure:
Price remains bullish overall, with clear higher highs (HH) and higher lows (HL). The recent decline represents a healthy retracement inside a developing higher-timeframe structure.
Fair Value Gap (FVG) Alignment:
The current pullback has driven price into an overlapping Monthly and Weekly FVG, an area of institutional interest where price has previously shown strong reactions.
This zone often serves as a re-accumulation region before expansion.
Optimal Trade Entry (OTE):
The FVG aligns directly within the 62%–79% Fibonacci retracement zone, known as the golden OTE zone.
This overlap of structural retracement and imbalance discount makes it a prime setup from a smart money perspective.
Liquidity & Target Zones:
- Discount Range: $944 – $1,033
- Primary Buyside Liquidity (BSL): $1,345
- Extended Target: $1,872 (100% expansion projection)
Each level aligns with liquidity pools and Fibonacci extension targets visible on higher timeframes.
Trade Bias:
Bullish, with focus on accumulation and confirmation within the OTE discount range.
A weekly bullish displacement or rejection candle within this zone would strengthen the case for long continuation plays.
Summary:
NFLX is presenting a multi-timeframe high-probability setup, where a clean retracement into an overlapping Monthly/Weekly FVG and OTE zone creates a strong case for re-entry.
If the discount zone holds, expect expansion toward buyside liquidity and potential continuation into 2026.
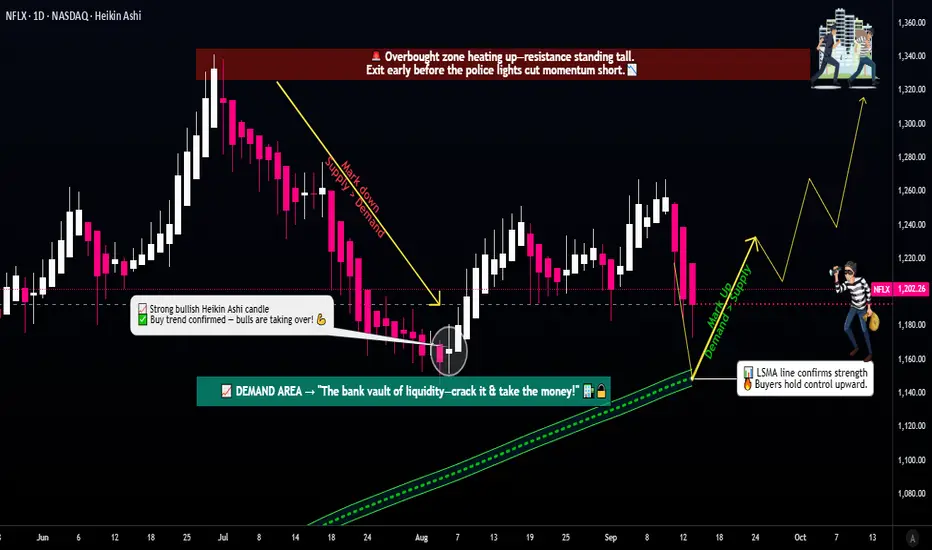
Popcorn Ready? Netflix Layering Setup for Bold Traders🎬 Netflix Stock | Thief Trader’s Profit Realization Blueprint 🍿💰
🧭 Market Outlook
Netflix (NFLX) is lining up for a bullish playbook — and here’s how the Thief Strategy goes down. This setup is purely educational and shares how I personally view price behavior with a layering approach.
🎯 Trading Plan (Swing/Day Trade Idea)
Entry (Layering Style 🥷): Instead of one-shot entries, the thief strategy is about multiple buy-limit layers. Example blueprint:
👉 1160 | 1170 | 1180 | 1190 | 1200 (more can be added if liquidity allows)
Stop Loss 🛡️: Thief-style SL ~1120 (after breakout levels are confirmed).
⚠️ Note to Thief OG’s: Manage your own SL & adapt risk. My level is an example, not a fixed call.
Target 🎯: Eyeing the 1340 zone, where resistance + overbought vibes + possible trap signals align. The thief rule? Escape before the crowd escapes 🚪💨.
⚠️ Again — not a fixed TP. Manage your own exits depending on profit goals & risk appetite.
🕵️♂️ Thief Trader Philosophy
This is not financial advice. It’s a “steal-and-escape” blueprint to show how layered entries can help smooth entries across zones instead of one rigid buy point. Adapt, manage, and steal profits like a pro before the market takes them back.
🔗 Related Assets to Watch
NASDAQ:AMZN — often shows correlation in big tech swings 📦
NASDAQ:AAPL — mega-cap sentiment driver 🍏
NASDAQ:MSFT — growth stock momentum check 💻
NASDAQ:QQQ — ETF to track Nasdaq 100 flow 📊
AMEX:SPY — broad market sentiment monitor 🏦
📌 Key Correlation Notes
Big tech stocks often move in sympathy — when Nasdaq pumps, Netflix usually gets extra popcorn 🍿 fuel.
Watch volatility spikes in TVC:VIX , as they can trap over-leveraged longs & shorts.
Macro cues (USD strength, yields, Fed talk) can shift momentum across all growth stocks.
✨ “If you find value in my analysis, a 👍 and 🚀 boost is much appreciated — it helps me share more setups with the community!”
#NFLX #Netflix #Stocks #SwingTrade #DayTrade #LayeringStrategy #Options #StockMarket #TradingView #ThiefTrader #Equities #QQQ #SPY #StockAnalysis
Participants Coverage on the Global MarketIntroduction
The global financial market is a vast, interconnected ecosystem where capital flows across borders, industries, and asset classes. Every movement—whether in currencies, equities, bonds, or commodities—is influenced by a diverse set of participants. These market participants include institutional investors, retail traders, corporations, governments, and intermediaries such as brokers, exchanges, and regulators. Each plays a distinct role in ensuring market efficiency, liquidity, and stability. Understanding who these participants are, their objectives, and their impact on global markets is essential for comprehending how financial systems operate today.
1. The Structure of the Global Market
Before exploring the participants themselves, it’s important to understand the composition of the global market. Broadly, it consists of five major segments:
Equity Markets – Platforms where shares of companies are issued and traded. Examples include the New York Stock Exchange (NYSE), London Stock Exchange (LSE), and NSE India.
Fixed Income (Bond) Markets – Where governments and corporations issue debt securities to raise capital.
Foreign Exchange (Forex) Market – The largest and most liquid market globally, facilitating currency conversion for trade and investment.
Commodity Markets – Where raw materials like oil, gold, and agricultural products are traded via spot or futures contracts.
Derivatives Markets – Markets for instruments whose value derives from underlying assets (e.g., options, swaps, futures).
All these markets are influenced by a range of participants, each contributing to the dynamic flow of capital and information.
2. Key Market Participants
A. Institutional Investors
Institutional investors are large organizations that manage vast pools of money on behalf of others. They are the cornerstone of global finance, accounting for the majority of trading volume.
Types include:
Mutual Funds and Exchange-Traded Funds (ETFs): Manage diversified portfolios for retail investors.
Pension Funds: Invest to secure long-term retirement benefits.
Insurance Companies: Allocate premiums into safe or high-yielding assets.
Hedge Funds: Engage in complex strategies, including short selling, arbitrage, and derivatives trading.
Sovereign Wealth Funds (SWFs): State-owned investment funds managing national reserves (e.g., Norway’s Government Pension Fund, Abu Dhabi Investment Authority).
Impact on the market:
Institutional investors bring stability, depth, and liquidity. However, their large-scale movements can also create systemic risk if poorly managed—as seen during the 2008 global financial crisis.
B. Retail Investors
Retail investors are individual participants who invest their personal funds in stocks, bonds, mutual funds, or other assets. Over the last decade, the democratization of finance—driven by mobile trading apps and online brokers—has dramatically increased retail participation.
Characteristics:
Generally invest smaller sums compared to institutions.
Often motivated by personal goals like wealth creation or retirement.
May follow market sentiment, trends, or social media-based movements (e.g., GameStop and AMC “meme stock” rallies).
Influence on the market:
Retail investors contribute to liquidity and diversity of opinion in the market, though they may also introduce volatility due to herd behavior or lack of risk management.
C. Corporations
Corporations participate in financial markets both as issuers and investors. They issue equity (stocks) or debt (bonds) to raise capital for expansion, acquisitions, or working capital. Multinational corporations (MNCs) also engage heavily in foreign exchange markets to hedge currency exposure.
Example:
Apple Inc. issues corporate bonds to finance buybacks or R&D.
Toyota hedges yen-dollar exposure to protect export margins.
Market role:
Corporate actions—like stock buybacks, mergers, or dividend announcements—often trigger major market reactions and influence investor sentiment.
D. Governments and Central Banks
Governments and their monetary authorities play a crucial role as both market participants and regulators.
Key roles:
Issuing Sovereign Debt: Governments raise capital by issuing treasury bonds (e.g., U.S. Treasuries, Indian G-secs).
Regulating Markets: Through agencies like the U.S. SEC or India’s SEBI, governments ensure transparency and investor protection.
Central Bank Interventions: Central banks like the Federal Reserve, European Central Bank (ECB), and Reserve Bank of India (RBI) influence global markets via monetary policy—adjusting interest rates, managing inflation, and stabilizing currencies.
Influence:
Their decisions on rates, liquidity, and currency management directly impact asset prices globally. For example, a rate hike by the Fed strengthens the dollar but often weakens emerging market currencies.
E. Financial Intermediaries
Financial intermediaries bridge the gap between investors and markets. They include:
Brokers and Dealers: Facilitate buying and selling of securities.
Investment Banks: Underwrite new securities issues, assist in mergers and acquisitions, and provide advisory services.
Clearing Houses: Ensure the settlement of trades and reduce counterparty risk.
Custodians: Safeguard assets held by institutional investors.
These intermediaries form the backbone of market operations, ensuring liquidity, transparency, and efficiency.
F. Speculators, Arbitrageurs, and Traders
Speculators and arbitrageurs actively seek short-term profits by exploiting market inefficiencies.
Speculators: Take calculated risks by forecasting price movements.
Arbitrageurs: Profit from price discrepancies across markets or instruments.
High-Frequency Traders (HFTs): Use algorithms to execute trades in milliseconds, contributing to liquidity but sometimes amplifying volatility.
These participants keep markets efficient by correcting mispricings and improving liquidity, though their activities can heighten short-term volatility.
G. Credit Rating Agencies and Analysts
While not direct investors, rating agencies such as Moody’s, S&P Global, and Fitch play a vital role in assessing creditworthiness. Their ratings influence borrowing costs for governments and corporations and guide investor decisions globally. Similarly, financial analysts and research institutions provide data, forecasts, and sentiment analysis that shape investment flows.
H. Regulators and International Institutions
Regulatory bodies ensure the smooth and ethical functioning of markets. They protect investors, enforce transparency, and curb manipulation.
Examples:
SEC (U.S.)
FCA (U.K.)
SEBI (India)
ESMA (Europe)
Internationally, organizations like the IMF, World Bank, and Bank for International Settlements (BIS) coordinate financial stability efforts and monitor systemic risks.
3. Geographic Coverage of Market Participants
Global market participants are distributed across key financial centers:
North America: Dominated by U.S. institutions—Wall Street houses the largest hedge funds, banks, and asset managers like BlackRock and Vanguard.
Europe: London, Frankfurt, and Zurich are major hubs for banking, forex, and insurance.
Asia-Pacific: Hong Kong, Singapore, Tokyo, and Mumbai are leading centers for equity and derivatives trading.
Middle East: Rising influence due to oil wealth and sovereign funds (e.g., Qatar Investment Authority).
Africa and Latin America: Emerging participants with growing stock exchanges and commodity exposure.
This global coverage allows continuous 24-hour trading cycles, connecting markets through technology and capital flows.
4. The Interconnectedness of Global Participants
The modern financial system is highly interconnected. Institutional investors diversify globally; central banks coordinate on policy; and technology ensures real-time market reactions. This interconnection has benefits and risks:
Benefits:
Efficient capital allocation across borders.
Access to international funding and investment opportunities.
Diversification reducing country-specific risk.
Risks:
Contagion effects—financial crises in one country can quickly spread worldwide (as seen in 2008).
Increased volatility due to synchronized trading behavior.
Policy spillovers when major economies adjust monetary or fiscal measures.
5. Technology and the Rise of New Participants
The digital revolution has redefined market participation.
Algorithmic and Quantitative Funds: Use data-driven models and AI to make investment decisions.
Fintech Platforms: Empower retail investors with real-time trading, robo-advisors, and zero-commission brokerage.
Cryptocurrency Participants: A new segment of traders, miners, and blockchain investors now operate in digital asset markets—creating a parallel global market ecosystem.
Data Providers and Tech Firms: Companies like Bloomberg, Refinitiv, and FactSet provide analytics essential for decision-making.
Technology has democratized market access but also introduced cybersecurity and regulatory challenges.
6. Behavioral Dynamics among Market Participants
Each participant operates under different motivations and risk appetites, influencing overall market psychology.
Institutions seek steady, long-term returns.
Retail investors often react emotionally to news or trends.
Governments and central banks act strategically to balance growth and stability.
Speculators and traders thrive on volatility.
These behaviors collectively create market cycles of greed and fear, driving booms, corrections, and recoveries.
7. Challenges Faced by Global Market Participants
Regulatory Divergence: Different countries have varied financial regulations, complicating cross-border operations.
Geopolitical Risks: Wars, trade tensions, and sanctions disrupt capital flows.
Climate and ESG Pressures: Investors increasingly prioritize sustainability, forcing companies and funds to adjust portfolios.
Interest Rate Uncertainty: Central bank policies impact valuation models and investment flows.
Currency Volatility: Multinationals and investors must manage exchange-rate risks amid fluctuating global monetary policies.
8. The Future of Global Market Participation
The future will see a broader and more inclusive set of participants, driven by:
Digital Assets: Wider institutional adoption of cryptocurrencies and tokenized securities.
ESG Integration: Environmental and social governance becoming a standard investment metric.
AI and Automation: Machine learning optimizing portfolio management and risk analytics.
Retail Empowerment: Continued growth of individual participation through education and technology.
Cross-border Integration: Regional cooperation in Asia, Africa, and Latin America expanding investment networks.
The global market is evolving toward inclusivity, transparency, and digital transformation, creating new opportunities and challenges for every participant.
Conclusion
The global market is a living, breathing organism powered by a complex network of participants—each with unique objectives, time horizons, and influences. Institutional investors provide depth and capital; retail investors bring vibrancy and democratization; governments and central banks ensure stability; and intermediaries maintain operational efficiency. Together, they form the backbone of global finance.
In an era of accelerating globalization, technology, and policy interdependence, understanding market participants’ roles is more critical than ever. The health of the global economy ultimately depends on how these diverse actors interact—balancing risk, opportunity, and regulation in pursuit of sustainable financial growth.

NetflixHeard someone online talk about Netflix so I decided to throw this together real quick. Weekly levels are grey
Daily timeframe levels are red

Netflix: Decoded AnalysisNetflix upper supports are noted at $895 & $700 with a very strong support at $608.
Middle supports are observed at $298 and $125.
However, if the $600 support level is broken, the next major support this quarter is around $125.
The lowest support is projected for July/Oct 2026 at $4.22.
Above resistance noted at $1711 and $1760 for the first & second quarter of 2026.
This message is for educational purposes.
Always DYOR
Note: Tradingview view doesn't allow me to share my technical analysis chart.