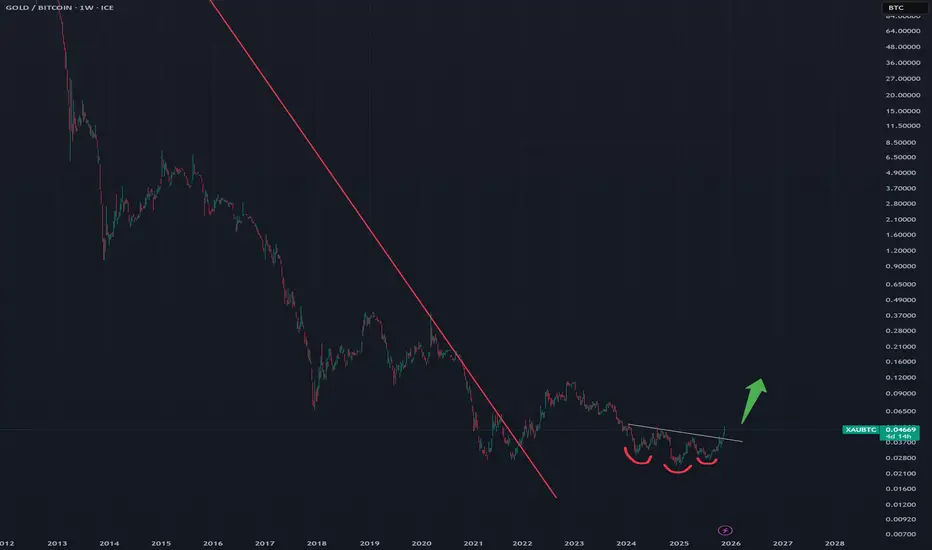
XAUBTC - Gold to Bitcoin ratio triple Bottom reversal pattern.XAUBTC - Gold to Bitcoin ratio triple Bottom reversal pattern.
After a long term decline (red line) has ended.
Sideway consolidation has given way to triple bottoming pattern and a new uptrend.
Meaning- lower BTC, Higher Gold prices going forward (relatively or in absolute terms).
In the game of global trade, the referee is gold!!!What appears to be the convergence of two long-term downtrends formed by the parity of the gold to bitcoin ratio, and at this point when gold has broken its grip (thanks to the foolishness of Western governments past and present), we should see the price rise to the 1.59 range.
This is evidence that

Gold vs Bitcoin possible reversal with double bottomTVC:XAUBTC reached mid level of long due downtrend.

Gold vs Bitcoin on a weekly basisThe very large lag of gold relative to Bitcoin, very good floor formation and good support and positive divergence all indicate that gold will grow in the future relative to Bitcoin, which in itself can indicate many issues. Because gold is considered a safe and low-risk asset, and in contrast to Bi

The gold Bitcoin ratio XAUBTCthere are only two volatile assets - Gold and Bitcoin - one falling the other rising and vice versa.
Bitcoin is going down to 60k in 2 years while gold is going to say 7k
what do you see with the new 3 month green candle on the XAUBTC chart?
red is Bitcoin when rising while the green is gold now

TradeCityPro | Bitcoin Daily Analysis #200👋 Welcome to the 200th Daily Bitcoin Analysis!
To celebrate this milestone, today’s analysis will be different, our main focus will be on the XAUBTC chart, but first, let’s analyze gold and Bitcoin separately before combining the two.
✅ Gold
📅 Monthly Timeframe
Gold is in a completely bullish tr

btc/usdGold leads btc follows
expectation gold to bottom by end of oct , followed by finally the real btc bull market

Market will continue to eat the current bearish Order blockI had the vision from the retest of the double bottom (Wickoff reversal pattern) that Gold had the possibility to outperform Gold from now on) (+12% Past Month)
I believe that BTC has currently begun a Mark Down process after his last point of supply.
Currently holding Gold Long and BTC Short fo
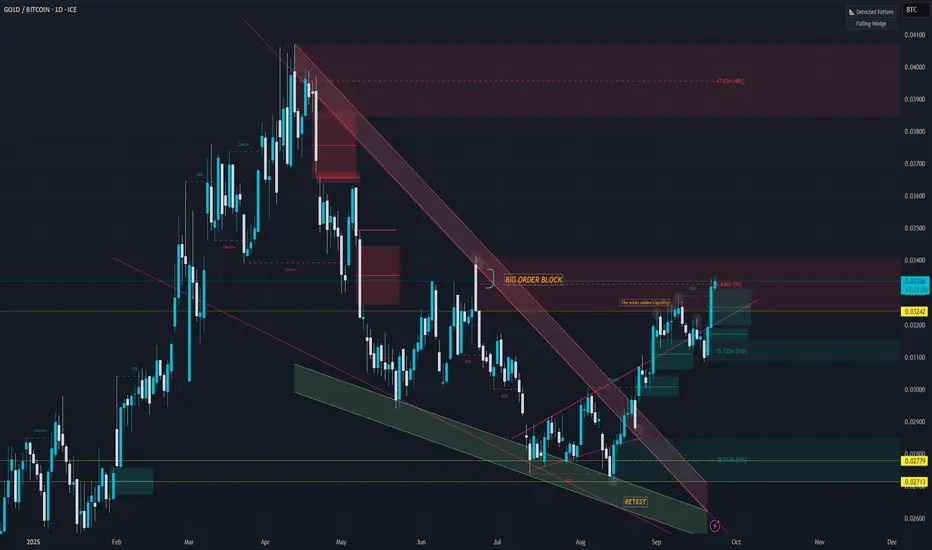
Heading North if you study XAU-BTC (TV) we have also a possible Wickoff reversal with that clean retest of the last double bottom.
When I check the cluster of liquidity on BTC we have fuel to start the Mark down.
Remember that the recent drop at 107k 98k and 74k could have strategically made to have a cost eff
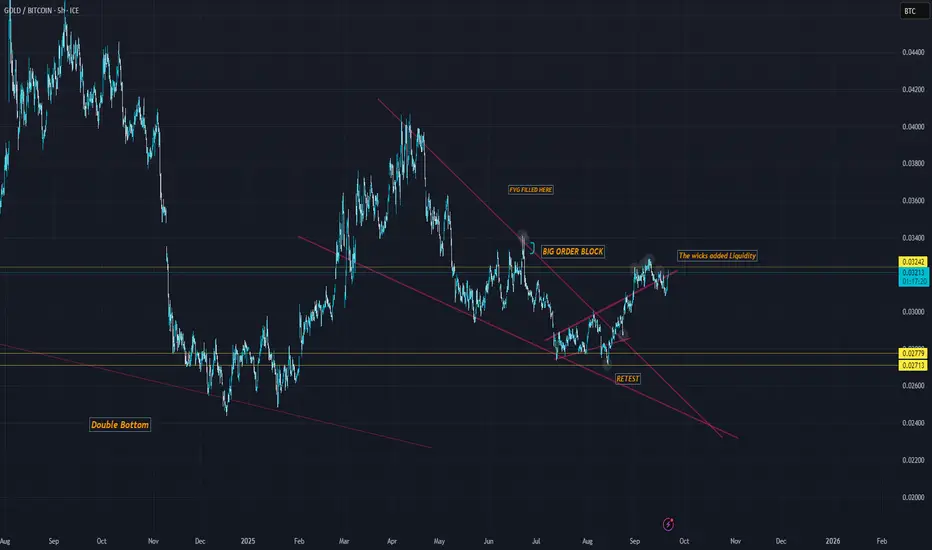
XAUBTC inverse-low targets#bitcoin has reached new highs, not so XAUBTC-a clear indicator for more downwards pressure.

See all ideas
Displays a symbol's price movements over previous years to identify recurring trends.