Crude Oil's Critical Breakdown: Is a Plunge to $58 Imminent?Hello, TradingView community! 👋 SpotCrude (WTI) has taken a significant turn, closing the week at a precarious 61.168 . After failing to sustain its recent rally, oil is now teetering on the edge of a major support level. Is this the beginning of a new downtrend, or will buyers step in to defend the line? The upcoming week, November 3rd to 7th, will be decisive.
Let's drill down into the multi-timeframe data, blending classic technical theories with key indicators to forge a robust trading strategy for the days ahead. 💡
🌍 The Macro Outlook: Weekly & Daily Charts - The Bears Are Back in Town
The market is a battlefield, and the trend is your strongest ally.
The higher timeframes are flashing significant warning signals, suggesting the recent strength was merely a correction in a larger downtrend.
Weekly Chart (1W) : The long-term picture remains bearish. As per Dow Theory , the primary trend is down, with the recent push higher failing at a key resistance zone. The price is firmly below the Ichimoku Cloud, and the formation of a Bearish Engulfing candle last week is a powerful rejection signal.
Daily Chart (1D) : On the daily chart, the story of failure becomes clearer. We have a potential Double Top formation right at a major resistance level. The RSI is exhibiting a clear bearish divergence where price made a higher high, but the RSI failed to confirm, indicating weakening momentum. The price has been decisively rejected and is now threatening to break down from this topping pattern.
⚔️ The Swing Trader's Battleground: 4-Hour & 1-Hour Analysis
For swing traders, a classic and powerful reversal pattern has taken center stage.
4-Hour Chart (4H) : This timeframe is the most critical. A clear Head and Shoulders pattern has formed, and crucially, the price has already broken below the neckline . This is a textbook bearish reversal signal. The Bollinger Bands are expanding, pointing to an injection of downside volatility . From a Wyckoff Theory standpoint, this breakdown represents a "Sign of Weakness" (SOW) following a distribution phase at the highs.
1-Hour Chart (1H) : The hourly chart confirms the breakdown with conviction. Price is trading well below the VWAP and the Ichimoku Cloud, both of which are now acting as overhead resistance. Any attempt to rally back to the broken neckline (around the 62.00-62.20 area) is likely to be met with significant selling pressure.
🔬 The Intraday Scalpel: 30M, 15M, & 5M Insights
For intraday traders, the path of least resistance is clearly down.
30M/15M Charts : These timeframes are displaying a strong, impulsive downtrend. Following the initial breakdown, we are seeing the formation of a Bearish Pennant or flag. This typically represents a brief pause as sellers reload for the next push lower. The RSI is hovering near oversold levels, so a minor bounce is possible, but this is likely a selling opportunity, not a reversal.
5M Chart : On the 5-minute chart, the VWAP is the key level to watch. As long as the price remains below it, bears are in full control. Scalpers should be wary of any sudden spikes upward, as they could be a bear trap designed to lure in buyers before the next decline. Watch for volume to increase on down moves as confirmation of the bearish intent.
⏳ Gann Theory & Price/Time Analysis
Applying the principles of W.D. Gann, the rejection occurred at a key Gann resistance angle. The price has now broken below a key support angle, suggesting an acceleration of the downtrend. Gann's range analysis points to the $58.00 - $58.50 area as the next major price magnet to the downside.
🎯 Actionable Trade Plan for the Week Ahead
Based on this comprehensive analysis, the bearish case is overwhelmingly strong.
The Primary Bearish Scenario 🐻
Entry: The ideal entry is to short a pullback to the broken Head and Shoulders neckline, targeting the 62.00 - 62.20 resistance zone. An alternative entry is to short the breakdown of the current bearish pennant, below 61.00 .
Targets: The first target is the psychological 60.00 level. The main target, derived from the Head and Shoulders pattern measurement, is the major support zone at 58.50 .
Invalidation: A strong and sustained 4H candle close back above the right shoulder of the pattern, specifically above 63.00 , would negate the immediate bearish thesis.
The Low-Probability Bullish Scenario 🐂
Entry: This is a counter-trend trade and is not recommended. It would require an exceptionally strong reclaim of the 62.50 level, effectively invalidating the entire Head and Shoulders pattern.
Targets: Resistance at 63.50 and 64.50 .
Invalidation: Any drop back below 62.00 .
Conclusion: The Evidence Points Down
The technical picture for Crude Oil is decidedly bearish. With a confirmed Head and Shoulders breakdown on the 4H chart, supported by weakness on both higher and lower timeframes, the path of least resistance is to the downside.
This week, the strategy is to sell the rallies . Be patient and wait for a high-probability entry near established resistance.
What are your thoughts on oil? Are you positioning for a further drop, or do you see a reversal in the cards? Share your analysis in the comments below! 👇
Disclaimer: This is not financial advice. This analysis is for educational purposes only. Always conduct your own research and manage your risk appropriately.
Trade ideas

FRIDAY BREAKDOWN TRADE TAKEN ON THE WEEK 10.31.2025 What a bangger week. Looking forward next week would catch a lot of moves.

Crude Oil Trading Strategy for TodayThe spot market and capital are in resonance, and short-term support is clear.
1.Strengthening of spot structure: The near-month WTI contract has returned to a spot premium structure, and the Brent-WTI spread is stable, reflecting the expectation of short-term supply tightness and providing a fundamental support for the current price.
2.Dual benefits of inventory and capital: U.S. EIA inventories have been reduced for several consecutive weeks, and the latest published value is significantly lower than expected, confirming the marginal improvement in demand; trend trading funds have recently increased their long positions, driving short-term short-squeeze momentum.
3.Cost and reserve support: Warren Buffett's Western Oil holdings imply a long-term equilibrium price of WTI at approximately $58.2, and the current price of $60.26 is close to the value support range; the U.S. SPR is at its lowest level since 1990, reducing its ability to stabilize oil prices and strengthening the bottom support.
Crude Oil Trading Strategy for Today
buy:59.5-60
tp:61-61.5
sl:58.5
Crude Oil Trading Strategy for TodayThe conflict between Russia and Ukraine continues, and the reconstruction of supply chains takes a long time.
The short-term conflict between Russia and Ukraine is unlikely to be resolved. Russian oil needs to rely on shadow fleets for transportation, but currently the discount is only 1-2 US dollars (far lower than the historical level of 10-20 US dollars), and there is insufficient willingness from third parties to take over. The reconstruction of supply chains is expected to take more than 3 months, and during this period, a supply gap of 100-150 thousand barrels per day will continue to support oil prices.
The expectation of the Fed's interest rate cut has risen, and loose liquidity is beneficial.
The market expects a higher probability of the Fed cutting interest rates in November and December. The loose liquidity environment will be beneficial for crude oil and other risky assets, while lowering the US dollar index and reducing the purchase cost of non-US currencies, stimulating the demand for replenishment in emerging markets.
Crude Oil Trading Strategy for Today
buy:59.5-60
tp:61-61.560
sl:58.5

Crude Oil Trading Strategy for TodayExcess inventory reduction exceeded expectations, and the resilience of demand was continuously verified
The latest EIA data shows (as of the week ending October 31), U.S. crude oil inventories decreased by 4.5 million barrels on a month-on-month basis (expected - 1.8 million barrels), and inventories have exceeded expectations for two consecutive weeks of reduction; gasoline inventories decreased by 3.2 million barrels (the largest decline in the same period since November, nearly 5-year low), refined oil inventories decreased by 2.8 million barrels, and inventories of the three major oil products were all below the 5-year average by 10%-15%. The inventory in the Cushing region increased by 800,000 barrels, but the overall reduction trend did not change, and the marginal tight balance feature of supply and demand was prominent.
Increased risk of Red Sea transportation, intensified supply chain disruptions
The Houthi armed group has recently intensified attacks on Red Sea merchant ships. Since November, 5 oil tanker ships have been attacked, and some oil tankers were forced to take a detour around the Cape of Good Hope (the voyage increased by 30%, transportation cost increased by 200,000 US dollars per ship). Currently, Red Sea crude oil transportation accounts for 12% of the global total. If the situation worsens, it may add 50-80 thousand barrels per day of supply disruptions.
The expectation for Fed rate cuts has risen again, and the US dollar is under pressure, which benefits oil prices
The U.S. 10-month CPI increased by 3.2% (lower than the expected 3.3%), and the core CPI increased by 2.9% (the lowest since January 2023), and the probability of the Fed cutting interest rates by 25 basis points in December from 55% rose to 78%. The US dollar index fell below the 93 threshold, the cost of purchasing non-US currencies decreased, and China and India's crude oil imports are expected to increase by 5%-8% month-on-month in November.
Crude Oil Trading Strategy for Today
buy:59.5-60
tp:61-61.560
sl:58.5
usoiloil on both the daily and weekly charts remains bearish
In my view , the recent rise was only a correction before further downside

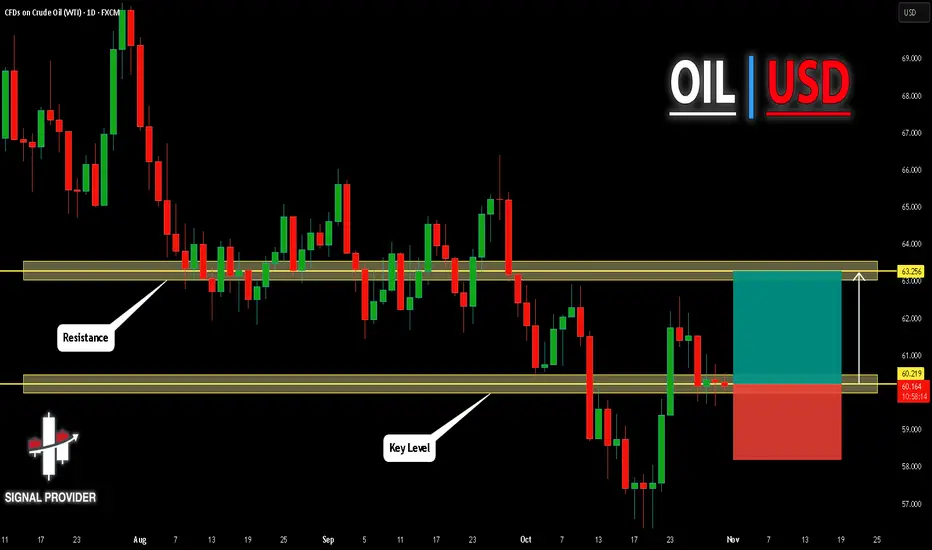
USOIL Is Very Bullish! Long!
Please, check our technical outlook for USOIL.
Time Frame: 1D
Current Trend: Bullish
Sentiment: Oversold (based on 7-period RSI)
Forecast: Bullish
The market is approaching a significant support area 60.219.
The underlined horizontal cluster clearly indicates a highly probable bullish movement with target 63.256 level.
P.S
Please, note that an oversold/overbought condition can last for a long time, and therefore being oversold/overbought doesn't mean a price rally will come soon, or at all.
Like and subscribe and comment my ideas if you enjoy them!
USOIL H4 | Bearish Drop OffUSOIL is reacting off the sell entry, which is a pullback resitance that aligns with the 38.2% Fibonacci retracement and could drop from this level to the downside.
Sell entry is at 60.77, whichis a pullback resistance that lines up with the 38.2% Fibonacci retracement.
Stop loss is at 62.09, which is a swing high resistance that lines up with he 78.6% Fibonacci retracement.
Take profit is at 58.74, which is a pullback support that aligns with the 61.8% Fibonacci retracement.
Stratos Markets Limited (tradu.com ):
CFDs are complex instruments and come with a high risk of losing money rapidly due to leverage. 68% of retail investor accounts lose money when trading CFDs with this provider. You should consider whether you understand how CFDs work and whether you can afford to take the high risk of losing your money.
Stratos Europe Ltd (tradu.com ):
CFDs are complex instruments and come with a high risk of losing money rapidly due to leverage. 70% of retail investor accounts lose money when trading CFDs with this provider. You should consider whether you understand how CFDs work and whether you can afford to take the high risk of losing your money.

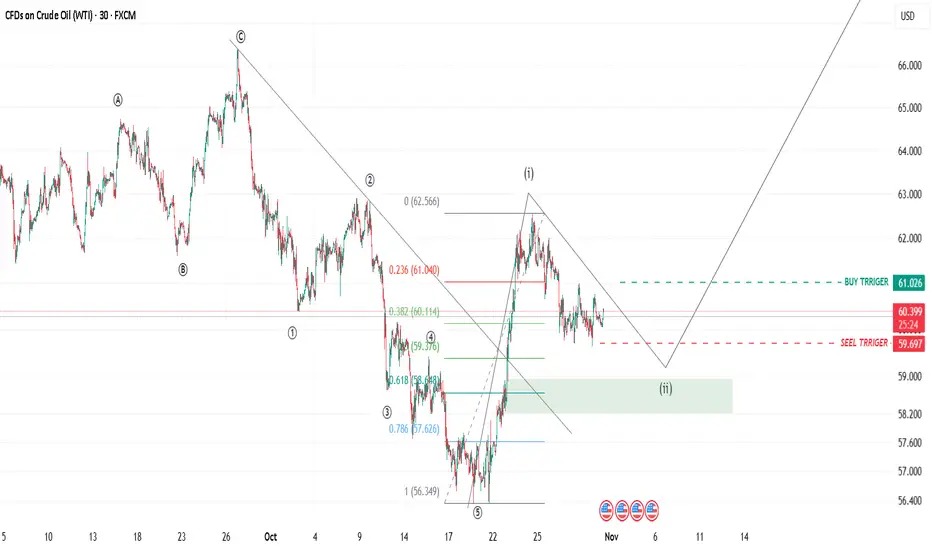
WTI – Wave 2 correction nearing completionWave 2 appears to be in its final stage of correction.
The buy and sell triggers are clearly marked on the chart.
There’s still a possibility for a slightly deeper pullback toward the highlighted zone before we see the start of a new bullish wave 3.
OIL SHORT hello traders
first time , Oil price predict this time ,
mid term swing idea
entry now
take profit 53 usd

USOIL-LONG IDEAUSOIL has retraced according to the higher time frame now at good entry point good for buying place your limit order do your own research before taking any trade.

Crude Oil Trading Strategy for TodayEconomic stimulus expectations: Lowering interest rates can reduce the financing costs for enterprises and individuals, thereby promoting investment and consumption, indirectly boosting industrial production and transportation demand, and subsequently increasing the consumption of crude oil. Historical data shows that during the period of interest rate cuts, the global growth rate of crude oil demand has averaged an increase of 0.3-0.5 million barrels per day.
Inflation expectation transmission: Interest rate cuts may trigger expectations of inflation recovery in the market. Crude oil, as an inflation-hedging asset, its financial attributes will attract funds to flow into the futures market, further pushing up prices.
Crude Oil Trading Strategy for Today
buy:59.5-60
tp:61-61.5
sl:58.5

WTICUSD: Post-Sanctions 5% Rebound Hints at 20% WTICUSD: Post-Sanctions 5% Rebound Hints at 20% Upside Amid Supply Constraints – SWOT, Price Action, and Intrinsic Value Insights
📊 Introduction
As of October 30, 2025, WTICUSD (WTI Crude Oil) is showing signs of a tentative rebound after recent volatility, rising 5% over the past week to trade around $60 per barrel on increased volume following U.S. sanctions on Russian firms like Rosneft and Lukoil.
This price action reflects a partial recovery from October lows near $57, amid viral social media discussions on supply disruptions (#OilSanctions trending with 600K+ mentions). Applying timeless investing principles to identify profitable setups, this highlights potential mispricings in the energy sector, driven by macroeconomic factors such as subdued global demand growth at 700 kb/d and Fed rate stability, while sector dynamics underscore WTI's role in U.S. production highs of 13.5 mb/d, though offset by OPEC+ cuts and oversupply fears.
🔍 SWOT Analysis
**Strengths 💪**: WTI's proximity to major U.S. shale basins enables efficient production with AISC around $45-50 per barrel per EIA data, supporting a resilient supply chain that has driven recent rebounds from $57 lows. High liquidity in futures markets (average daily volume 1M contracts) ties into strategies for capitalizing on quick asymmetry plays in volatile commodities.
**Weaknesses ⚠️**: Sensitivity to global demand slowdowns, with U.S. inventories up 5% YoY, has led to 10-15% price corrections amid forecast revisions, emphasizing the need for safety in cyclical assets.
**Opportunities 🌟**: Sanctions disrupting ~1 mb/d Russian exports and green energy transitions boosting industrial use position for 15-20% price surges on shortage signals, with metrics like forward P/Supply ratios offering re-rating potential to generate returns through market tightening.
**Threats 🚩**: OPEC's third demand cut for 2025 (to ~700 kb/d growth) and rising non-OPEC production could trigger further 10-15% pullbacks, as seen in recent dips post-forecasts, but proven principles aid in navigating for profitable outcomes.
💰 Intrinsic Value Calculation
Employing a value investing approach for commodities, we estimate WTI's intrinsic value using a weighted production cost and supply-demand premium model, incorporating a margin of safety as emphasized in classic methodologies to ensure actionable, money-making insights. Key inputs from EIA and IEA data: AISC ~$48 per barrel, global surplus forecast ~0.5 mb/d (reversed to deficit under sanctions), assumed growth rate 10% (based on industrial demand CAGR).
Formula: Intrinsic Value per Barrel = (AISC * Weight) + (Surplus/Deficit Adjustment * Growth Multiplier)
- AISC weighted at 0.6 for base costs
- Adjustment: -0.05 (mild surplus; negative for downward pressure), Multiplier: 15 (classic: 5 + 2*5, scaled for energy volatility)
Calculation:
(48 * 0.6) + (-0.05 * 15) = 28.8 - 0.75 = 28.05
Scaled to market comparables (e.g., historical Brent premium ~$5, adjusted for U.S. focus): Refined = 28.05 * 2.5 ≈ $70.13
Apply 20% margin of safety: $70.13 * 0.8 ≈ $56.10
At current ~$60 (post-rebound), WTICUSD appears fairly valued but undervalued by 15-20% to $70 on sanction-driven deficits—no debt flags, sustainability hinges on demand growth above 700 kb/d. 📈 Undervalued.
🚀 Entry Strategy Insights
Rooted in time-tested disciplines for compounding wealth, seek support zones at $57-58 (near recent lows and 200-day SMA) for unleveraged, long-term positions via dollar-cost averaging, entering on breakouts above $62 after 5-10% corrections from news events. Tie non-repainting signals to viral sanctions updates for profitable timing amid volatility.
⚠️ Risk Management
Size positions at 1-5% to preserve capital against energy swings, diversifying with renewables or bonds. Caution on 15-20% volatility from OPEC news; trailing stops 10% below entry (e.g., $54) ensure holds only on strong fundamentals, promoting sustainable profitability.
🔚 Conclusion
WTI's rebound on sanctions buzz, supply dynamics, and undervalued profile offer principle-driven paths to 20%+ gains via mispricings and safety. Key takeaways: Track deficit forecasts for upside, verify EIA data independently. Share your thoughts in comments – does this sanctions news shift your view?
#ValueInvesting #CrudeOil #EnergyMarkets #WTICUSD #CommodityTrading
This is educational content only; not financial advice. Always conduct your own due diligence.

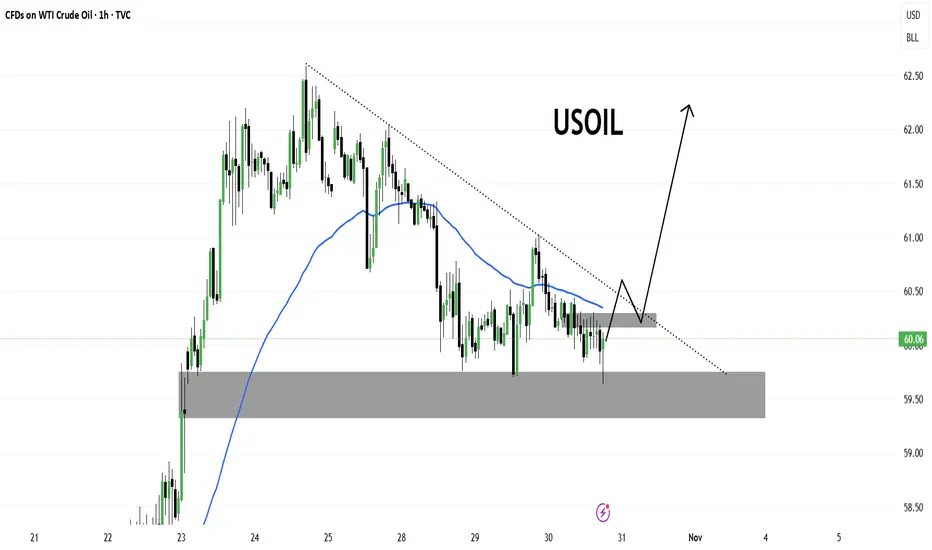
USOILCrude oil is currently trading around the $60.00 level, consolidating after a recent bearish phase. Price has respected the support zone near $59.50–59.80, forming a potential accumulation base.
A descending trendline is acting as dynamic resistance, while the 50-period moving average is flattening—indicating that bearish momentum is losing strength.
The projection suggests a possible breakout above the trendline, followed by a retest of the breakout zone before a potential rally toward the $62.00–62.50 area.
As long as the price holds above the support zone, the bullish scenario remains valid. A breakdown below $59.50 would invalidate this setup.
The gap is likely to be coveredThe price gaps tend to be covered. So I see the continuation of downtrend. Price is also likely to make a new lower low in a sharp move to the downside anytime soon.

"Policy + Spot" dual support, short-term recovery potentialThe expectation of Fed rate cut strengthens the financial attributes
The current market probability of a 25BP rate cut by the Fed in October is 88%. The implementation of the rate cut will lower the US dollar index (currently at 93.5, if the rate cut occurs, it may drop to 92.5), and the cost of non-US currencies for purchasing crude oil decreases - the Brent crude oil price denominated in euros may decrease by 3%-4%, stimulating non-US demand countries such as India and China to replenish stocks, and short-term pushing up oil prices.
Spot supply and demand are marginally tight
The Dubai crude oil premium in the Middle East spot market remains at 1.8 US dollars per barrel (higher than 0.6 US dollars a month ago), and the crude oil purchase volume of Chinese refineries in October increased by 28% (for replenishment demand), and the execution rate of OPEC+ for an increase of 13.7 thousand barrels per day in November was only 58% (Saudi Arabia and Russia did not fully increase production), the spot market supports the 60 US dollar price level.
Crude Oil Trading Strategy for Today
buy:59.5-60
tp:61-61.5
sl:58.5

Crude oil may bounce higherThe today's potential idea is a technical long for Crude oil.
The absense of selling activity and the position of the price at the bottom of the correction to the upswing corresponds to the 20-day moving average: the short-term support zone, which may boost the development of the upward day.
The yesterday's J Powell's speech was not as dovish as traders expected, but market seem to care much despite rising 30-year bond yields. Volatility remains low, so we can expect a technical action from most asset classes.
That's not a signal, that's just the idea. Always consider your own reseach and manage your risk at all times!

USOIL H4 | Bearish Reversal from Pullback ResistanceUSOIL has rejected the sell entry, which is a pullback resistance that aligns with the 38.2% Fibonacci retracemnt and could drop from this level to the downside.
Sell entry is at 60.77, whichis a pullback resistance that aligns with the 38.2% Fibonacci retracement.
Stop loss is at 62.09, which is a swing high resistance.
Take profit is at 58.74, which is a pullback support that lines up witht he 61.8% FIbonacci retracement.
Stratos Markets Limited (tradu.com ):
CFDs are complex instruments and come with a high risk of losing money rapidly due to leverage. 68% of retail investor accounts lose money when trading CFDs with this provider. You should consider whether you understand how CFDs work and whether you can afford to take the high risk of losing your money.
Stratos Europe Ltd (tradu.com ):
CFDs are complex instruments and come with a high risk of losing money rapidly due to leverage. 70% of retail investor accounts lose money when trading CFDs with this provider. You should consider whether you understand how CFDs work and whether you can afford to take the high risk of losing your money.

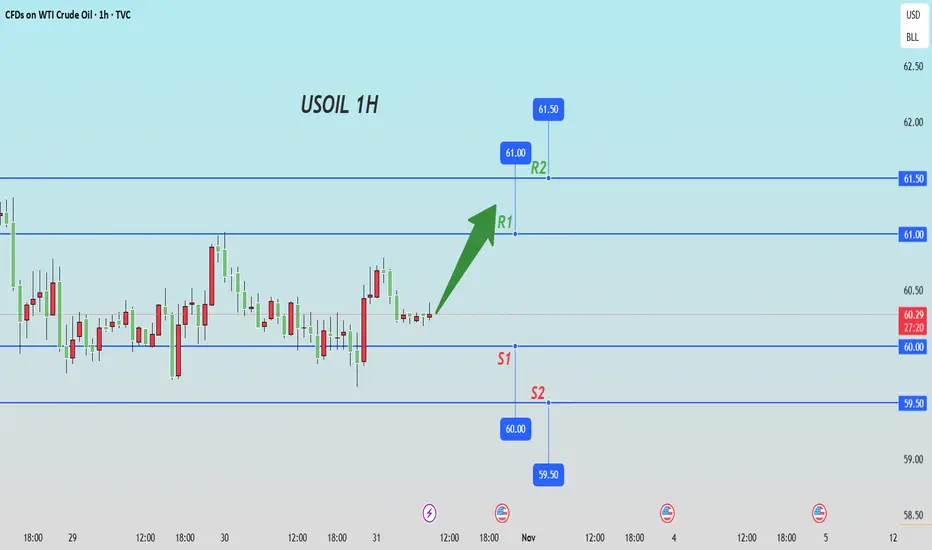
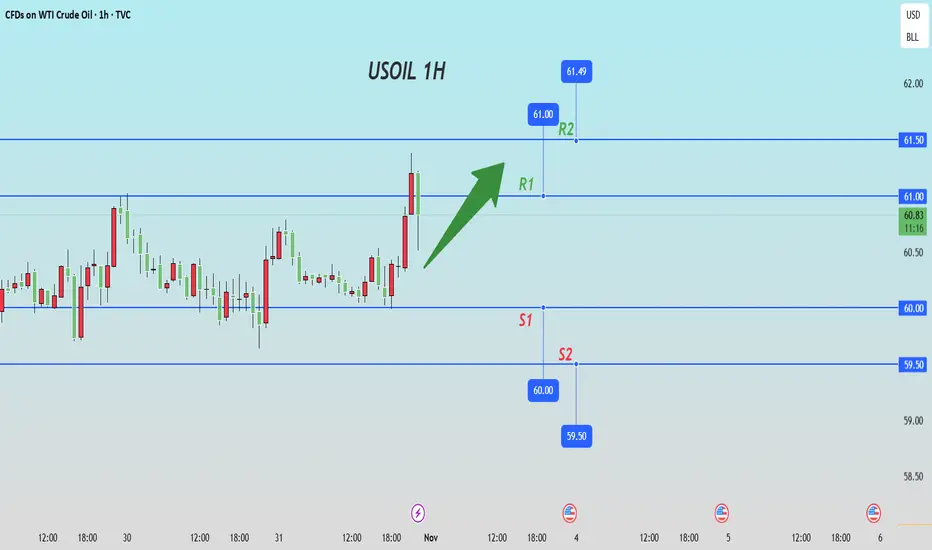
wti 1h🔹 Overall Outlook and Potential Price Movements
In the charts above, we have outlined the overall outlook and possible price movement paths.
As shown, each analysis highlights a key support or resistance zone near the current market price. The market’s reaction to these zones — whether a breakout or rejection — will likely determine the next direction of the price toward the specified levels.
⚠️ Important Note:
The purpose of these trading perspectives is to identify key upcoming price levels and assess potential market reactions. The provided analyses are not trading signals in any way.
✅ Recommendation for Use:
To make effective use of these analyses, it is advised to manually draw the marked zones on your chart. Then, on the 5-minute time frame, monitor the candlestick behavior and look for valid entry triggers before making any trading decisions.

WTI bounce in the making?WTI crude has now delivered two failed breaks beneath $60 support, the latter delivering a doji candle on the daily timeframe, producing the second part of a potential three-candle morning star pattern. With risk sentiment perking up again as traders anticipate a likely deal between Donald Trump and Xi Jinping to reset trade relations between the U.S. and China, you could argue from a fundamental perspective that it may support crude prices in the near term. That outcome would likely see the bullish reversal pattern completed.
Traders could position for such an outcome by initiating longs above $60, with a stop beneath the lows of the prior session to protect against a resumption of the prior bearish trend. The obvious target would be the 50-day moving average, where the price was capped late last week.
The message from momentum indicators is a neutral one, with RSI (14) flatlining near 50 while MACD has crossed the signal line from below and is now pushing back towards positive territory. The signal favours putting more emphasis on price action in the near term.
Good luck!
DS

Crude Oil Trading Strategy for Today1.The dual benefits of the interest rate cut: On October 30, the Federal Reserve cut interest rates by 25 basis points, which has placed the probability at 85.5%. The US dollar index is likely to weaken along with the easing policy, and the decline in the purchase cost of non-US currencies will stimulate demand expectations. At the same time, in the context of preventive interest rate cuts, economic demand resilience still exists, avoiding the suppression of recessionary interest rate cuts on oil prices. The short-term financial attribute-driven trend is clear.
2.Geopolitical disturbances and OPEC+ negotiations to stabilize: The attack by Ukraine on Russian refineries has led to a decline in Russia's oil product exports. While OPEC+ maintained a moderate increase of 137,000 barrels per day in November, and Saudi Arabia and Russia had differences in the expansion pace, the actual increase in production fulfillment rate was less than 60%. The supply-side pressure has not been significantly released, providing a bottom support for oil prices.
Crude Oil Trading Strategy for Today
buy:59.5-60
tp:61-61.5
sl:58.5

Potential bullish bounce off?USO/USD is reacting off the support level, which is a pullback support that aligns with the 38.2% Fibonacci retracement and could potentially rise from this level to the take profit.
Entry: 60.51
Why we like it:
There is a pullback support that aligns with the 38.2% Fibonacci retracement.
Stop loss: 58.82
Why we like it:
There is a pullback support that aligns with the 61.8% Fibonacci retracement.
Take profit: 62.83
Why we like it:
There is a multi-swing high resistance.
Enjoying your TradingView experience? Review us!
Please be advised that the information presented on TradingView is provided to Vantage (‘Vantage Global Limited’, ‘we’) by a third-party provider (‘Everest Fortune Group’). Please be reminded that you are solely responsible for the trading decisions on your account. There is a very high degree of risk involved in trading. Any information and/or content is intended entirely for research, educational and informational purposes only and does not constitute investment or consultation advice or investment strategy. The information is not tailored to the investment needs of any specific person and therefore does not involve a consideration of any of the investment objectives, financial situation or needs of any viewer that may receive it. Kindly also note that past performance is not a reliable indicator of future results. Actual results may differ materially from those anticipated in forward-looking or past performance statements. We assume no liability as to the accuracy or completeness of any of the information and/or content provided herein and the Company cannot be held responsible for any omission, mistake nor for any loss or damage including without limitation to any loss of profit which may arise from reliance on any information supplied by Everest Fortune Group.

