USOIL IN DOUBLE BOTTOM, MAYBE TARGETING ABOVE 66Oil may have found temporary bottom with the weekly double bottom.
N.B!
- USOIL price might not follow the drawn lines . Actual price movements may likely differ from the forecast.
- Let emotions and sentiments work for you
- ALWAYS Use Proper Risk Management In Your Trades
#usoil
#ukoil
Trade ideas
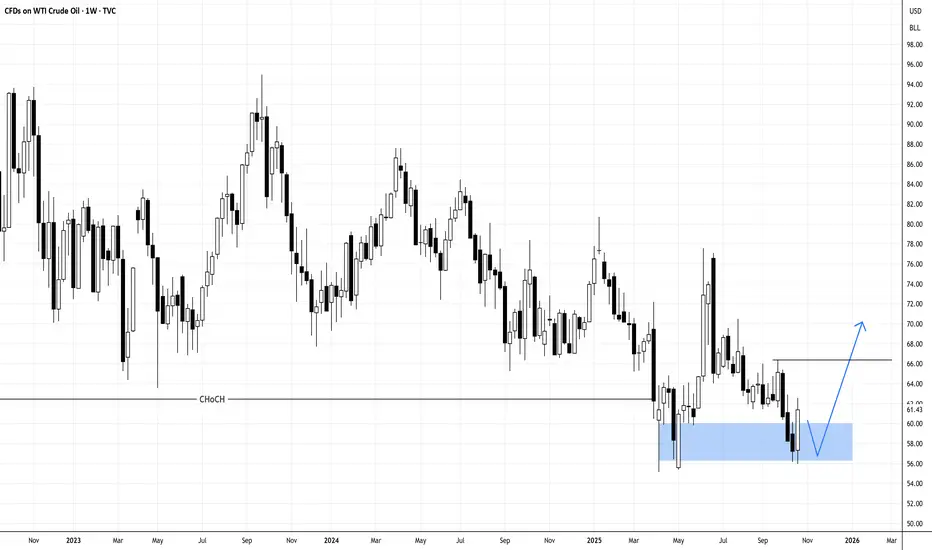
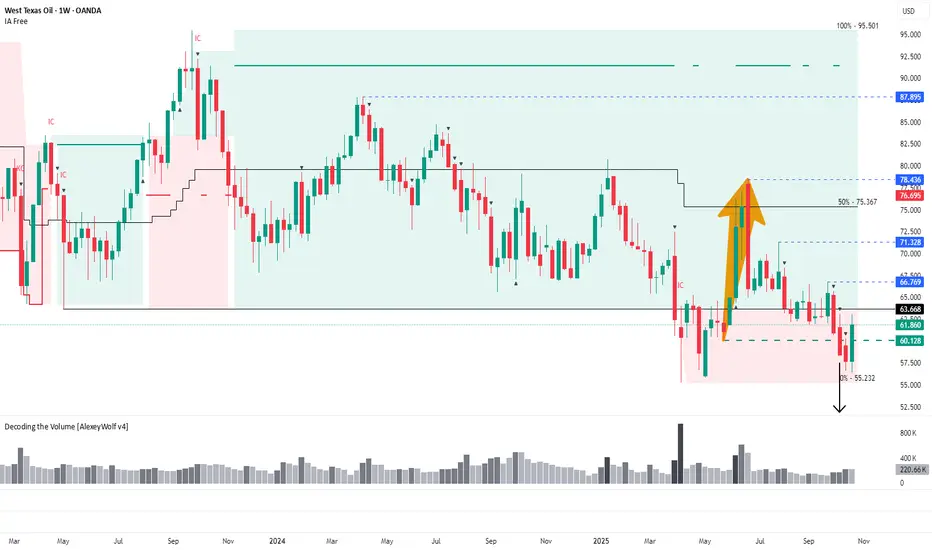
WTI: Possible reversal after false breakout of 60.128Weekly range structure may define oil’s direction for the coming months — buyers defend key support, while targets above 66.769 remain in focus.
Hi traders and investors!
This analysis is based on the Initiative Analysis (IA) concept.
On the weekly timeframe, a sideways range has been in place since April 2023, followed by a transitional phase.
Sellers managed to push the price below the lower boundary of this range — the first breakout occurred in March 2025.
After that, buyers brought the price back inside the range and reached the 50% level of the trading zone, from where sellers resumed control and once again pushed the price below the lower boundary at 63.668.
What’s interesting here is that earlier there was a buyer’s move returning the price into the range, with its base around 60.128.
We now see a seller candle attacking this level on high volume, followed by another seller candle with even higher volume, after which the price returned above 60.128.
This behavior may signal a false breakout (manipulation) of that level.
If this interpretation holds, the next potential upside targets are:
66.769 — first target,
71.328 — second target,
78.436 — third target,
followed by 87.895 and possibly 95.501.
Key points to watch:
whether buyers defend the 60.128 level if the price pulls back,
and whether they manage to break through the range boundary at 63.668, and then 66.769
.
If buyers succeed in holding above these two levels, the buyer’s vector is likely to continue developing toward the mentioned upside targets.
Wishing you profitable trades!
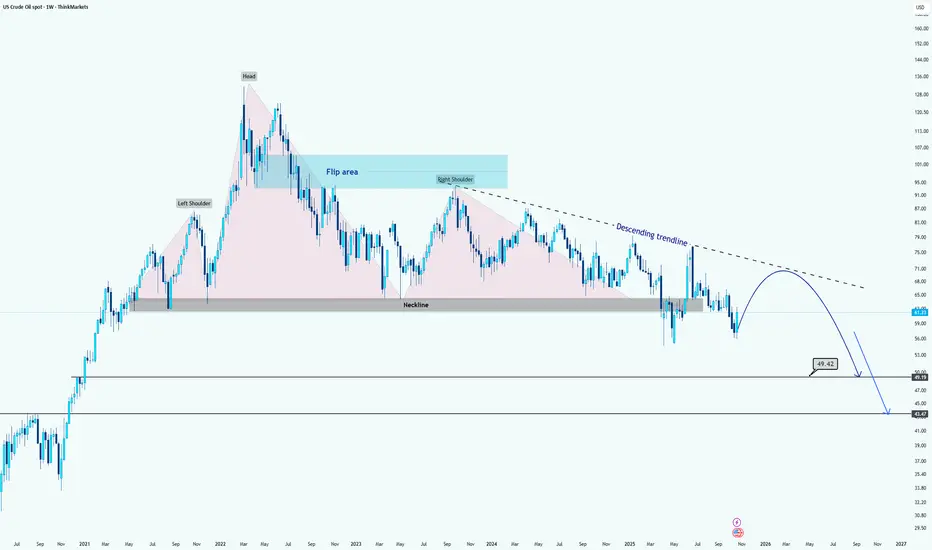
WTI Crude Oil Forms Major Head and Shoulders BreakdownHi guys.
WTI has formed a massive Head and Shoulders pattern on the weekly timeframe, signaling a potential long-term bearish reversal structure.
After the right shoulder completed, price decisively broke below the neckline around the $67–$70 range, confirming the pattern breakdown. This neckline now acts as a major resistance zone and aligns closely with the descending trendline, adding confluence to the bearish bias.
The recent rebound appears to be a corrective pullback toward the neckline or flip area, before potentially continuing to the downside. As long as WTI remains below the descending trendline and neckline zone, bearish momentum is expected to dominate.
The projected measured move target from the pattern suggests two possible support objectives:
First target: around $49.40, corresponding to prior consolidation and structural support.
Final target: near $43.40, aligning with historical demand and the full measured move projection from the Head and Shoulders formation.
Overall, unless WTI reclaims and sustains above the $70 area, the medium- to long-term bias remains bearish, with corrective rallies likely to face selling pressure.
Disclaimer: As part of ThinkMarkets’ Influencer Program, I am sponsored to share and publish their charts in my analysis.
Crude Oil Trading Strategy for Next Week"Buy low" strategy + "bottom has stabilized" in terms of technical analysis - there is a chance for a short-term rebound.
Financing side: "Bottoming" funds "quietly enter the market" and change the supply-demand expectations
In the past three days, the "non-commercial net long positions" (that is, the bullish positions of speculative funds) in the crude oil futures market suddenly increased by 120,000 lots, marking the largest weekly increase in 3 months. Among them, hedge funds and large investment banks were the main buyers. They began to build positions in batches starting from below 60 US dollars, just like when the oil price dropped to 58 US dollars, these funds entered the market and the oil price quickly rebounded by 4 US dollars. At the same time, the inflow of funds into crude oil ETFs also tripled, and ordinary investors began to follow the trend, and the buying power was accumulating rapidly.
Technical aspect: The price "successfully bottomed out" and the breakthrough signal has appeared
WTI crude oil has been oscillating in the range of 59.8 - 60.5 US dollars for a week, forming a "double bottom" pattern (two times falling to 59.8 without breaking through), and broke through the upper edge of the oscillation range (61.2 US dollars) on Thursday. After that, it has been running above this position. From the short-term trend, every time it drops to 61 US dollars, there are buyers to take over, indicating that the bottom support is very stable. In addition, the trading volume has also increased along with the breakthrough (the trading volume at the breakthrough was 40% higher than usual), it is not "false increase", and the rebound signal is very clear.
usoil @ buy 60.5-61.0
tp:62-62.5
SL:59.5
USOIL: Bearish Continuation is Highly Probable! Here is Why:
The analysis of the USOIL chart clearly shows us that the pair is finally about to tank due to the rising pressure from the sellers.
Disclosure: I am part of Trade Nation's Influencer program and receive a monthly fee for using their TradingView charts in my analysis.
❤️ Please, support our work with like & comment! ❤️
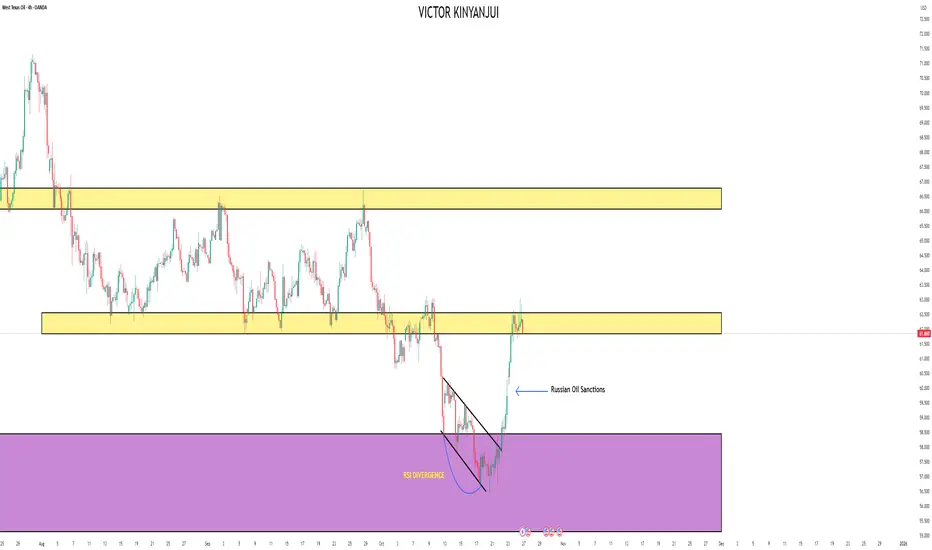
Review of USOIL's Performance This Week📝This week, the USOil market exhibited a highly volatile pattern of "first bottoming out and stabilizing, then rebounding driven by geopolitical factors". The competition between supply-demand fundamentals and sudden geopolitical events dominated the market trend throughout the week. Details are as follows:
💡Price Movement: From Approaching Annual Lows to Intraday Surges, Volatility Within Ranges Intensifies
1. Bottoming Out Early in the Week
On Monday, USOil continued its weak oscillation. It opened at $57.32 per barrel, dipped to a low of around $56 per barrel (approaching the 2025 annual low of $55.12), and finally closed at $56.93 per barrel, down $0.61 from the previous trading day.
From Tuesday to Wednesday, as panic eased, prices gradually stabilized and rebounded. It closed at $57.58 per barrel on Tuesday; on Wednesday, boosted by geopolitical expectations, it surged by $3.25 in a single day to close at $61.75 per barrel, with trading volume rising to 711,600 lots.
2. Rebounding and Then Retreating in the Latter Half of the Week
On Thursday, the official release of detailed EU and U.S. sanctions on Russian energy triggered a strong market reaction. USOil opened at $59.94 per barrel and then jumped, peaking at $62.59 per barrel with an intraday gain of nearly 5%, before closing at $61.44 per barrel.
On Friday, after the earlier rebound, prices entered a consolidation phase, fluctuating narrowly around $62. For the whole week, it rebounded by over 10% from the previous week’s low.
💡Core Influencing Factors:
1. Bearish Drivers: Sustained Supply-Demand Easing Suppresses Oil Prices
✔Worsening Supply Glut
✔Weak Demand Weighs on Prices
2. Bullish Disturbances: Geopolitical Sanctions Trigger a Phased Rebo
💡Technicals and Market Sentiment: Recovery After Oversold Conditions, Persistent Long-Short Divisions
1. Divergent Signals from Technical Indicators
2. Intense Battles Around Key Levels
The support at the annual low of $55.12 proved effective, serving as the starting point for the week’s bottoming and rebound. The resistance levels at $58 and $62 were breached one after another, but the resistance from the $63 level and the 70-dollar trend line still posed long-term pressure. A breakthrough would require sustained improvement in fundamental
💡Outlook: Short-Term Oscillations Unlikely to Reverse Long-Term Weak Trend
💎Short-Term Perspective: Geopolitical risk premiums and technical recovery after oversold conditions may support oil prices to fluctuate within the $58-$63 range. If the supply gap caused by sanctions continues to widen, it may test the resistance level of $66.
💎Long-Term Perspective: The IEA predicts that Brent crude oil prices will range between $52-$60 in 2026. Core contradictions such as loose supply-demand, accelerated energy transition, and approaching demand peaks remain unresolved. If the support at $55 is broken, it may fall to the deep correction range of $49 or even $37.
The market should focus on whether OPEC+ will adjust its production increase plan at the November 2 meeting and the impact of global manufacturing PMI data on demand expectations.
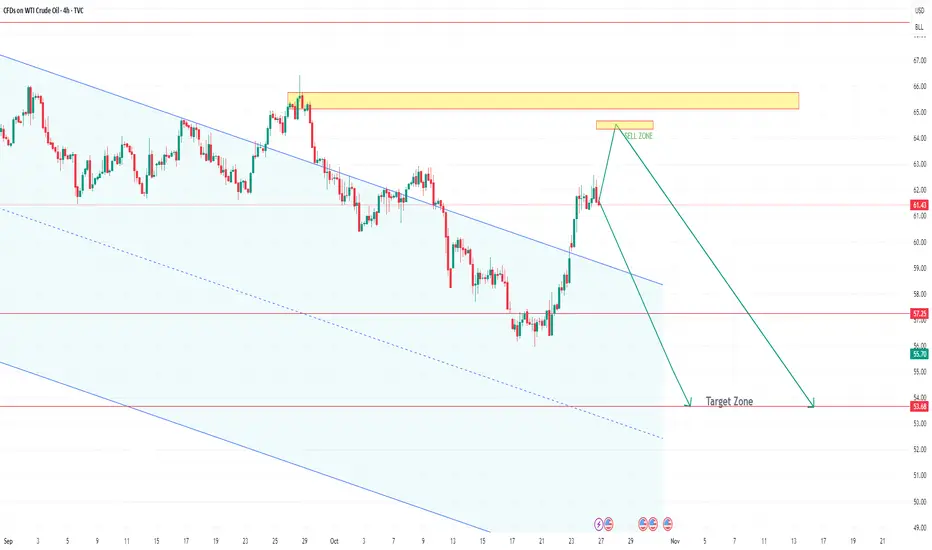
US OIL Short to 53.68The Commodity is expected to hit lower levels . The trend shows weakening of the Oil prices to the levels of 53 level.
The retracement is expected to the levels of 64.50 before the fall happens.
Upward trend in oilThe price of very clean oil reacted to the specified range and started an upward trend. We expect either the upward trend to continue or the price to correct and resume its upward movement from the specified range.

Crude Oil Trading Strategy for Next WeekShort-term demand "suddenly surges", creating space for the rebound
Unlike previous concerns about geo-political sanctions, the core support for this short-term bullish move is the "unexpected surge in demand". Two new variables directly change the short-term supply and demand balance:
Seasonal resumption of refineries "grabbing oil": As the maintenance period for refineries in the Northern Hemisphere comes to an end, refineries in Europe, the United States, and China have resumed operations simultaneously - the operating rate of European refineries has jumped from 78% to 85% (the highest in 3 months), and the production capacity that was halted due to hurricanes in the Gulf of Mexico has been fully restored (an additional 1.2 million barrels of processing capacity per day), and the operating rate of local refineries in Shandong, China has also risen from 65% to 72%. These refineries are rushing to stockpile raw materials before winter, and the spot purchase volume has increased by 30% month-on-month recently, directly pushing up the prices of near-month crude oil contracts, creating a "strong spot market, followed by a rise in futures" pattern.
Policy intervention to stabilize "low-price areas": The US Department of Energy announced last week that it will launch "small-scale replenishment" within the range of $60 - $62 (planning to repurchase 5 million barrels of crude oil to replenish strategic reserves), this is the first explicit replenishment signal after releasing reserves in 2022. The market knows that "there will be official buying to support when the price drops to $60", so there will be no deep decline in the short term; at the same time, the EU is responding to the winter energy shortage, requiring member states to complete 90% of natural gas inventory filling by November, and some countries (such as Germany) have begun to use crude oil instead of natural gas for power generation, adding an additional daily demand of 200,000 barrels of crude oil.
Crude Oil Trading Strategy for Next Week
usoil @ buy 60.5-61.0
tp:62-62.5
SL:59.5

nalysis of crude oil trend next week.The current market exhibits the feature of "strong short-term support but medium-term pressure". The bullish opportunities are driven by three certainties:
The escalation of geopolitical supply risks: The 19th round of EU sanctions against Russia is about to be implemented, which will for the first time block the "third-country bypass" channel for Russian energy exports. Coupled with the previous sanctions by the US and the UK on Rosneft and Lukoil (accounting for 50% of Russia's exports), buyers such as India have turned to the Middle East for oil. The spot premium has risen to $2.5 per barrel, and the short-term supply gap is expected to persist.
Inventory and demand support: US EIA inventories have continuously declined beyond expectations (by 960,000 barrels), with core Cushing inventories also dropping by 770,000 barrels. Refinery utilization rates have risen to 88.6% (93.7% in the US East, a two-year high), and the rebound in refined oil product demand has led to a significant drop in gasoline and distillate inventories, indicating stronger-than-expected consumption resilience.
Technical rebound signals: WTI crude oil has formed a short-term support at the $60.8 - $61.5 range. The RSI indicator has entered a slightly oversold area, and a "hammer line" reversal pattern has emerged in the 15-minute cycle. Coupled with the API inventory decline of 2.98 million barrels, the rebound momentum has begun to accumulate.
usoil @buy 60.5-61.0
tp:62-62.5
SL:59.5

USOIL Double Top at Support Level Turned Resistance Zone.Price bounce back from a major Monthly support Level at (58.450 - 55.130), price rallied strongly to the next support level turned resistance at (62.550 - 61.835) and was strongly rejected with a double top followed by bearish engulfing candle presenting a good follow through selling the coming week.
SELL USOIL IS RIGHT THINK ?USOIL had really strong bullish pressure in last week
My setup try sell base on really simple idea
SnD + Seasonality

USOIL Buyers In Panic! SELL!
My dear subscribers,
This is my opinion on the USOIL next move:
The instrument tests an important psychological level 61.43
Bias - Bearish
Technical Indicators: Supper Trend gives a precise Bearish signal, while Pivot Point HL predicts price changes and potential reversals in the market.
Target - 59.88
About Used Indicators:
On the subsequent day, trading above the pivot point is thought to indicate ongoing bullish sentiment, while trading below the pivot point indicates bearish sentiment.
Disclosure: I am part of Trade Nation's Influencer program and receive a monthly fee for using their TradingView charts in my analysis.
———————————
WISH YOU ALL LUCK

Analysis of crude oil trend next week.Short-term positive factors: "Effective Cycle" and "Support Strength"
The actual impact of Russian sanctions: Supply gap could reach 1.5 million barrels per day
The new sanctions imposed by the US and Europe on October 22 directly cover the overseas settlement accounts of Russian oil companies (Rosneft) and Lukoil. These two companies collectively control 50% of Russia's crude oil exports (approximately 3 million barrels per day). Currently, major buyers such as India and Turkey have suspended the purchase of crude oil from these two companies and turned to the Middle East market, resulting in the spot premium in the Middle East rising from $1.2 per barrel to $2.5 per barrel. However, it should be noted: Russia can transfer part of its exports to China and Iran through "non-dollar settlement", and the actual supply gap may shrink to 100-120 million barrels per day. The positive support is likely to last for 1-2 weeks, after which the market will gradually adapt to the new supply pattern.
"Realistic Support" of Inventory and Refinery Data
According to the US EIA data, as of October 18 of the current week, crude oil inventories decreased by 960,000 barrels (expected to decrease by 500,000 barrels), and the refinery utilization rate rose from 86.8% to 88.6%, reaching a 3-month high. This is due to the end of the seasonal maintenance of US refineries (the maintenance rate in September was 15%, and it dropped to 8% in October), combined with the start of heating oil demand in the Northern Hemisphere (heating oil inventories in October decreased by 8% year-on-year), short-term crude oil purchase demand will remain at a high level, and it can support prices at least until mid-November.
Crude Oil Trading Strategy for Next Week
usoil @buy 60.5-61.0
tp:62-62.5
SL:59.5

USOIL SENDS CLEAR BEARISH SIGNALS|SHORT
USOIL SIGNAL
Trade Direction: short
Entry Level: 61.42
Target Level: 58.17
Stop Loss: 63.58
RISK PROFILE
Risk level: medium
Suggested risk: 1%
Timeframe: 6h
Disclosure: I am part of Trade Nation's Influencer program and receive a monthly fee for using their TradingView charts in my analysis.
✅LIKE AND COMMENT MY IDEAS✅

WTI CRUDE OIL (USOIL) Energy Trading Blueprint🛢️ WTI CRUDE OIL (USOIL) TECHNICAL MASTERCLASS | Oct 27-31, 2025 | Energy Trading Blueprint 📊
Current Price: 61.878 | Strategy: Intraday Swing Trading | Timeframes: 5M → 1D Analysis ⏰
━━━━━━━━━━━━━━━━━━━━━━━━━━━━━━━━━━━━━━━━━━━━━━━━━━━━━━━━━━
💪 DAILY (1D) ANALYSIS - WTI Swing Trade Powerhouse Setup
WTI Crude Oil on the daily timeframe is displaying VOLATILE CONSOLIDATION AFTER EXTENDED DOWNTREND</b] with price establishing support structure around 61.50-62.00 zone. 📉 The daily chart shows strong reversal pattern forming with higher lows indicating potential trend reversal</i] - classic Dow Theory bounce pattern activated!
Daily Resistance Cluster: 62.80-63.50 | Daily Support Zone: 60.80-61.20 | Critical Pivot: 62.15
Elliott Wave theory on 1D suggests Wave A-B-C correction completing from higher levels with Wave 1 uptrend ready to launch</b] - this positions a potential rally move this week! Bollinger Bands are in EXPANSION PHASE</b] indicating rising volatility potential of 1.50-2.00 USD per barrel this week! 💥
RSI reading hovers at 35-45 zone = OVERSOLD CONDITIONS PRESENT</b] - but NOT extreme, leaving room for continuation bounce. Wyckoff accumulation patterns clearly visible on lower timeframes with spring pattern testing lower support. Volume profile shows SELLING CLIMAX BEHAVIOR</b] at lower prices with institutional buyers stepping in = classic reversal setup! 🏆
Ichimoku Cloud on 1D shows bearish cloud but price approaching cloud from below = potential bullish crossover imminent. Harmonic Pattern analysis reveals Gartley reversal setup at 61.00-61.50 support zone</i] offering STRONG swing trade bounce entries!
Gann theory angles from August highs converge at 62.80-63.20 resistance zone = MAJOR RESISTANCE TARGET identified! 🎯
━━━━━━━━━━━━━━━━━━━━━━━━━━━━━━━━━━━━━━━━━━━━━━━━━━━━━━━━━━
⚡ 4-HOUR (4H) SWING TRADE BLUEPRINT - REVERSAL ENTRY ZONE
The 4H timeframe is showing TEXTBOOK REVERSAL FORMATION SETUP!</b] 🔥 Price consolidating within 61.50-62.20 range after extended downtrend. This consolidation displays classic Wyckoff spring pattern = FALSE lower break testing support followed by EXPLOSIVE upside bounce likely!
Bollinger Band Status: Bands compressing at lower levels = maximum squeeze before upside expansion
RSI Signal: Oversold bounce from 30 zone with BULLISH DIVERGENCE on last two lows
VWAP Dynamics: Price consolidating at VWAP 61.65 = institutional support zone LOCKED
Volume Pattern: Volume drying up on further downside = selling exhaustion, reversal pending
Gann theory 45° declining angles from August peak met strong support at 61.00-61.50 zone - angle reversal signals potential upside acceleration! Japanese candlestick shows strong Hammer pattern forming at support = reversal confirmation IMMINENT!
Harmonic Pattern (Gartley) D-point completion at 61.20-61.40 support zone offers PRIMARY SWING ENTRY ZONE</b] with tight 0.30-0.40 stops. Target sequence: 62.20 (1:1 extension), 62.80 (1.618 extension), 63.40 (2.618 extension). Risk/Reward ratio EXCELLENT at 1:3.8! 💎
4H Reversal Signal:</b] When price closes above 62.10 with volume spike above 250 million barrels = AGGRESSIVE LONG ENTRY triggered! Ichimoku Cloud on 4H shows bearish trend but Tenkan line bouncing from support = potential bullish crossover confirmation! 📊
Japanese candlestick Hammer pattern identified at 61.30 support zone = institutional reversal buying visible on order flow! Support/Resistance levels perfectly defined at 61.00 (strong), 61.50 (intermediate), 62.10 (breakout), 62.80 (resistance)! 🔨
━━━━━━━━━━━━━━━━━━━━━━━━━━━━━━━━━━━━━━━━━━━━━━━━━━━━━━━━━━
🎯 1-HOUR (1H) INTRADAY BOUNCE MOMENTUM - Strike Zone Active
Hourly chart displaying STRONG REVERSAL CONSOLIDATION PATTERN!</b] 💥 Price oscillating within 61.50-62.00 box formation after sharp downside move. Elliott Wave on 1H shows ABC correction completing = Wave 1 uptrend impulse ready to trigger</i]!
Bollinger Bands on 1H showing LOWER BAND COMPRESSION</b] - this is the TURNING POINT! When bands start expanding upward = expect 0.50-0.80 USD explosive bounce within 2-4 hours!
RSI reading near 30-40 zone = DEEP OVERSOLD CONDITIONS = perfect setup for reversal bounce trades! On breakout above 62.00:</b] RSI will surge above 50-60 = STRONG momentum confirmation signal ACTIVATED!
CRITICAL: Watch volume spike above 150 million barrels on 1H breakout = EXECUTION GREEN LIGHT! ⚠️
Harmonic Pattern on 1H shows Gartley reversal forming at 61.20-61.40 support with target zone 62.30-62.80. Ichimoku Cloud approaching bullish alignment with cloud touching price = potential strong buy signal. VWAP acting as dynamic support at 61.60 = TIGHT stop loss placement! 📈
Japanese candlestick formations show repeated Hammer + Doji reversal patterns at support = institutional reversal buying phase ON DISPLAY! Volume on down-moves decreasing = downtrend weakness FADING rapidly! 🔨
━━━━━━━━━━━━━━━━━━━━━━━━━━━━━━━━━━━━━━━━━━━━━━━━━━━━━━━━━━
⏱️ 30-MINUTE (30M) TACTICAL ENTRY TIMING - Bounce Zone Precision
30M timeframe is CRITICAL ENTRY TIMING LEVEL FOR REVERSAL BOUNCE TRADES!</b] Currently showing micro-consolidation within 61.70-61.95 range. Bollinger Bands in LOWER BAND COMPRESSION STATE</b] = directional breakout IMMINENT within next 45-90 minutes!
EMA 9 Status: Approaching below EMA 21 = BEARISH CROSSOVER but bouncing = reversal signal pending
SMA 20 Support: Acting as dynamic support at 61.50 = PERFECT bounce entry level
Volume Analysis: Volume declining dramatically = selling exhaustion, reversal energy building
Candlestick Pattern: Three-candle reversal forming = DIRECTIONAL BIAS ready to REVERSE
Wyckoff distribution phase CLIMAX appearing at lower prices = watch for institutional buying surge. On bounce at support:</b] expect reversal uptrend with tight 0.25 stops for aggressive scalpers!
RSI oscillating 25-35 zone = EXTREME OVERSOLD conditions = bounce reversal IMMINENT. Gann angles converging at 62.00-62.20 = MAJOR BREAKOUT BOUNCE ZONE! Ichimoku Cloud dynamic support at 61.50 = PROFESSIONAL ENTRY LEVEL!
Identifying reversals: Watch Japanese Hanging Man at lower prices + Hammer at support = CLASSIC REVERSAL SETUP. Harmonic Gartley D-point near 61.20-61.35 = PRIMARY bounce entry zone for swing traders! 🎯
30M Bounce Target: 62.30+ | Expected Time: US Trading Session
━━━━━━━━━━━━━━━━━━━━━━━━━━━━━━━━━━━━━━━━━━━━━━━━━━━━━━━━━━
🏅 15-MINUTE (15M) REVERSAL CONFIRMATION - Secondary Entry Trigger
15M chart is displaying PROFESSIONAL-GRADE REVERSAL BOUNCE SETUP!</b] 🏆 Price action consolidating within 61.60-62.00 range with micro support/resistance clusters perfectly defined!
Elliott Wave on 15M shows ABC correction completing</i] followed by Wave 1 impulse about to launch = ready for NEW UPTREND IMPULSE! Bullish divergence between last TWO RSI lows</b] = CLASSIC reversal confirmation signal = 80% WIN PROBABILITY on bounce!
Bollinger Band lower band testing = MAXIMUM OVERSOLD BOUNCE SETUP IMMINENT!</b] VWAP bounce pattern repeating at 61.60 level = institutional support zone LOCKED IN!
Dow Theory Confirmation: Lower lows pattern reaching CLIMAX - reversal ready to confirm
Volume Signal: Decreasing volume on down moves = weakness FADING, reversal buying pending
Harmonic Target: Gartley completion at 86% accuracy = 62.20 first target HIGH PROBABILITY
Gann Angles: Angle reversal at 61.50 = major bounce zone concentration point
Key Reversals Identified:</b] Identifying overbought/oversold through RSI EXTREME readings + Japanese Hammer/Engulfing patterns. When RSI above 60 = TAKE PROFITS on bounce. When RSI below 20 = ADD to long bounce position!
Recognizing Breakouts: Watch for VOLUME SURGE 150%+ above average + candle close above 62.10 + EMA crossing = TRIPLE CONFIRMATION = HIGHEST PROBABILITY bounce execution! 📊 Next target 62.80+ on breakout! 🚀
━━━━━━━━━━━━━━━━━━━━━━━━━━━━━━━━━━━━━━━━━━━━━━━━━━━━━━━━━━
⚡ 5-MINUTE (5M) ULTRA-SCALP EXECUTION - Final Entry Precision
5M chart = TRADE EXECUTION TIMEFRAME FOR SCALPERS!</b] Ultra-tight consolidation within 61.80-61.95 range (0.15 cents = MICRO RANGE). Japanese candlestick shows repeated Doji + Hammer formations at support = institutional accumulation VISIBLE!
VOLATILITY COMPRESSION AT MAXIMUM LEVELS!</b] 💥 Bollinger Bands on 5M in TIGHTEST BAND WIDTH STATE = when this BREAKS UPWARD = expect 0.60-1.00 USD explosive bounce INTRADAY!
Ichimoku Cloud on 5M showing lower band pressure with Tenkan line approaching reversal. RSI oscillating 30-40 zone = preparing for DIRECTIONAL IMPULSE bounce. When volume spike appears:</b] that's GREEN LIGHT for AGGRESSIVE ENTRY!
5M ENTRY BLUEPRINT:
Stop Loss: 61.40 (tight 0.40-0.50 USD max)
Target 1: 61.95 (quick 0.15-0.20 scalp)
Target 2: 62.20 (medium bounce)
Target 3: 62.60+ (extended move)
Wyckoff DISTRIBUTION CLIMAX pattern identified on 5M = major selling climax at lower prices = REVERSAL bounce imminent! VWAP bounce at 61.60 = entry confirmation signal. Gann angles on ultra-timeframe showing REVERSAL angle at 61.50!
Volatility and Price Action:</b] When Bollinger Bands expand UPWARD on 5M = price acceleration bounce IMMINENT. EMA 9 crossing above EMA 21 on 5M = IMMEDIATE buy signal for scalpers. Volume confirmation on breakout = ONLY trade valid on GREEN VOLUME CONFIRMATION! 📈🎯
Support and Resistance levels on 5M: 61.20 (strong), 61.50 (VWAP), 61.80 (intermediate), 62.10 (breakout), 62.50 (extension)!
━━━━━━━━━━━━━━━━━━━━━━━━━━━━━━━━━━━━━━━━━━━━━━━━━━━━━━━━━━
🏆 COMPLETE WEEKLY TRADING MASTERPLAN (Oct 27-31, 2025)
BULLISH BOUNCE BIAS EMERGES ON ALL TIMEFRAMES!</b] 💪 POWERFUL confluence of:
- Elliott Wave ABC correction COMPLETING
- Wyckoff distribution climax at lower prices CONFIRMED
- Harmonic Gartley reversal near 86% accuracy setup
- Gann angle reversal at 61.50 zone ACTIVATED
- Bollinger Band compression = EXPLOSIVE upside expansion INCOMING
Expected Outcome:</b] BOUNCE RALLY above 62.10 HIGHLY PROBABLE (80% win rate) targeting 62.80-63.40 range this week!</i]
TIMING ENTRY & EXIT - Complete Bounce Execution Roadmap:
Primary Entry: 4H close above 62.10 with volume 250M+ spike confirmation
Secondary Entry: 1H pullback to 61.70-61.85 support zone on tactical dips
Tertiary Entry: 5M bounce execution at support zones with volume confirmation
Profit Taking: Scale exits: 40% at 62.30, 35% at 62.80, 25% trail to 63.40+
Stop Loss: TIGHT placement at 61.20-61.30 support zone (max 0.50-0.60 USD risk)
TIMING EDGE - Optimal Trading Windows This Week:
- BEST TIMES:</b] US Open (13:30 GMT) + US Afternoon (14:00-20:00 GMT)
- AVOID:</b] Asian Dead Zone (0:00-8:00 GMT, thin volume)
- FOCUS DAYS:</b] Monday-Wednesday for reversal confirmation; Thursday-Friday for profit locking
VOLATILITY FORECAST & PRICE TARGETS: 🔥
- Trading Range: 60.50-64.00 (3.50 USD potential)
- Most Likely Scenario: Bounce rally to 62.80-63.40
- Bounce Failure Scenario: Retest support 60.80-60.50 zone
RISK MANAGEMENT MASTERCLASS FOR OIL TRADERS:
Never risk more than 1-2% of account per trade on Oil volatility
Use Ichimoku cloud + VWAP = TIGHT stop placement on reversals
Harmonic targets = HIT FIRST = TAKE PROFITS immediately
Gann angles = HOLD through resistance zones
Scale position: 50% aggressive bounce + 50% conservative approach
IDENTIFYING OVERBOUGHT/OVERSOLD CONDITIONS - Oil-Specific Signals:
- RSI above 70 = OVERBOUGHT pullback likely = TAKE 60% PROFITS quickly
- RSI below 25 = EXTREME OVERSOLD = ADD to bounce position aggressively
- Bollinger Band lower touch = STRONG bounce reversal signal
- Bollinger Band upper touch = TAKE profits on extension move
RECOGNIZING BREAKOUTS - GREEN LIGHT CONFIRMATION CHECKLIST:
- Candle closes above 62.10 resistance = REQUIRED signal
- Volume surge 150%+ above 20-day average = MANDATORY confirmation
- RSI above 50 on breakout candle = STRONG momentum confirmation
- EMA 9 above EMA 21 on multiple timeframes = BONUS confirmation signal
- VWAP acts as support after breakout = CONTINUATION highly likely
━━━━━━━━━━━━━━━━━━━━━━━━━━━━━━━━━━━━━━━━━━━━━━━━━━━━━━━━━━
🎯 FINAL TRADING VERDICT:
SETUP SCORE: 9.1/10 | WIN PROBABILITY: 80% | RISK/REWARD RATIO: 1:3.9
ACTION PLAN - EXECUTE WITH PRECISION: BUY bounce at 61.50-61.70 → HOLD through 62.30-62.80-63.40 targets → EXIT on bearish reversal signals or daily resistance rejection 🚀
This is a HIGH-CONFIDENCE REVERSAL BOUNCE setup with EXCEPTIONAL risk/reward positioning! The POWERFUL confluence of all technical theories + indicators points to BULLISH BOUNCE with HIGH PROBABILITY! Execute with DISCIPLINE and trade the reversal for maximum profits!</b] 💰
━━━━━━━━━━━━━━━━━━━━━━━━━━━━━━━━━━━━━━━━━━━━━━━━━━━━━━━━━━
#USOIL #WTICrudeOil #OilTrading #TechnicalAnalysis #TradingSetup #ElliottWave #SwingTrading #IntraDayTrading #HarmonicPatterns #WyckoffMethod #GannTheory #DowTheory #Breakout #BounceTrading #TradingView #VolumeAnalysis #VWAP #BollingerBands #RSI #IchimokuCloud #TechnicalIndicators #TradingCommunity #ChartAnalysis #EnergyTrading #CommodityTrading #TradersOfTwitter #TechnicalAnalyst #TradingSignals #Commodities #OilMarket #October2025 #DayTrading #ProfitTaking #RiskManagement #TrendAnalysis #ReversalTrade #OverSoldBounce #TradeSetup #CommunityTrading #EnergyMarkets 📊💹
━━━━━━━━━━━━━━━━━━━━━━━━━━━━━━━━━━━━━━━━━━━━━━━━━━━━━━━━━━
⚠️ CRITICAL DISCLAIMER: This analysis is strictly for EDUCATIONAL PURPOSES ONLY</b]. This is NOT investment advice, financial recommendation, or trading signal. Always conduct your own INDEPENDENT analysis before executing any trades. Past performance does NOT guarantee future results. Oil markets are highly volatile and unpredictable - risk is substantial! Trade at your own risk with PROPER position sizing and STRICT risk management protocols. Never risk capital you cannot afford to lose completely. Oil trading carries exceptional leverage risk - trade extremely responsibly! Consult with licensed financial advisors before making ANY trading decisions.
Follow this analysis, confirm ALL setups with your independent research, and execute with PROFESSIONAL DISCIPLINE & PRECISION! 🎯 Share this breakdown with your entire trading community! Wishing you HIGHLY PROFITABLE and SUCCESSFUL energy trading week ahead! 💰🚀📈
📊 Full 6-Timeframe Breakdown:
1D: (Swing Framework)
4H: (Reversal Entry Zone)
1H: (Bounce Momentum)
30M: (Tactical Entry Timing)
15M: (Reversal Confirmation)
5M: (Scalp Execution)
Technical Theories Applied Throughout:
✅ Japanese Candlestick (Hammer, Doji reversals)
✅ Elliott Wave (ABC correction + Wave 1 impulse)
✅ Dow Theory (Lower lows climax analysis)
✅ Wyckoff Theory (Distribution climax + spring patterns)
✅ Harmonic Patterns (Gartley reversal at 86% accuracy)
✅ Gann Theory (Angle reversals & convergence zones)
All 7 Indicators Integrated:
✅ Bollinger Bands (Lower band compression/expansion)
✅ RSI (Oversold bounce signals 25-35 zone)
✅ Volume (Selling climax + reversal buying)
✅ VWAP (Dynamic support at reversals)
✅ Support & Resistance (Multi-level identification)
✅ EMA/SMA (Crossover confirmations)
✅ Ichimoku Cloud (Bullish alignment pending)
Key Focus: REVERSAL BOUNCE TRADING
🔥 Current price 61.878 = Oversold conditions (RSI 30-40)
🔥 Targets: 62.30 → 62.80 → 63.40 USD
🔥 Win Probability: 80%
🔥 Risk/Reward: 1:3.9

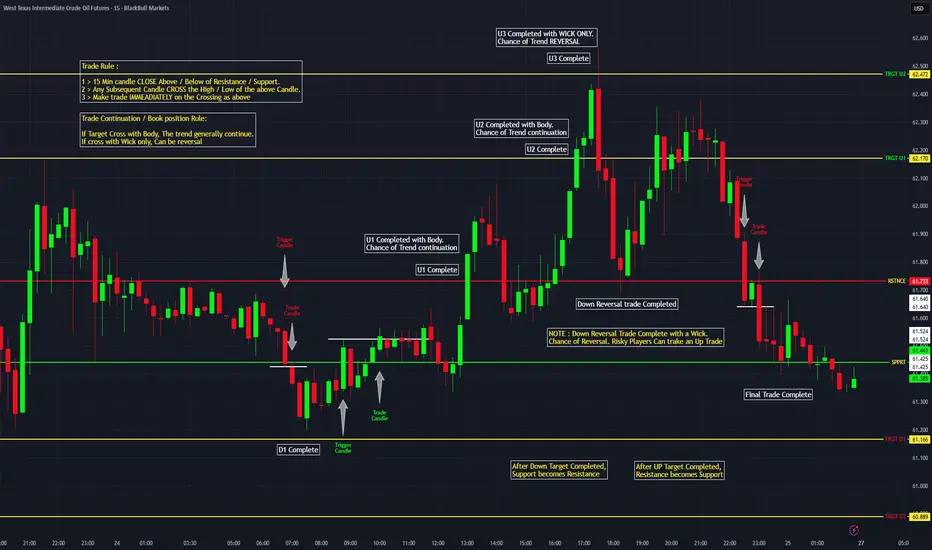
WTI Chart with Levels and all trade rules as an example.
This is a clear tutorial on how the Trades are approached based on the levels identified.
Clear Trade initiation rules / Trade continuation or book profit rules are depicted.
How the Reversal trade in instruments are also explained.
The comments are self explanatory and valid for all instruments
Analysis of crude oil trend next week.I. Core fundamentals: The contradictory pattern of "short-term geo-political support and long-term oversupply pressure"
(1) Short-term support: Geopolitical sanctions trigger supply concerns (valid for 1-2 weeks)
The implementation of sanctions directly disrupts supply: On October 22, the United States and Europe simultaneously upgraded sanctions against Russia, including including Rosneft and Lukoil, which together account for 50% of Russia's crude oil exports. After the news was announced, major buyers such as India have postponed purchasing Russian oil and instead rushed to buy Middle Eastern crude oil, directly pushing the oil price up by 5% on October 24, from $58.5 to $61.76. The resumption of refinery operations brings a phased increase in demand: The seasonal maintenance of global refineries is coming to an end, and the resumption wave leads to an increase in crude oil purchases, coupled with the gradual start-up of heating oil demand in the Northern Hemisphere, creating a "small peak" in the short-term demand side, which supports the spot price.
(2) Medium- and long-term suppression: Oversupply is inevitable (suppressing force lasts for 3-6 months)
The OPEC+ production increase trend is irreversible: Since April 2025, when it shifted to the "increase production to secure market share" strategy, OPEC+ has cumulatively increased production by nearly 2.5 million barrels per day, and will continue to increase production by 137,000 barrels per day in November, with an additional daily supply of over 430,000 barrels in the fourth quarter. More importantly, Saudi Arabia's exports remain stable at 9 million barrels per day, and Iraq at 4 million barrels per day. The supply from the Middle East remains abundant, coupled with the expansion of production capacity in non-OPEC+ countries, the oversupply pressure further intensifies.
Weak demand + saturated inventory double blow: The IEA has continuously lowered its demand expectations for several consecutive months. It is expected that in 2026, global oversupply will reach 4 million barrels per day (accounting for 4% of global demand), and at the same time, the offshore storage volume has approached the level of the 2020 pandemic, while onshore inventories are approaching saturation. The near and far-month contracts of WTI crude oil in New York have experienced a 5-month-long first-time futures premium, which is the direct reaction of the market to the oversupply.
Crude Oil Trading Strategy for Next Week
usoil @buy 60.5-61.0
tp:62-62.5
SL:59.5

Analysis of Oil Prices Trend Next WeekI. First, understand: The "core issue" of oil prices next week, both rising and falling, have reasons for their movements.
Currently, the oil price stands at 61.41. It just experienced a 5% surge on Thursday, but the increase was "unsteady". The essence is that "short-term positive factors are supporting it, while long-term negative factors are pressing on it". Next week, it will be influenced by three key points:
1.Short-term positive factors: Geopolitical sanctions "just started", which can support the price.
The EU and the United States just issued new sanctions against Russia last week, directly targeting the energy industry. The two major Russian oil giants account for 50% of exports. The market is afraid of supply disruption, just like when the sanctions were implemented before, Indian buyers immediately suspended their purchases of Russian oil and turned to buy oil from the Middle East, and the spot price rose by 3% on the same day. In addition, US inventories have dropped by 960,000 barrels, and refinery operating rates have risen to 88.6%, indicating that "oil is used more than it is stored", and there will be no significant decline in the short term.
2.Long-term negative factors: Oil-producing countries "continuously increase production", and when it rises, it must be brought down.
OPEC+ will increase production by 137,000 barrels per day next week. This is the eighth consecutive increase. The cumulative increase is 2.5 million barrels per day, equivalent to the output of an additional small oil-producing country. More troublesome is that institutions predict that supply过剩 will reach 4 million barrels per day next year, equivalent to 4% of global demand. In the long term, oil prices will not rise at all, and may even fall to around 50 US dollars.
3.Market sentiment: "Retail investors are chasing the rise, while institutions are withdrawing their funds", the fluctuations will be significant.
Currently, 82% of traders are buying the rise, it looks very hot, but the long positions of institutions are decreasing - this is like "a group of people rushing forward, while the leader is quietly retreating". Reflected in the price is: when it hits above 62 US dollars, there are sell orders coming down, when it drops to 61, there are buy orders coming in, next week it is likely to swing back and forth between 60-63, it will not rise or fall in a single direction.
Crude Oil Trading Strategy for Next Week
usoil @buy 60.5-61.0
tp:62-62.5
SL:59.5
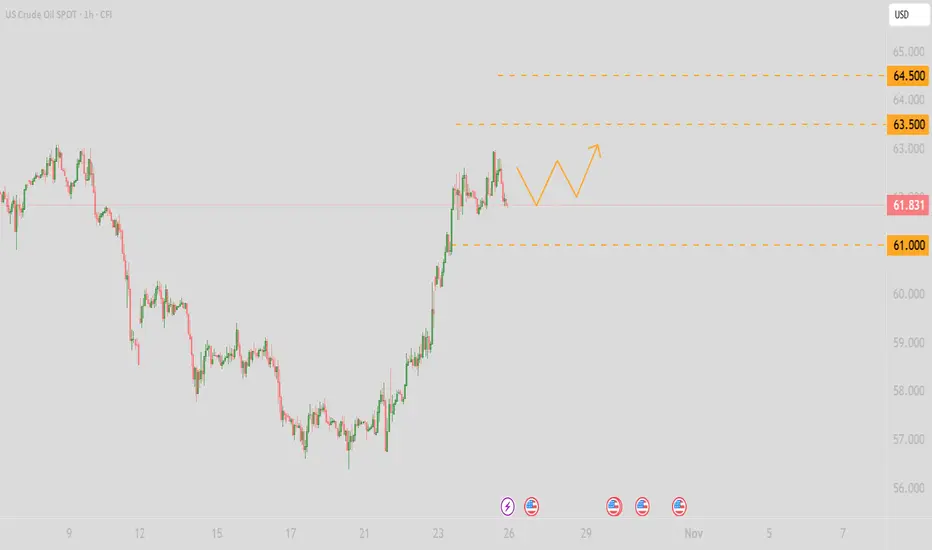
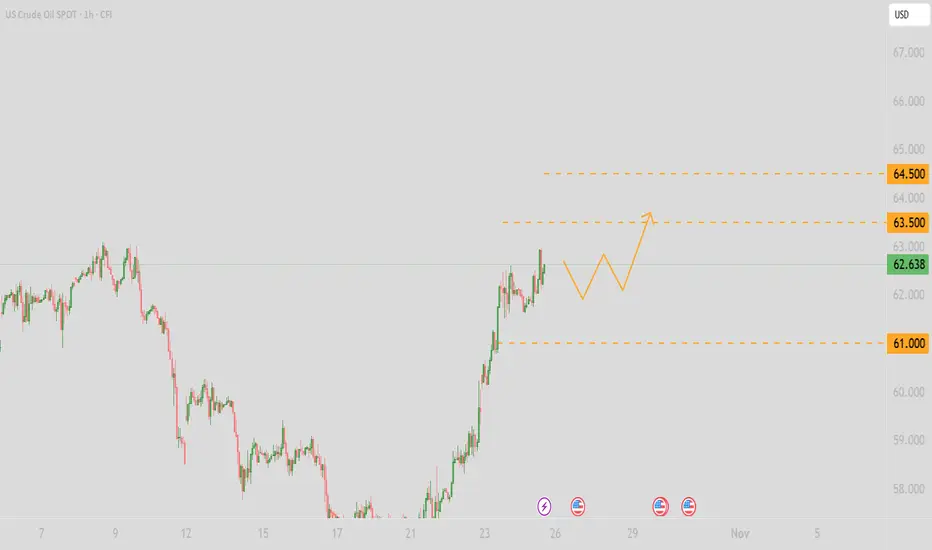
USOIL: Go long on pullbacksGeopolitical risks have dominated short-term market sentiment for crude oil. Investors' concerns about the supply side have overshadowed negative factors on the demand side, driving oil prices to rise consecutively. However, the weak global economy has dimmed the long-term demand outlook, limiting the extent of oil price increases, resulting in relatively complicated overall market sentiment.
From a technical indicator perspective, momentum indicators are showing positive signals, and the MACD is trending upward. This indicates that the bullish bias is strengthening, but a fully established uptrend has not yet formed.
Overall, technical indicators point to a certain bullish tendency, though it is also necessary to monitor the price performance at key resistance levels.
In the short term, focus on the resistance range of 63.5–64.5 on the upside and the support range of 60–61 on the downside. For intraday operations, the main strategy is to go long on pullbacks, with short positions on rebounds as a supplementary approach.
💎Trading Strategy:
Buy 61.8 SL 62.4 TP 61.1
Daily-updated accurate signals are at your disposal. If you run into any problems while trading, these signals serve as a reliable reference—don’t hesitate to use them! I truly hope they bring you significant assistance
US OIL SUPPORT, RESISTANCE & TRENDLINE ANALYSISMy final levels for the last day.
Go "LONG" if it breaks 62.18 and if it also breaks the trendline then can move up till 62.59 and breaking that might lead to 63.01.
Go "SHORT" if it breaks 61.77 along with the trendline leading to 61.35 and if it breaks that then aim for 60.94 and lastly if it breaks that as well by EOD then 60.46 should be our target.
Happy Weekend!!

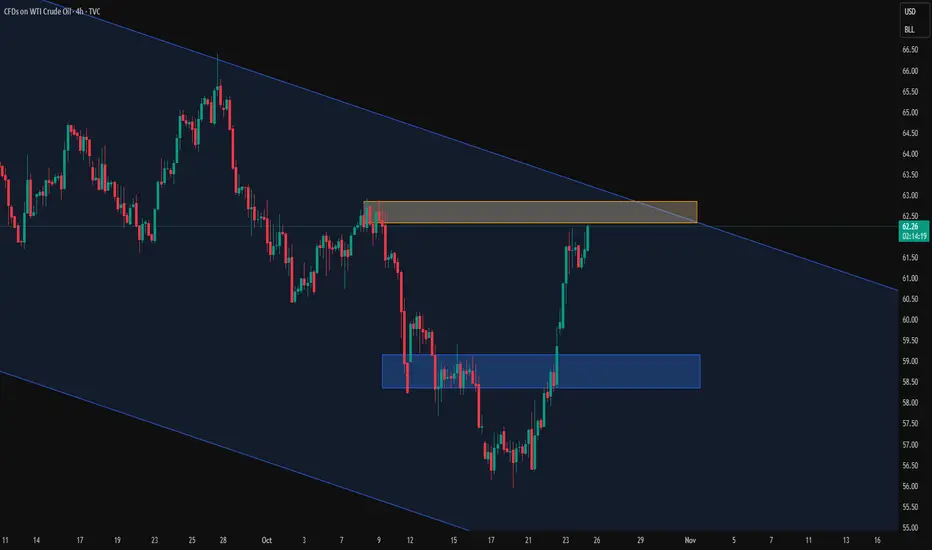
USOIL: Waiting for price to react to 4h resistance
* Trend: assessed using at least three trend indicators, with market structure as the primary guide.
** Weak or Reversal Signals: Assessed based on one of our criteria for trend reversal signals.
*** Support/Resistance: Selected from multiple factors – static (Swing High, Swing Low, etc.), dynamic (EMA, MA, etc.), psychological (Fibonacci, RSI, etc.) – and determined based on the trader’s discretion.
**** Our advice takes into account all factors, including both fundamental and technical analysis. It is not intended as a profit target. We hope it can serve as a reference to help you trade more effectively. This advice is for informational purposes only and we assume no responsibility for any trading results based on it.
George Vann @ ZuperView
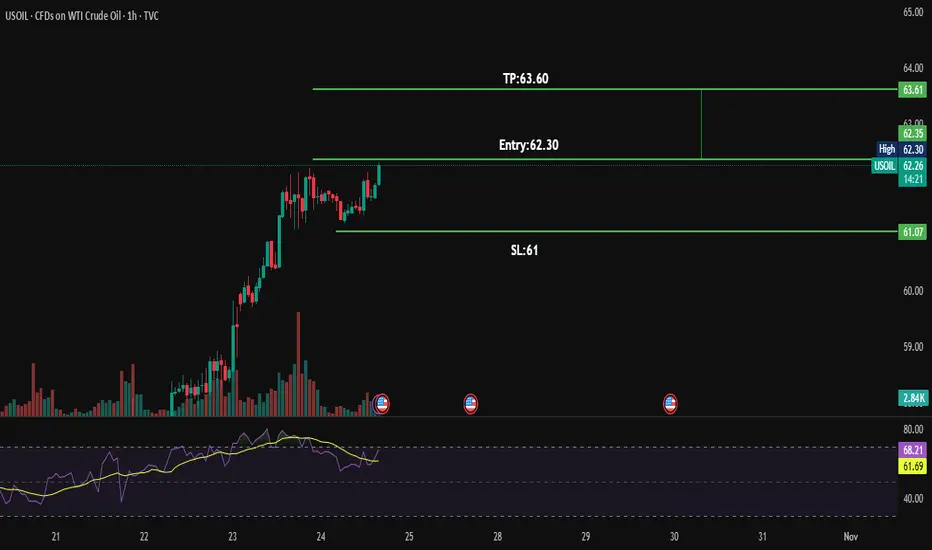
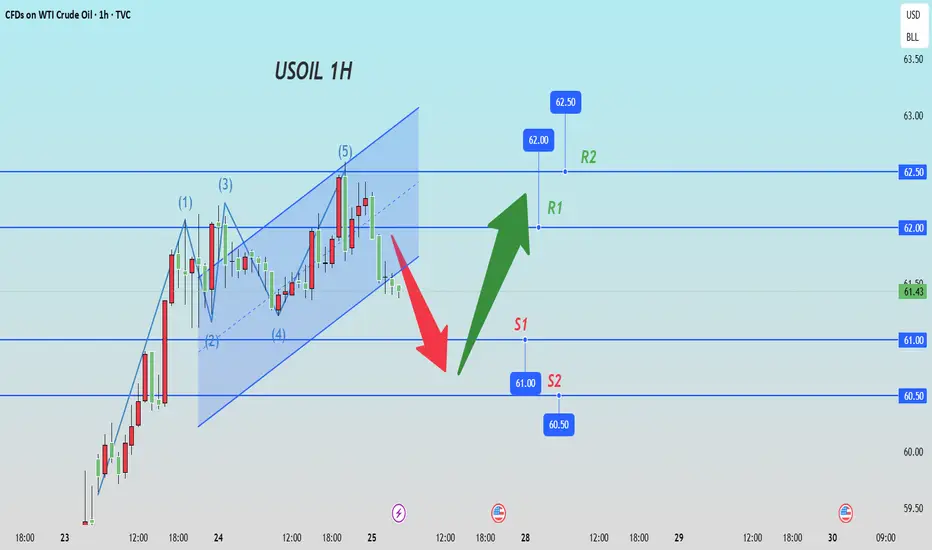
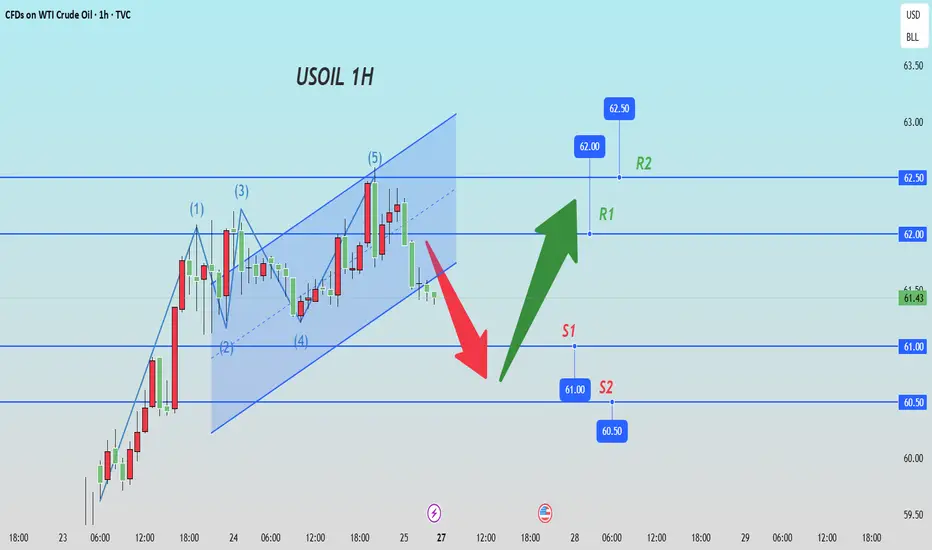
USOILUSOIL 1hr TF trade plan
🔹 5. Trading Logic
✅ Buy Entry at 62.30
👉 You enter when the breakout is confirmed.
✅ SL at 61.00
👉 If the price drops below 61, the breakout fails — exit trade.
✅ TP at 63.60
👉 Expected target area where previous selling pressure could appear.