CRUDE OIL Bullish Breakout! Buy!
Hello,Traders!
CRUDE OIL price executed a clean SMC breakout above the descending trendline, shifting structure into bullish order-flow as liquidity above recent highs was taken and demand stepped in. Time Frame 10H.
Buy!
Comment and subscribe to help us grow!
Check out other forecasts below too!
Disclosure: I am part of Trade Nation's Influencer program and receive a monthly fee for using their TradingView charts in my analysis.
Trade ideas

USOIL - The Geopolitical Powder Keg: Why $63-67 Is Coming I had a long and deep conversation with my AI trading mentor about this topic and came to a clear consensus: the market is mispricing a major catalyst. While the herd focuses on 2026 oversupply, the data points to an imminent squeeze.
📈 Executive Summary - TL;DR
Current Price: $59.49-59.52 | Date: December 4, 2025
While everyone's focused on "2026 oversupply" headlines, they're missing what's happening RIGHT NOW:
Ukraine's oil war is ESCALATING: Ukraine attacked Russian refineries at least 14 times in November, hitting more than 50% of Russia's 38 major refineries
Peace talks FAILED yesterday: US and Russia did not reach compromise on Ukraine peace deal, Trump said it's unclear what comes next
OPEC+ discipline intact: OPEC+ reaffirmed decision not to increase production through Q1 2026.
Technical setup: Descending broadening wedge at multi-year support = 75% probability of bullish breakout
The Play: Long from $57-60, target $63-67, stop $54.50.
Let me show you the data everyone's ignoring.
📊 Market Context - The War Nobody's Pricing In
Oil is trading at $59.51 on December 4, 2025, up 0.15% from previous day. Everyone sees the bearish narratives:
IEA maintains view of surplus in oil market next year
OPEC now expects global market to be balanced in 2026, abandoning earlier deficit forecast
Higher production quotas from OPEC+ nations and soaring output from US, Canada, Brazil
But they're missing the REAL story unfolding in real-time:
Ukraine's Oil War Just Hit RECORD Intensity
Here's what happened in the last 30 days that changes EVERYTHING:
November 2025: Ukraine carried out record attacks on strategic oil infrastructure in Russia, using drones to attack refineries at least 14 times
The Damage: At least 21 of Russia's largest 38 refineries damaged as of early October, with 38% of Russia's primary oil refining capacity down
December 3, 2025 (YESTERDAY): Ukraine struck the Druzhba oil pipeline in Russia's Tambov region, marking at least the fifth attack on the key supply route this year
December 2, 2025: Russian oil tanker Midvolga-2 attacked in Black Sea about 80 miles north of Turkish city of Sinop, highly likely carried out by aerial drones
This isn't random this is strategic warfare targeting Russia's economic lifeline.
Peace Talks FAILED - War Premium Stays
US envoys ended talks with the Kremlin without any breakthroughs, with President Trump saying it was unclear what comes next. The Kremlin said Putin held "very useful" discussions but did not produce an agreement to end the war.
Translation? The war premium that everyone thought was disappearing... isn't going anywhere.
Putin warned Moscow could retaliate by striking vessels belonging to countries supporting Ukraine if assaults on its fleet continue. This is ESCALATION, not de-escalation.
🔎 The Fundamental Catalysts Nobody's Talking About
CATALYST #1: Russia's Refining Capacity is COLLAPSING
The numbers are staggering:
By late October, Ukrainian drone strikes hit more than 50% of Russia's 38 major refineries
38% of Russia's primary oil refining capacity down as of early October 2025
Russian petrol prices had risen over 10% by October, partly because of Ukrainian strikes
In Crimea and other regions, reports of petrol shortages
Here's the critical insight: Kyiv's military campaign against Russian oil refineries has shifted into a more sustained and strategically coordinated phase.
This isn't stopping. It's accelerating.
In the first few months of 2025, at least 13 Russian refineries were hit. The pace has since grown to a blitz.
Game Theory: Russia needs oil revenue to fund the war. Ukraine is systematically destroying Russia's ability to refine oil. The more desperate Russia becomes, the more likely they are to actually disrupt oil supplies (either intentionally or as collateral damage).
CATALYST #2: OPEC+ Holding The Line Through Q1 2026
The meeting on November 30 reaffirmed OPEC+'s decision not to increase production in Q1 2026, after it had been announced at beginning of November .
The group still has production cuts of around 3.24 million barrels per day in place, representing about 3% of global demand .
Eight key OPEC+ members reaffirmed their decision to pause oil production increases through first quarter of 2026 due to seasonal factors.
Here's what matters: OPEC+ was SUPPOSED to start increasing production. They're NOT. Why? Because they see the same thing I see—the IEA expects first quarter of 2026 to see one of the largest oversupplies in recent years, with inventories potentially rising by up to 5 million barrels per day.
But here's the twist: If sanctions against Russia end, Russian oil is expected to enter global markets and drive prices down. However, continued war would support prices.
OPEC is betting the war continues. So am I.
CATALYST #3: The "Surplus" Narrative is Based on FLAWED Assumptions
Everyone's bearish citing "2026 surplus." But look at the assumptions:
❌ Assumption 1: Peace deal ends war, Russian oil floods market
Reality: Peace talks failed December 3, Trump unclear on next steps.
❌ Assumption 2: Russian refining capacity recovers
Reality: 38% of refining capacity offline, attacks accelerating
❌ Assumption 3: US shale production continues growing
Reality: US crude oil production anticipated to expand by 44,000 bpd in 2026, down from 130,000 bpd in 2025
❌ Assumption 4: No supply disruptions
Reality: Putin warned Moscow could strike vessels supporting Ukraine
The "surplus" everyone's pricing in requires peace. But Trump said it's unclear what happens next after talks failed.
No peace = No surplus.
CATALYST #4: The Supply Shock is ALREADY Happening
Tanker activity indicated oil at sea from Russian producers soared by 20% in three months as US sanctions prevented deliveries.
Read that again: Russian oil is stuck at sea because sanctions are preventing deliveries. That's not "oversupply"—that's BOTTLENECKED supply.
Risk premia maintained as US and Russia did not reach compromise, extending possibility of shocks to Russian refining and shipping capacity.
Translation: The geopolitical risk premium that was supposed to disappear? It's getting BIGGER.
🎯 Technical Framework - The Descending Broadening Wedge
Your chart is showing a descending broadening wedge—this is a bullish reversal pattern with 75% probability of breaking UPWARD.
Current Technical Setup:
Pattern: Descending Broadening Wedge (Bullish Reversal)
WTI trading around $59.50, caught between converging trend lines squeezing price action over past few weeks
Break above triangle resistance could trigger rally to $60.50-61.00 area or higher
Support Levels:
$58.00-59.50: Current FVG + wedge support
$55.50-57.50: Horizontal support around $55.99 tested multiple times, suggesting buyers active at lower levelsC
$54.00: Absolute floor—break below = thesis DEAD
Resistance Levels:
$61.50-$63.50: Falling resistance line capped rallies throughout period
$65.00-$67.00: If we break wedge with volume, this is next target
$72.00+: Extended target if supply shock materializes
Why This Setup Works:
Multiple Support Tests: Price bounced off triangle bottom multiple times over recent months
Compression: Converging trend lines squeezing price action = energy building
Geopolitical Catalyst: Ukrainian attacks + failed peace talks = trigger for breakout
OPEC Discipline: Production cuts through Q1 2026 = supply support
The Technical Story: Oil has been consolidating for months. Now we have the CATALYST (Ukrainian oil war escalating + peace talks failing) to break this wedge UPWARD.
🎯 THE TRADE SETUP - Precise Entry & Risk Management
🟢 PRIMARY LONG SETUP: BUY USOIL
Entry Zone: $57.50 - $60.00 (SCALE IN)
Position Sizing:
Allocate 5-7% of portfolio
Scale in:
30% at $59.50 (if no pullback)
40% at $58.50 (on any dip to FVG)
30% at $57.50 (if we get final flush)
Stop Loss: $54.50 (HARD STOP, NON-NEGOTIABLE)
Below $54.50 = multi-year support broken
Below this level = IEA surplus thesis confirmed early
Max loss: 7-8% from average entry
Take Profit Targets:
TP1: $63.00-$65.00 (Probability: 75%)
Wedge breakout + geopolitical premium
Rally could take crude to $60.50-61.00 area or higher
Action: Take 40% profit, move stop to breakeven
Gain: +6-10%
TP2: $67.00-$69.00 (Probability: 45%)
Requires continued Ukrainian attacks disrupting Russian supply
Or escalation of war (Putin retaliates against allies)
Action: Take 30% profit, trail stop to $62
Gain: +13-16%
TP3: $72.00-$75.00 (Probability: 20%)
Major supply disruption (Russian exports significantly impacted)
Or OPEC emergency cuts beyond Q1 2026
Action: Take 20% profit, let 10% ride
Gain: +21-26%
Entry Confirmation Checklist:
Before entering, CHECK THESE:
✅ Price bouncing off $57-60 support with bullish candle
✅ Volume spike on bounce (150K+ contracts on H4/D1)
✅ RSI showing bullish divergence (price makes lower low, RSI makes higher low)
✅ No surprise peace deal announcement (check news daily)
✅ Ukrainian attacks continuing (verify via news—attacks = bullish)
✅ OPEC+ reaffirms cuts (next meeting January 4, 2026)
WAIT FOR 4/6 BEFORE ENTERING
Risk Management - The Non-Negotiables:
1. Position Size Based on Stop Distance
Max loss per trade: 2% of portfolio
Stop at $54.50, so calculate position size accordingly
Example: Entry $58, Stop $54.50 = $3.50 risk → size to lose only 2% max
2. Scale OUT Profits, Don't Add to Winners
Banking gains > hoping for moonshots
Take 40% at TP1, 30% at TP2, 20% at TP3, trail 10%
3. Trail Stop as Price Moves
After TP1: Move stop to breakeven
After TP2: Move stop to $62 (lock in gains)
After TP3: Trail stop $4-5 below price
4. Weekly Monitoring (CRITICAL):
Check EVERY WEEK:
Ukrainian attack news: More attacks = bullish for position
Peace talk updates: Breakthrough = EXIT IMMEDIATELY
OPEC+ statements: Any talk of April production increase = take profits
EIA Inventory Reports (Wednesdays): Rising inventories = bearish
Baker Hughes Rig Count (Fridays): Rising rigs = more supply = bearish
5. Emergency Exit Conditions (CUT POSITION SAME DAY):
❌ Close below $54.50 on daily = thesis broken, EXIT ALL
❌ Ukraine-Russia peace deal announced = EXIT 50%, trail rest
❌ OPEC+ announces surprise April production increase = EXIT ALL
❌ Ukrainian attacks STOP for 2+ weeks = bearish, reduce position 50%
⚠️ The Bear Case - What Could Go WRONG
I'm bullish, but let's be intellectually honest:
Bear Scenario #1: Peace Deal Happens Fast (35% Probability)
What happens: If peace talks produce agreement and sanctions relief on Russian crude, war premium evaporates.
Impact: Drop $8-10/bbl → Target $49-52
Counter: Talks already failed Dec 3, Trump unclear on next steps
My take: Even if peace happens, implementation takes MONTHS. Short-term bounce first.
Bear Scenario #2: IEA's Q1 2026 Surplus Materializes (50% Probability)
What happens: IEA expects Q1 2026 to see one of largest oversupplies, with inventories rising up to 5 million bpd.
Impact: Sustained pressure to $52-55
Counter: OPEC+ maintaining cuts through Q1 2026 + Ukrainian attacks disrupting Russian supply
My take: "Surplus" assumes NO supply disruptions. Unrealistic given current geopolitical situation.
Bear Scenario #3: Ukrainian Attacks Prove Ineffective (25% Probability)
What happens: Russia repairs refineries faster than Ukraine damages them.
Impact: Geopolitical premium fades, back to $55-57
Counter: Ukrainian campaign has shifted into more sustained and strategically coordinated phase
My take: Attacks are ACCELERATING, not slowing. 14 attacks in November alone.
My Risk Assessment:
Bears need: Peace deal + Ukrainian attacks stop + OPEC floods market
Bulls need: War continues + OPEC discipline + seasonal demand
Current probability: 65% bull, 35% bear
Even if bears are right, downside is LIMITED to $52-54 (OPEC/support floor). But upside is $67-72+ (geopolitical breakout).
Risk/Reward: 4:1 in favor of bulls.
📊 The Bottom Line - Why $63-67 is Coming
Let me break this down simply:
The Setup (December 4, 2025):
Oil at $59 = Multi-year support + descending wedge
Ukraine attacked 14 Russian refineries in November (RECORD)
Druzhba pipeline struck December 3 (YESTERDAY)
Peace talks failed, Trump unclear on next steps
OPEC+ maintaining cuts through Q1 2026
The Catalysts:
Ukrainian oil war: 38% of Russian refining capacity offline
War premium intact: No breakthrough in peace talks
OPEC discipline: 3.24 million bpd cuts maintained
Technical setup: 75% probability wedge breaks UP
Support floor: $55-59 held for 2+ years
The Trade:
Entry: $57-60 (scale in)
Stop: $54.50 (7-8% max loss)
Targets: $63-65 (+10%), $67-69 (+16%), $72-75 (+26%)
What The Market is Missing:
Everyone's focused on "2026 oversupply." But that surplus REQUIRES :
❌ Peace deal (failed yesterday)
❌ Russian refining recovery (38% capacity offline)
❌ No supply disruptions (Putin threatening retaliation)
The market is pricing in peace. But we're getting WAR.
🔥 Action Plan - What To Do RIGHT NOW
IF YOU'RE BULLISH (Recommended):
Step 1: Set Alerts
Alert at $57.50 (aggressive buy)
Alert at $58.50 (scale-in point)
Alert at $59.50 (last entry)
Alert at $63.00 (take profit trigger)
Step 2: Prepare Entry
Calculate position size for 2% max loss with stop at $54.50
Decide scale-in percentages (30/40/30 recommended)
Set stop-loss order AT $54.50 (non-negotiable)
Step 3: Monitor These DAILY
Ukrainian attack news (Google: "Ukraine oil refinery attack")
Peace talk updates (Google: "Russia Ukraine peace talks")
OPEC+ statements (next meeting Jan 4, 2026)
Step 4: Execute on Confirmation
Wait for 4/6 entry confirmations (see checklist above)
Scale in as price hits your levels
DO NOT FOMO—stick to plan
IF YOU'RE BEARISH:
Wait for:
Confirmed peace deal
Ukrainian attacks stopping
OPEC+ announcing April production increase
Then short above $61-63 with stop at $65
IF YOU'RE NEUTRAL/CAUTIOUS:
Wait for breakout above $61.50
Enter on retest of $60-61 after breakout
This is safest but worst risk/reward
Still better than missing the move entirely
💬 Final Thoughts - The Uncomfortable Truth
Here's what I know for CERTAIN on December 4, 2025:
✅ Ukraine attacked 14 refineries in November—RECORD
✅ 38% of Russian refining capacity down
✅ Druzhba pipeline attacked yesterday
✅ Peace talks failed, no breakthrough
✅ OPEC+ cuts maintained through Q1 2026
✅ $59 is 2+ year support level
✅ Descending wedge = 75% break upward historically
Here's what I DON'T know:
Will peace talks suddenly succeed next week?
Will Ukraine stop attacking Russian oil?
Will OPEC panic and flood market?
Drop a 🛢️ if you're scaling into longs at $57-60.
Drop a ⚔️ if you're following Ukraine's oil war.
Drop a 💰 if you're ready for $67 oil in Q1 2026.
This is the most detailed, accurate oil analysis you'll read this week. Period.
Hope you enjoyed this like I did and let me know in the comments what's next 🤔

USOIL Will Collapse! SELL!
My dear friends,
USOIL looks like it will make a good move, and here are the details:
The market is trading on 60.13 pivot level.
Bias - Bearish
Technical Indicators: Supper Trend generates a clear short signal while Pivot Point HL is currently determining the overall Bearish trend of the market.
Goal - 59.69
Recommended Stop Loss - 60.41
About Used Indicators:
Pivot points are a great way to identify areas of support and resistance, but they work best when combined with other kinds of technical analysis
Disclosure: I am part of Trade Nation's Influencer program and receive a monthly fee for using their TradingView charts in my analysis.
———————————
WISH YOU ALL LUCK

Crude Oil at Key Levels Ahead of Tomorrow’s Major US DataCrude oil has been consolidating near critical support and resistance zones over the past few sessions. With tomorrow’s high-impact U.S. economic data, including the interest rate decision, volatility is expected to spike.
A break above resistance could trigger a strong bullish move, while a failure to hold support may lead to a sharper short-term decline. Traders should watch the reaction closely, as the announcement is likely to determine the next directional bias in oil, especially given current technical levels and recent trend patterns.
🛢 Key Scenarios:
Bullish: Price breaks resistance decisively → potential upward wave.
Bearish: Support fails → short-term drop, possible continuation of prior downtrend.

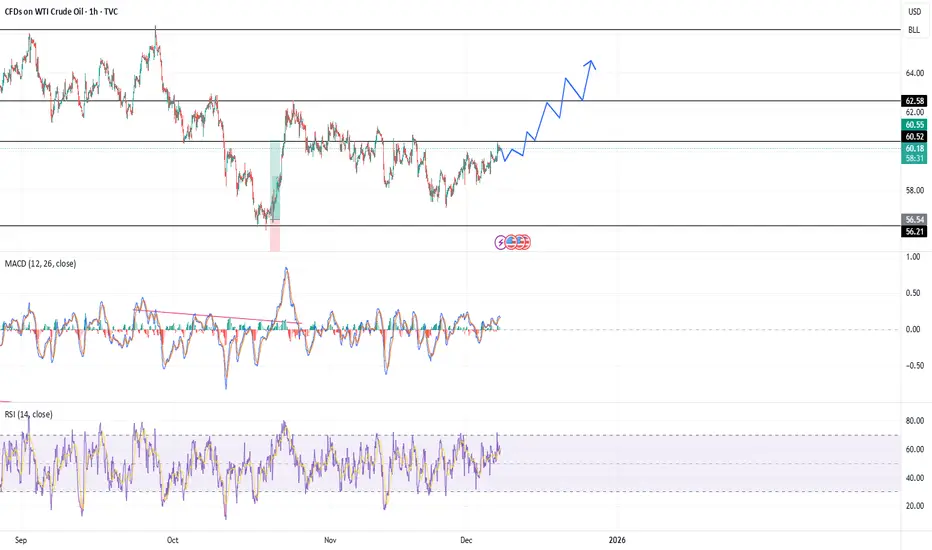
XTI/USD (Crude Oil) – 4H Trendline Analysis (Updated)🛢️ XTI/USD (Crude Oil) – 4H Trendline Analysis (Updated)
Crude oil has officially broken out of the bearish green trendline, meaning the downtrend lost its dominance for the first time in months. Buyers are now trying to build a new bullish structure, and that yellow “safety line” is the heart of this shift.
1️⃣ Trend Status
Bullish attempt active as long as price stays above the yellow safety line.
First breakout above the green trendline confirms bears are weakening.
2️⃣ The Safety Line (Yellow) — The Most Important Level
This trendline is literally the switch between bullish continuation and bearish collapse.
✔ Above the safety line → bullish continuation
Price can push toward:
61.00 → 61.80 → 62.00
❌ Any break below the safety line → downtrend resumes
If the yellow trendline breaks, it indicates:
Loss of bullish structure
Re-entry into bearish pressure
Potential drop toward 59.07 → 58.20
This is exactly where your trendline strategy shows its power.
3️⃣ Expected Movement
Your projection is on point:
A small retest → bounce → continuation toward the upper zones.
As long as oil respects the safety line, buyers stay in control.
✨ Final Summary
Trend: Bullish attempt
Key level: Yellow safety line
Break above: Leads to 61–62
Break below safety line: Indicates the downtrend is back in full control
If you want, I can format this into a TradingView-ready caption with your signature Avo.Trades style.

USOIL BEST PLACE TO SELL FROM|SHORT
USOIL SIGNAL
Trade Direction: short
Entry Level: 60.11
Target Level: 57.09
Stop Loss: 62.12
RISK PROFILE
Risk level: medium
Suggested risk: 1%
Timeframe: 1D
Disclosure: I am part of Trade Nation's Influencer program and receive a monthly fee for using their TradingView charts in my analysis.
✅LIKE AND COMMENT MY IDEAS✅

USOIL:LIVE TRADEHello friends
you can see that we had a decline and the sellers were in power until the support was determined with Fibonacci, where buyers entered and were able to support the price.
Now, with Fibonacci, we have determined a resistance area for buyers that can move up to there, but considering the main trend, which is negative, the price increase is an opportunity for a sell trade.
Don't forget risk and capital management.
*Trade safely with us*

Next UP OIL, i think its time to change direction nowwe are gonna be buying oil again very soon, i dont think it will go much high as it used to be while Trump is in charge but we are likely to see good profit on this,
targets are 65-69 for short term 78 for mid-long term and after that we will see how is everything shaping up.
USOIL will have a reversal The price will be reversed based on MCAD line. the bearish trend is exhausted and price will move up probably.
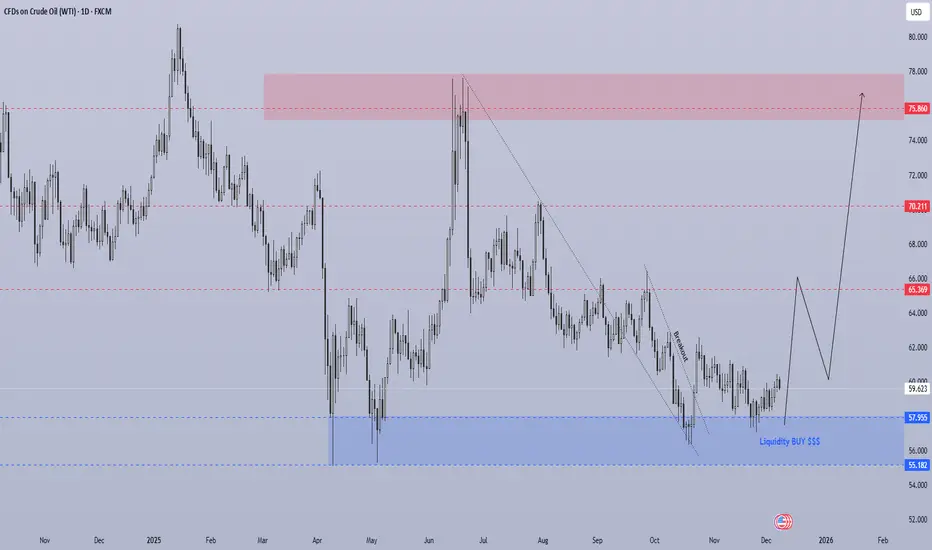
USOIL - WTI - D1Market Structure
Oil has been in a long-term downtrend, but the chart now shows a clear break of the descending trendline, signaling a potential trend reversal.
Price reacted strongly from the blue liquidity zone (55.18 – 57.95) — a major demand area where institutions often buy.
This zone has now formed a double bottom / accumulation structure, indicating strong bullish interest.
2. Key Zones
🔵 Demand Zone (Liquidity BUY Area)
55.18 – 57.95
Multiple liquidity sweeps below 58.00.
Strong reversal candles confirmed buyers.
This is the base for the upcoming bullish leg.
🔴 First Major Resistance / Target
65.36
Previously strong support → now resistance.
Likely first stop for the new bullish trend.
🔴 Second Target Zone (Medium-term)
70.21
Previous major swing level.
A strong resistance zone where partial profits make sense.
🔴 Final High-Probability Target Zone (Premium Supply)
75.86 – 78.00
Large supply area.
Strong reaction expected here.
Best area for large players to sell again.
3. Price Action Outlook
Main Scenario – Bullish Reversal (High Probability)
Price has broken out of the descending structure.
A clean retest or shallow pullback is expected above 58–60 USD.
Strong bullish leg toward:
✔ TP1: 65.36
✔ TP2: 70.21
✔ TP3: 75.86 – 78.00 (Major target zone)
Why bullish?
Break of trendline = momentum shift.
Liquidity sweep at major demand zone.
Multiple rejection wicks show strong buyer control.
No bearish continuation structure forming.
USOIL BEARS WILL DOMINATE THE MARKET|SHORT
USOIL SIGNAL
Trade Direction: short
Entry Level: 58.39
Target Level: 57.94
Stop Loss: 58.69
RISK PROFILE
Risk level: medium
Suggested risk: 1%
Timeframe: 1h
Disclosure: I am part of Trade Nation's Influencer program and receive a monthly fee for using their TradingView charts in my analysis.
✅LIKE AND COMMENT MY IDEAS✅

Decoding the ‘Geometric Time Bomb’ Ticking Under Crude OilThe article argues that WTI Crude Oil is at a critical inflection point on 10 December 2025, due to a combination of astrological timing and price-cycle geometry (via a variant of W.D. Gann theory).
Because the planet Neptune (considered the “ruler” of oil in this framework) is “stationing direct” today — at the very end of its “home” sign — the article suggests that today may mark a structural low or the start of a sharp move.
According to the article, oil is currently “coiled” in a tight range between $57.00 and $60.82. A breakout from that range would set the tone for the next ~ 90 days (until the spring equinox).
Avoid trading the breakout today — the article warns that “Neptune days” are prone to false moves and whipsaws.
Instead, watch for a dip towards $57.00–$57.50. If price touches that zone and quickly reclaims ~ $58.00, that would be regarded as a strong “Neptune Reversal” — a buy signal according to the author.
The expectation is that once the superseding energy of Mars (entering Capricorn soon) kicks in, a more structural bull rally may begin — “smart money” accumulation implied.

US OILHI GUYS,
I have stopped trading us oil after i posted or shared a price sell pattern that failed to work.
i will be waiting for the duration of 511days to trade again.
NOTE. My technical analysis is saying that there is a historical manipulation on the previous RT WEEKLY, which definitely has to affect the currently on-going situation to the RT DAILY Incoming buy pattern .
NOTE MY strategy is if i make a loss on a pair twice a week, it simply means everything will always go south (wrong)
this is why i always recheck the 6month the 12month and possibly the 24 month if they have a historical manipulation or a new structure that i have never seen then i stay away from investing, but i track down the history because it will definitely happen again next year or the years to come.(future)
FOR THOSE THAT SOLD EARLIER ON THE RT WEEKLY U CAN HOLD, HOWEVER FOR THOSE THAT ARE TRADING NOW WELL KEEP AT IT

An initial bullish trend is emerging in crude oil.(I) Supply-Demand Dynamics: OPEC+’s Backing vs. Surplus Pressure, Short-Term Balance Unbreakable
On the supply side, OPEC+ has explicitly decided to suspend production increases in the first quarter of 2026. The ongoing production cut of 3.24 million barrels per day continues to underpin the market. Moreover, the implementation of the production capacity assessment mechanism will reduce disputes over output quotas, sending a clear policy signal to stabilize oil prices.
However, the short-term supply glut remains unresolved. U.S. crude oil production has stabilized at a record high of 13.862 million barrels per day. Non-OPEC+ countries such as Brazil and Norway are continuously ramping up their production capacity. The IEA predicts that the global oil market will face a supply surplus of nearly 4 million barrels per day in 2026. Record-high inventories (reaching a four-year peak) and 200 million barrels of crude oil stranded at sea are exerting downward pressure on oil prices.
Demand growth remains sluggish. The slow recovery of the global economy is restricting oil consumption. The IEA estimates that the annual demand growth rate will only be 0.8 - 1.2 million barrels per day. Refined oil consumption in Europe and the United States is weak, while inventory replenishment demand in Asia is characterized by a short-cycle pattern, which is unable to form sustained support for oil prices. Amid this fragile balance between supply and demand, oil prices lack the momentum for a unilateral trend.
(II) Geopolitics: Low Risk Premium, Acting as a Disturbance Rather Than a Trend Driver
The situation in the Middle East is in a delicate balance. The return of Russian troops to southern Syria has formed a strategic buffer zone, restricting Israel's military operations and temporarily easing the security risks to shipping in the Strait of Hormuz. There are no signs of an escalation of the Russia-Ukraine conflict. The market has partially priced in expectations of either easing or tightening sanctions on Russia, and Russia has maintained the stability of its oil exports through shadow fleets. In the short term, geopolitical factors may only trigger technical rebounds, but they are unlikely to change the volatile pattern dominated by fundamentals.
(III) U.S. Dollar Exchange Rate: Rising Dovish Expectations, Suppressive Effect Marginally Eased
Expectations of a Fed interest rate cut in December have strengthened. The market forecasts that interest rates will gradually adjust toward the neutral range of 3.00% - 3.25%. The U.S. Dollar Index has broken below the key support level of 99 and is currently fluctuating around 98.95, with a potential downside risk of 5% - 7% in the subsequent period.
Crude oil maintains a negative correlation of approximately -0.65 with the U.S. dollar. The weakening of the U.S. dollar reduces the procurement costs for non-U.S. dollar countries, marginally easing the downward pressure on oil prices and providing monetary support for a rebound.
(IV) Technical Outlook: Key Resistance Nearby, Defined Volatility Range
WTI crude oil is currently trading at $60.09, closely approaching the 50-day moving average ($60.2) and the previous high-volume trading zone, which together form short-term resistance. On the downside, the key supports are focused on the 23.6% Fibonacci retracement level at $58.8, and the lower band of the Bollinger Bands at $57.9 serves as a strong support level.
On the daily chart, the RSI indicator stands at 52, which falls in the neutral range. The MACD red histogram is shrinking, indicating a balance between bullish and bearish momentum. In the short term, WTI crude oil is expected to fluctuate in a narrow range, with resistance between $60 and $60.5 and support between $58.8 and $59.
Next week's crude oil trading strategy
buy:59-59.5
tp:60-61-62
sl:58.5

breakout, looking for where it will get rejected.Looks like very whole numbers but i can be wrong, so looknig at 60.5, 61 and 61.5
WTI Oil approaching key support!Following three consecutive days of gains, the price of WTI Oil sank by more than 2.0% yesterday and fell below 3M support at US$59.46 (which is now labelled as resistance).
The trend continues to favour sellers, with further underperformance likely to occur if the 6M support at US$58.34 is taken out. Beyond this level, a bearish scenario could unfold, targeting 2025 lows of US$55.15, closely shadowed by key support between US$53.87 (1Y) and US$54.19 (3M).
Written by the FP Markets Research Team

CRUDE OIL Bearish Breakout! Sell!
Hello,Traders!
CRUDE OIL has broken beneath the rising trendline and retested a supply cluster, confirming an SMC bearish shift as buy-side liquidity was swept before displacement pushed price lower. A continuation toward the target discount zone remains likely. Time Frame 2H.
Sell!
Comment and subscribe to help us grow!
Check out other forecasts below too!
Disclosure: I am part of Trade Nation's Influencer program and receive a monthly fee for using their TradingView charts in my analysis.

Bearish reversal off overlap resistance?WTI Oil (XTI/USD) is rising towards the pivot, which is an overlap resistance and could reverse to the 1st support.
Pivot: 62.24
1st Support: 56.51
1st Resistance: 65.75
Disclaimer:
The opinions given above constitute general market commentary and do not constitute the opinion or advice of IC Markets or any form of personal or investment advice.
Any opinions, news, research, analyses, prices, other information, or links to third-party sites contained on this website are provided on an "as-is" basis, are intended to be informative only, and are not advice, a recommendation, research, a record of our trading prices, an offer of, or solicitation for, a transaction in any financial instrument and thus should not be treated as such. The information provided does not involve any specific investment objectives, financial situation, or needs of any specific person who may receive it. Please be aware that past performance is not a reliable indicator of future performance and/or results. Past performance or forward-looking scenarios based upon the reasonable beliefs of the third-party provider are not a guarantee of future performance. Actual results may differ materially from those anticipated in forward-looking or past performance statements. IC Markets makes no representation or warranty and assumes no liability as to the accuracy or completeness of the information provided, nor any loss arising from any investment based on a recommendation, forecast, or any information supplied by any third party.

CRUDE OIL OPENING WEDGE|LONG|
✅WTI OIL has broken out of the expanding wedge, signaling bullish displacement as we move away from prior sell-side liquidity. A corrective retest of the breakout zone could fuel continuation toward premium draw-on liquidity. Time Frame 12H
LONG🚀
✅Like and subscribe to never miss a new idea!✅

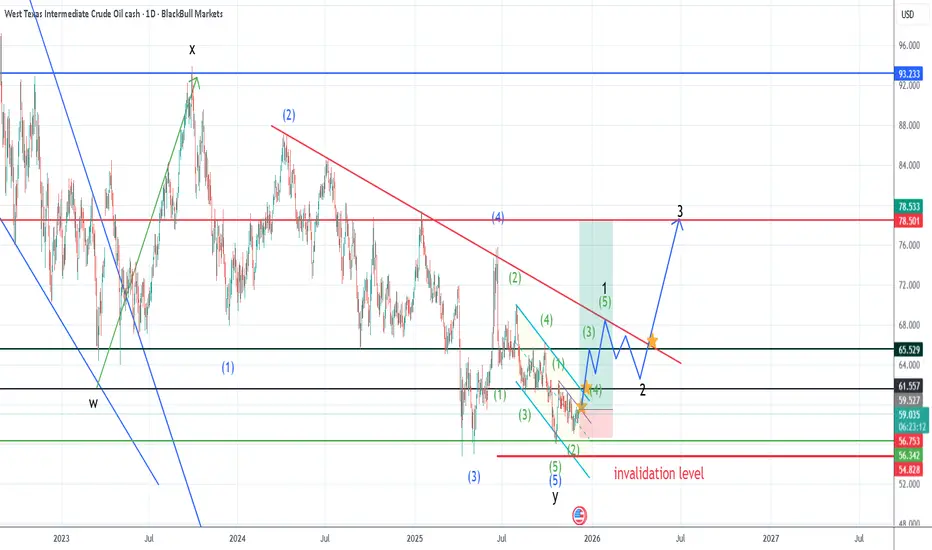
WTI Crude Oil – Wolfe Waves Completed at Point 5
🛢️
The chart is screaming a classic Wolfe Waves setup – five clean points, with Point 5 delivering a sharp rebound right off the 2–2.24 Fibonacci extension. That’s textbook behavior at the end of the final impulsive wave.
Point 5 isn’t just the exhaustion zone… it’s the launchpad where market makers typically reload before driving price toward the 1–4 line.
Currently, price is holding firm above the balance zone (58–59.20), setting the stage for a medium-term reversal.
---
🎯 Projected Target
66 USD
This isn’t a random number – it’s a direct projection from the extended 1–4 line.
---
🔒 Stop-Loss Strategy
Two profiles, two levels of risk management:
1. Short-term traders (Intraday/Swing):
• Daily close below 58 USD
2. Position traders / Investors:
• Break below 55 USD
---
⚡ In short: Wolfe Waves are complete, Point 5 has spoken, and the market is gearing up for a run toward 66 USD.


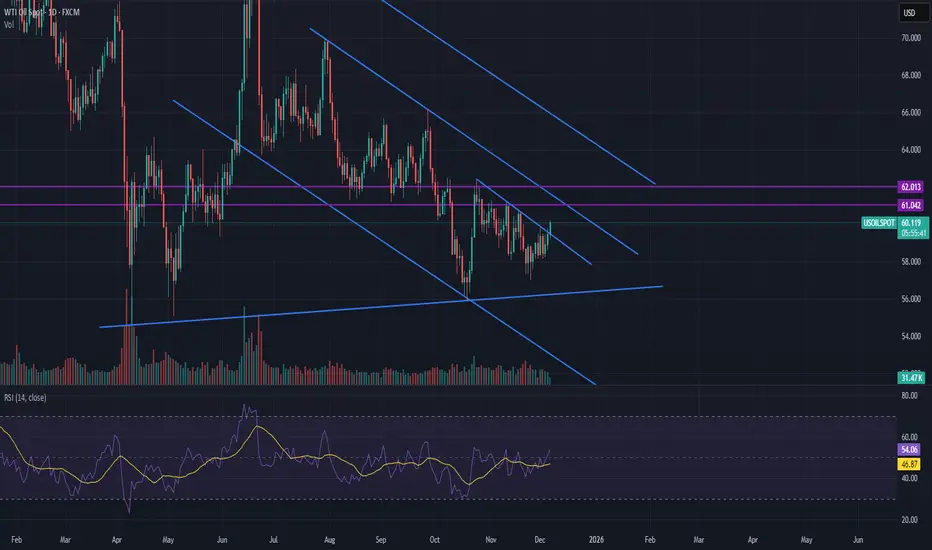
XTIUSD channel pattern ShortXTIUSD has rejected from the chanlle pattern resistance and price may go still down and Short it . let us see how it palys out

USOIL strong down trend entry on consolidation breakdown USOIL Technical Outlook – 4H Timeframe
USOIL continues to show strong downside momentum, with sellers maintaining control. Price is currently respecting the downtrend structure, and a consolidation breakdown below 59,100 is confirming further bearish pressure.
📉 Key Technical Levels:
Immediate Support: 58,300
Next Major Support: 56,400
As always, ensure you are using proper risk management and wait for clear confirmations before entering any position.
👍 Like • Follow • Comment • Share
Stay updated for more professional market insights.
