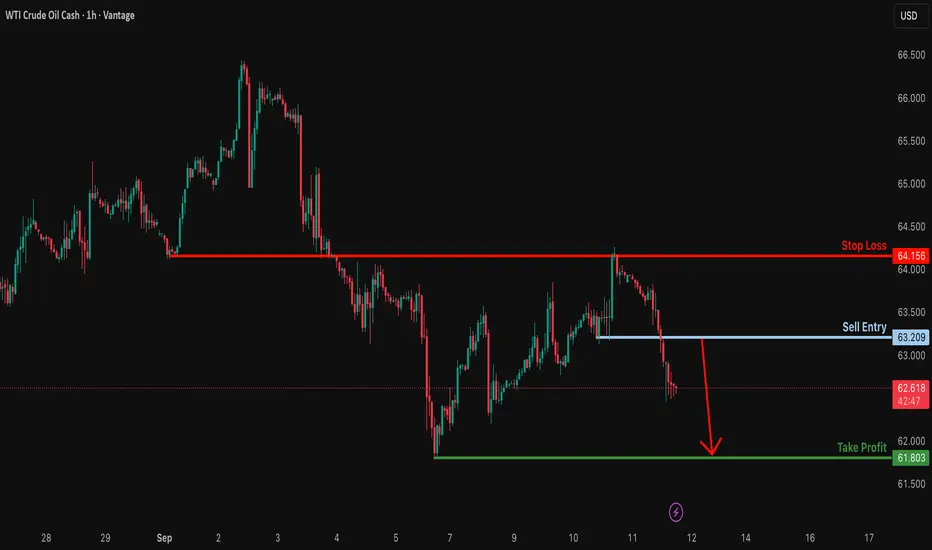
Bearish continuation?USO/USD is rising towards the resistance level, which is a pullback resistance, and could drop from this level to our take profit.
Entry: 63.20
Why we like it:
There is a pullback resistance level.
Stop loss: 64.15
Why we like it:
There is an overlap resistance level.
Take profit: 61.80
Why we like it:
There is a swing low support.
Enjoying your TradingView experience? Review us!
Please be advised that the information presented on TradingView is provided to Vantage (‘Vantage Global Limited’, ‘we’) by a third-party provider (‘Everest Fortune Group’). Please be reminded that you are solely responsible for the trading decisions on your account. There is a very high degree of risk involved in trading. Any information and/or content is intended entirely for research, educational and informational purposes only and does not constitute investment or consultation advice or investment strategy. The information is not tailored to the investment needs of any specific person and therefore does not involve a consideration of any of the investment objectives, financial situation or needs of any viewer that may receive it. Kindly also note that past performance is not a reliable indicator of future results. Actual results may differ materially from those anticipated in forward-looking or past performance statements. We assume no liability as to the accuracy or completeness of any of the information and/or content provided herein and the Company cannot be held responsible for any omission, mistake nor for any loss or damage including without limitation to any loss of profit which may arise from reliance on any information supplied by Everest Fortune Group.
USCRUDEOILCFD trade ideas
Oil slips on weak U.S. demand, supply glut concernsOil slips on weak U.S. demand, supply glut concerns
Oil prices dipped late Thursday as U.S. crude stocks rose 3.9M barrels, defying forecasts for a decline, while the IEA lifted supply estimates, signaling a larger surplus ahead. Losses were capped by rising geopolitical risks, with the U.S. and EU weighing tougher sanctions on Russia after fresh Ukraine-related tensions. Traders now balance bearish fundamentals with potential supply disruptions.

Potential bearish drop?WTI Oil (XTI/USD) has rejected off the pivot, which has been identified as a pullback resistance and could drop to the pullback support.
Pivot: 65.81
1st Support: 57.80
1st Resistance: 68.85
Disclaimer:
The above opinions given constitute general market commentary, and do not constitute the opinion or advice of IC Markets or any form of personal or investment advice.
Any opinions, news, research, analyses, prices, other information, or links to third-party sites contained on this website are provided on an "as-is" basis, are intended only to be informative, is not an advice nor a recommendation, nor research, or a record of our trading prices, or an offer of, or solicitation for a transaction in any financial instrument and thus should not be treated as such. The information provided does not involve any specific investment objectives, financial situation and needs of any specific person who may receive it. Please be aware, that past performance is not a reliable indicator of future performance and/or results. Past Performance or Forward-looking scenarios based upon the reasonable beliefs of the third-party provider are not a guarantee of future performance. Actual results may differ materially from those anticipated in forward-looking or past performance statements. IC Markets makes no representation or warranty and assumes no liability as to the accuracy or completeness of the information provided, nor any loss arising from any investment based on a recommendation, forecast or any information supplied by any third-party.

USOIL BULLISH BIAS RIGHT NOW| LONG
USOIL SIGNAL
Trade Direction: long
Entry Level: 63.13
Target Level: 65.08
Stop Loss: 61.82
RISK PROFILE
Risk level: medium
Suggested risk: 1%
Timeframe: 9h
Disclosure: I am part of Trade Nation's Influencer program and receive a monthly fee for using their TradingView charts in my analysis.
✅LIKE AND COMMENT MY IDEAS✅

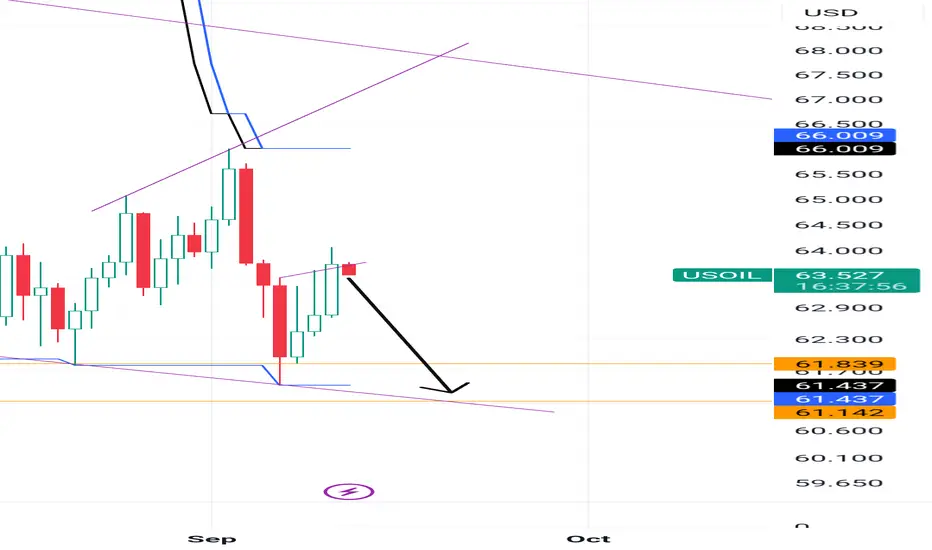
USOIL latest trend analysis and operation layout#USOIL
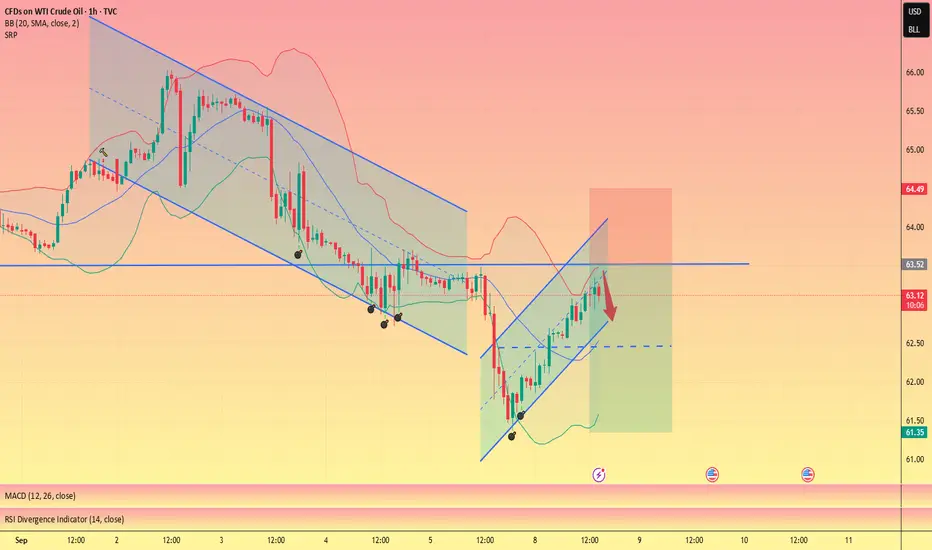
Crude oil continued to rebound in the European session, but the short-term 4H moving average was still pressing downward, and it was obvious that the short-selling momentum had not completely subsided. The overall trading rhythm is mainly based on rebound shorting. The short-term upper resistance level is 63.5-64.5. If it fails to break through effectively, crude oil will usher in a retracement, with the target looking at 62.5-61.5
🚀 SELL 63.5-64.5
🚀 TP 62.5-61.5
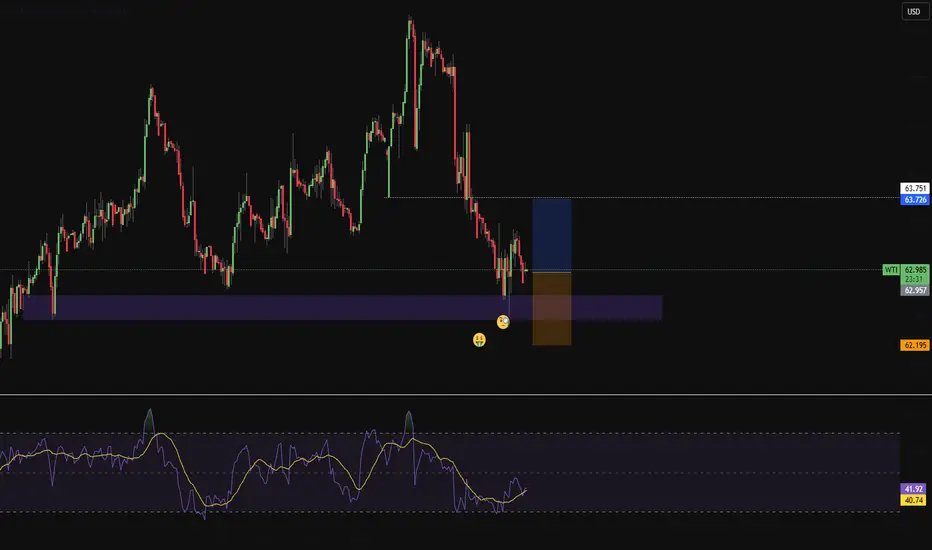
OILUSD – Demand Zone Reaction (4H Analysis)Price has been moving in a bearish trend, forming lower highs and lower lows. Recently, it tapped into a strong demand zone (blue box) and is now showing signs of a bullish reaction.
🔎 Key Points:
Price reacted strongly from the demand zone.
A trendline break is visible, suggesting bearish momentum is weakening.
Stop loss is placed below the demand zone (61.36).
Take profit is set at the next supply zone / resistance around 66.05.
💡 If buyers hold this level, we may see a strong push toward 66.05. But if demand fails, price could revisit lower levels.

WTI Oil Shorting Opportunity | Technical + Macro Confirm📌 WTI CRUDE OIL | Money-Making Thief Plan 🛢️ (Swing/Day Trade)
🗡️ Thief Strategy Plan (Bearish Bias)
Plan: Bearish setup confirmed — sellers in control after MA rejection of bulls 📉
Entry (Layered Style):
63.000 🔪
62.500 🔪
62.000 🔪
61.500 🔪
(You may increase or adjust layers based on your own plan)
Stop Loss (Thief SL): @64.000 ❌
⚠️ Adjust SL according to your risk & strategy
Target (Thief TP): Key resistance zone + overbought trap @4.6700 🎯
Note: Dear Ladies & Gentlemen (Thief OG’s) — I don’t recommend locking only my TP. Take your profits wisely & manage risk responsibly. 💰
❓ Why This Plan?
Moving average rejection confirms sellers’ dominance ⚔️
Technical indicators showing strong sell bias 📉
Layered entry strategy helps in catching moves efficiently 🎯
Oversupply risk + weak demand = bearish fuel 🔥
Retail & institutions both leaning short-side heavy 🐻
🔍 Market Analysis (Technical + Fundamental + Macro + Sentiment)
📊 Real-Time Price Action - Sep 05
Daily Change: -1.03%
Monthly Change: -2.84%
Yearly Change: -8.44%
😊 Retail & Institutional Sentiment
Retail Traders: 35% 🐂 | 55% 🐻 | 10% 😐
Institutional Traders: 30% 🐂 | 60% 🐻 | 10% 😐
🌡️ Fear & Greed Index
Current: 25/100 — Fear 😟
Mood: Cautious, driven by oversupply fears + weak demand
⚒️ Fundamental Score: 40/100 (Bearish)
U.S. crude inventories unexpectedly +2.42M vs. -2.19M expected 📈
OPEC+ considering production increase 🌍
Weak China demand signals 📉
🌐 Macro Score: 35/100 (Bearish)
Fed rate cut expectations (25bp likely in September) 💸
Global slowdown fears 🌎 (Europe + Asia weak data)
Geopolitical risks (Russia-Ukraine) limited impact 🚨
🏁 Overall Market Outlook: Bearish (Short Bias) 🐻
Declining prices + rising inventories + OPEC+ supply hike risk
Technicals = Strong Sell (daily/weekly)
Sentiment favors sellers across the board
🔮 Key Takeaway
WTI/USOIL remains heavy under supply pressure + demand weakness.
Market sentiment is fearful, with both retail & institutions leaning short.
⚡ Keep eyes on U.S. jobs data + OPEC+ decisions for any trend shifts.
📌RELATED PAIRS TO WATCH
BRENT CRUDE ( TVC:UKOIL ): $66.42 (-1.8% daily)
NATURAL GAS ( FX:NGAS ): $2.84 (-0.7% daily)
ENERGY ETFS: XLE, USO, UCO
OANDA:CADJPY : Oil-correlated currency pair
ENERGY STOCKS: NYSE:XOM , NYSE:CVX , NYSE:COP , NYSE:SLB
✨ “If you find value in my analysis, a 👍 and 🚀 boost is much appreciated — it helps me share more setups with the community!”
#USOIL #WTI #CrudeOil #ThiefTrader #EnergyMarkets #Commodities #OPEC #SwingTrade #DayTrade #OilAnalysis

OIL PRICE IS RISING!Oil price currently trade at $62.4 per barrel. I anticipate further rise in. My target profit is at $64 and $64.5 level. This is a potential buy trade which I believe it has a good probability.
Technically, we can spot equal lows from the H4 timeframe which is a bullish signal.

WTI OIL Short-term Channel Up 4H MA50 buy opportunity.Last week (August 26, see chart below) we caught the absolute low with our WTI Oil (USOIL) buy signal, hitting our $66.30 Target shortly after:
This time we have another buy signal on the short-term as the Channel Up that emerged has pulled-back all the way to its 4H MA50 (blue trend-line).
The last 3 times it did so, it was a buy opportunity. Assuming this is another Higher Low bottom, the new Bullish Leg that is about to be initiated, should aim for the 1.382 Fibonacci extension, similar to what the previous two did.
This gives us a $66.75 Target for the short-term.
-------------------------------------------------------------------------------
** Please LIKE 👍, FOLLOW ✅, SHARE 🙌 and COMMENT ✍ if you enjoy this idea! Also share your ideas and charts in the comments section below! This is best way to keep it relevant, support us, keep the content here free and allow the idea to reach as many people as possible. **
-------------------------------------------------------------------------------
💸💸💸💸💸💸
👇 👇 👇 👇 👇 👇

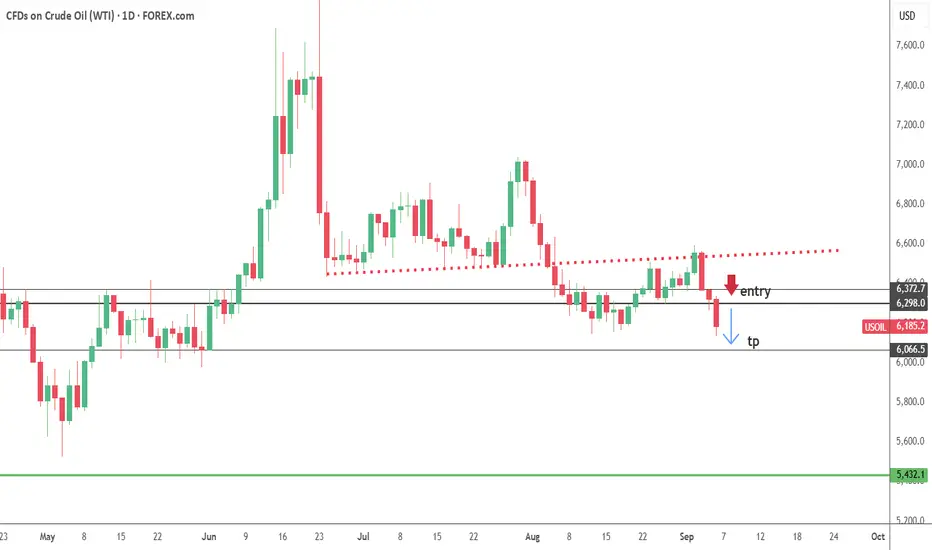
USOIL--SHORT--monthly bearish
--weekly bearish
--daily bearish
--tp and entry levels are as shown on chart
Crude Oil (XTI/USD) at Key Resistance: Breakout or Rejection ?Crude Oil (XTI/USD) has reached a major resistance level and now faces a critical decision point. If price breaks above this resistance, a long trade setup becomes attractive with upside targets at $70 and $71.
However, if rejection occurs at this level, downside momentum could build, with potential declines toward $60 and then $56. Traders should wait for price action confirmation before positioning, as the next move will likely define near-term market direction.

Crude Oil (USOIL) – Long SetupOil is currently trading around $63.20 and has formed a clean ascending structure, pushing into the breakout zone. Price is respecting the trendline well and is consolidating just below the EMA cluster – a breakout could be next.
We're currently in a narrow entry zone where bulls may gain control if we see a clean break above the local resistance range.
Trade Setup:
Entry: within the purple box (current zone)
Stop Loss: $62.60 just below the trendline – invalid if broken
Breakout Confirmation: clear candle close above $63.45
Targets:
T1: $63.70
T2: $64,60
Why Long?
Trendline support is holding – price has been bouncing cleanly off the rising line.
Momentum building – repeated tests of resistance without strong rejection.
EMA cluster as magnet – price may want to retest and potentially break through the EMA zone sitting above.
Summary:
Crude oil is coiling tightly just below resistance and trendline support is holding strong.
If we get a push above the breakout zone, I expect follow-through toward T1 = $63.70 and T2 = $64.60
Setup becomes invalid if the ascending trendline breaks clearly to the downside.
No financial advice – just how I see the chart.

OIL Trade Setup📢 NFX Trade Update – USOIL FX:USOIL
Price pushed above $64, tagging the 23.6% Fibonacci retracement, which I believe should hold. This move looks like a liquidity grab, hunting short stop-losses (our last setup included 😅). Classic SMC in play.
Now we have clearer insight: the key question is whether price respects the 23.6% Fib or extends higher. Based on strong fundamentals (recent inventory build signaling oversupply), I doubt sustained higher prices. The bearish case still holds weight.
🎥 Full breakdown and details in the video.

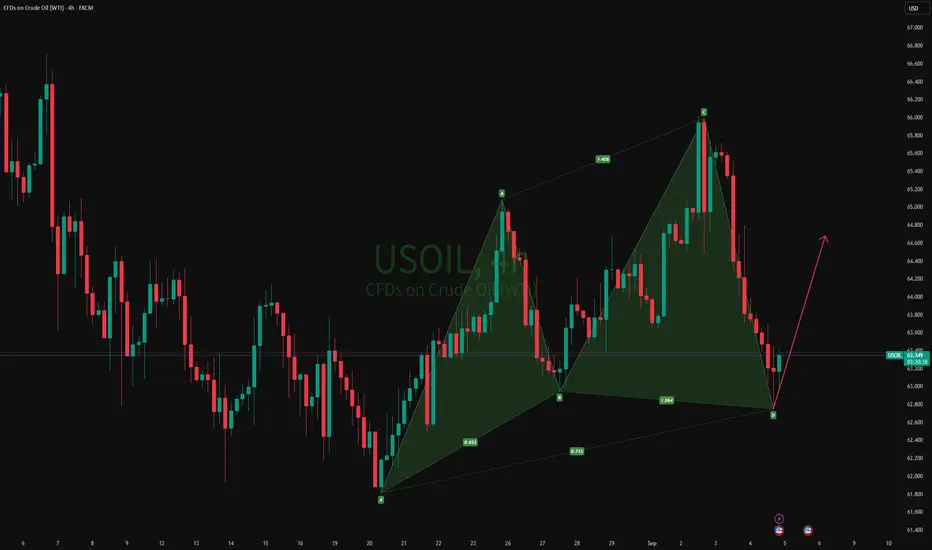
04-09-2025 USOILAs shown in the figure: 4H Bullish Cypher
The market is not always chaotic and disorderly, and there is a precise geometric beauty hidden in price fluctuations. The harmonic form long strategy is a powerful tool for accurately identifying potential market reversal points based on the Fibonacci ratio. When the form forms perfectly at the key support level, it often indicates the depletion of bearish momentum and the initiation of bullish trends.

Oil near $63 as Middle East tensions and tariff risks drive gainOil near $63 as Middle East tensions and tariff risks drive gains
WTI crude traded around $63 August 10, marking a third day of gains as Middle East tensions escalated after Israel struck Hamas leadership in Qatar. The move adds to years of regional operations and heightens supply concerns, supported by OPEC+’s smaller October output hike.
Meanwhile, U.S. President Trump urged the EU to impose 100% tariffs on Chinese and Indian goods to pressure Russia, with Washington ready to match. U.S. crude inventories rose 1.25M barrels, tempering the rally. Global stocks gained and the dollar steadied ahead of key U.S. inflation data, while gold held near record highs.

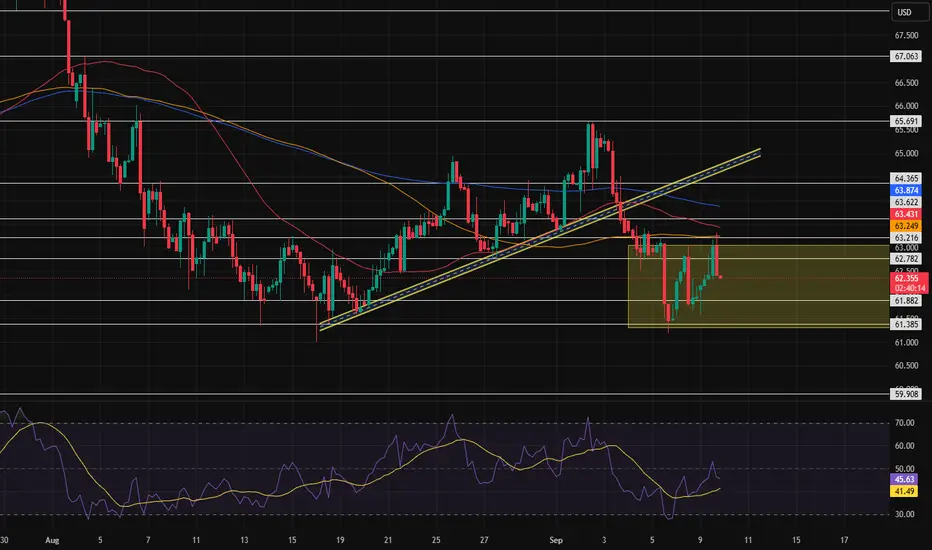
Range formationAs we analyzed yesterday and mentioned, the price was likely to form a range, and now this range has been activated. We need to wait and see whether the price breaks the range from the top or from the bottom. My personal opinion is that the probability of an upside breakout is higher due to the current conditions.
US OIL LONG RESULT US OIL price was consolidating inside a bullish pennant from which I took the long trade to the major resistance and it broke out as expected to the upside but didn't reach the major TP, but I managed to close before the tumble down with some good profits.

Is there a chance of a 50 basis point cut? SPX traded to new all time highs today.
Many stocks had blow off move or breakout candles.
Market makers cleared out lots of short interest today.
The employment data is starting to get worse.
A new 2 year high in initial jobless claims.
Markets rallied on dollar and yields weakness.
At some point the markets will price in a recession. Growth stocks need to be monitored closely.
We took profits on Tesla & Baidu today.

Complicated situation in the Middle EastThe downtrend in oil is quite clear to everyone, and naturally, oil prices are heavily dependent on war and insecurity news in the region. If the Middle East were in a normal state, oil prices should have been much lower. However, despite the ongoing downtrend, I don’t think it will drop below \$61. We might see a range forming, and there’s also a chance that a single piece of news could reverse the trend.

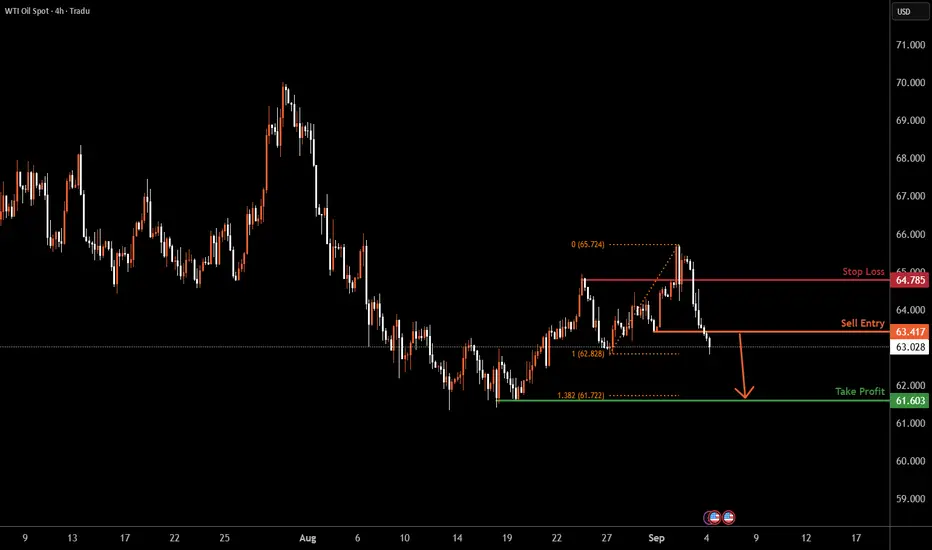
USOIL H4 | Potential bearish dropBased on the H4 chart analysis, we can see that the price has reacted off the sell entry, which is a pullback resistance and could drop from this level to the downside.
Sell entry is at 63.41, which is a pullback resistance.
Stop loss is at 64.78, which is a pullback resistance.
Take profit is at 61.60, which is a swing low support that lines up with the 138.2% Fibonacci extension.
High Risk Investment Warning
Trading Forex/CFDs on margin carries a high level of risk and may not be suitable for all investors. Leverage can work against you.
Stratos Markets Limited (tradu.com ):
CFDs are complex instruments and come with a high risk of losing money rapidly due to leverage. 65% of retail investor accounts lose money when trading CFDs with this provider. You should consider whether you understand how CFDs work and whether you can afford to take the high risk of losing your money.
Stratos Europe Ltd (tradu.com ):
CFDs are complex instruments and come with a high risk of losing money rapidly due to leverage. 66% of retail investor accounts lose money when trading CFDs with this provider. You should consider whether you understand how CFDs work and whether you can afford to take the high risk of losing your money.
Stratos Global LLC (tradu.com ):
Losses can exceed deposits.
Please be advised that the information presented on TradingView is provided to Tradu (‘Company’, ‘we’) by a third-party provider (‘TFA Global Pte Ltd’). Please be reminded that you are solely responsible for the trading decisions on your account. There is a very high degree of risk involved in trading. Any information and/or content is intended entirely for research, educational and informational purposes only and does not constitute investment or consultation advice or investment strategy. The information is not tailored to the investment needs of any specific person and therefore does not involve a consideration of any of the investment objectives, financial situation or needs of any viewer that may receive it. Kindly also note that past performance is not a reliable indicator of future results. Actual results may differ materially from those anticipated in forward-looking or past performance statements. We assume no liability as to the accuracy or completeness of any of the information and/or content provided herein and the Company cannot be held responsible for any omission, mistake nor for any loss or damage including without limitation to any loss of profit which may arise from reliance on any information supplied by TFA Global Pte Ltd.
The speaker(s) is neither an employee, agent nor representative of Tradu and is therefore acting independently. The opinions given are their own, constitute general market commentary, and do not constitute the opinion or advice of Tradu or any form of personal or investment advice. Tradu neither endorses nor guarantees offerings of third-party speakers, nor is Tradu responsible for the content, veracity or opinions of third-party speakers, presenters or participants.