Cup and Handle Breakout On Natural GasNatural Gas price formed a smooth rounded base, a classic cup pattern.
Then, the breakout came with a strong bullish candle, confirming momentum has shifted fully in favor of the bulls.
After this breakout, we can expect a brief pullback.
As long as price holds above the breakout zone, the structure remains bullish.
The next leg higher is anticipated to target the 4.100 area, completing the measured move of the pattern.
In short, buyers are in charge, and this breakout looks ready to extend further.
Trade ideas

Natural Gas Building Momentum for a New Impulsive RallyNatural Gas Building Momentum for a New Impulsive Rally
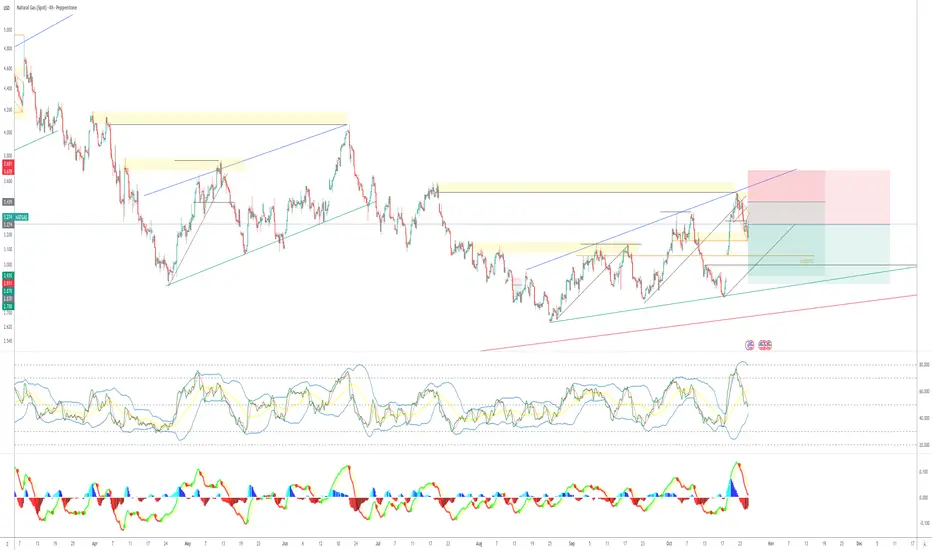
On the 4-hour timeframe, Natural Gas is forming large continuation patterns, signaling potential for another upward move.
An accumulation phase was observed in early September 2025, followed by another at the beginning of October. As we enter a new month, the price may be preparing to launch a fresh impulsive leg to the upside, as illustrated in the chart, before entering another corrective phase.
Key target levels:
4.28
4.48
4.60
You may find more details in the chart!
Thank you and Good Luck!
❤️PS: Please support with a like or comment if you find this analysis useful for your trading day❤️

NATURAL GAS(XNGUSD) | Final Wave 2 Flush Before Mega Wave 3⚡ NATURAL GAS – The Final Flush Before the Supercycle ⚡
After topping out in 2005 , Natural Gas has spent nearly two decades inside a massive corrective structure — slowly grinding lower, retracing, and shaking out every long-term bull in sight.
What we’re seeing now could be the final leg of Wave 2 in that entire supercycle.
This ongoing correction, stretching from 2005 to now, is likely entering its final phase — an exhaustion move that could complete between $1.466–$1.413 .
This zone aligns perfectly with:
✅ Deep 0.786 Fibonacci retracement of the previous impulse
✅ Historical demand and structural support
✅ Liquidity resting beneath long-term lows
✅ Smart Money accumulation footprints beginning to show
If price stabilizes here, we could be witnessing the foundation of a new multi-year Wave 3 , which historically tends to be the most explosive move in the Elliott Wave cycle.
🧭 Technical & Structural Overview
📊 Elliott Wave View:
Wave 1: 2005–2021 impulsive phase
Wave 2: 2021–present, deep ABC correction (now in the C-wave)
Expected completion: $1.466–$1.413 zone
Next: Wave 3 lift-off → potential parabolic move
📐 Fibonacci & Wave Confluence:
0.786 retracement zone → $1.4–$1.5 (ideal Wave 2 termination area)
Wave 3 1.618 extension → $68
Supercycle 2.618 projection → $700+
🧠 Smart Money Concept:
Institutions love to accumulate during despair.
We can already see signs of a liquidity sweep , followed by potential accumulation and a pending market structure shift once price reclaims levels above $3.5–$4.0.
🌍 Fundamentals Align
Global LNG demand continues to rise, especially across Asia and Europe.
US export capacity and infrastructure expansion add long-term bullish pressure.
Supply investment remains underweight — a key setup for future price shocks.
Despite green energy growth, Natural Gas remains the bridge fuel for stability.
This macro alignment supports a generational reversal once the current flush completes.
🎯 Price Map
💎 Wave 2 Completion Zone: $1.466–$1.413
🚀 Wave 3 Target (1.618 ext): $60–$70
🌠 Supercycle Wave 5 (2.618 ext): $700+
⚠️ Invalidation: Sustained breakdown below $1.40
💬 Summary
Natural Gas is approaching the final phase of a two-decade correction — an extremely rare setup in macro wave structure.
When Wave 2 completes, the stage will be set for one of the strongest commodity bull waves in modern market history.
📈 “When the crowd sees destruction, smart money sees construction — and that construction may already be starting around $1.4.”
What are you seeing in your charts? Do you think the bottom is in, or do we need one more liquidity sweep first? 👇
#NaturalGas #NatGasUSD #ElliottWave #WaveAnalysis #SmartMoney #Fibonacci #MarketStructure #Commodities #EnergyMarkets #MacroCycle #CommoditySupercycle #Wave3Setup #TechnicalAnalysis #TradingView #Investing

Natgas - at trendline resistanceNatgas - is at trendline resistance
While momentum is strong, some pullback is overdue.
Sell With SL at 4.45

Hear Me OutNatty’s October Pump – What’s Next?
Natural Gas ripped higher through October, right in line with seasonal tendencies. Historically, November tends to cool off as hedging activity stabilizes heading into winter—and early price action suggests that pattern is holding.
Weather Outlook
Late November: Forecasts point to colder conditions for the Midwest and East, which could boost heating demand. However, much of this has already been priced in from long-range models.
December: Current outlook leans toward a warm start, but the duration is uncertain. If warmth persists, expect reduced hedging and softer demand.
Fundamentals Snapshot
Storage: U.S. working gas in storage sits at 3,915 Bcf, about 162 Bcf above the 5-year average—the highest pre-winter level in five years.
Production: Lower-48 dry gas output is near 110 Bcf/d, an all-time high, up roughly 8% year-over-year.
Exports: LNG feedgas flows remain strong at ~17 Bcf/d, with new capacity ramping up. Pipeline exports to Mexico are also trending higher.
Power Burn: Slightly below last winter at ~31.6 Bcf/d versus 32.5 Bcf/d, as coal, nuclear, and renewables offset gas demand.
Technical Picture
Natty recently hit the 78.6% Fibonacci retracement near $4.40 from the March high, which acted as resistance. Current range:
Resistance: $4.40–$4.45
Support: $4.15
A break below $4.15 opens downside targets:
38.2% Fib: ~$3.94
50% Fib: ~$3.80
Major demand zone: ~$3.50
Momentum indicators are rolling over from overbought territory, suggesting a corrective phase before any renewed upside.
My Base Case
Expect a retracement toward $3.50–$3.80 by late December, assuming:
Warm December persists.
Storage remains above average.
No major polar vortex event.
I’ll reassess at that level for potential long setups into Q1.
Risk Scenarios
Bullish Risk: A sudden Arctic blast or prolonged cold in December could spike heating demand and trigger a short squeeze, pushing Natty back above $4.50.
Supply Risk: LNG export disruptions or pipeline outages could tighten balances unexpectedly.
Sentiment Angle
Hedge Funds: CFTC positioning shows managed money net longs have increased during the October rally but remain below historical extremes—room for more volatility.
Retail Bias: Social chatter leans bullish after the October pump, which often precedes corrective phases.

Warm November vs. Record LNG: Why Gas Holds $4Weather – Strong Bearish Driver: Actual NOAA forecasts (6–10d and 8–14d) are consistently warm, with a 70% probability of above-normal temperatures in key regions. This is a strong bearish factor for heating demand.
EIA: The latest report (Oct 30) showed a +74 Bcf injection vs. a +71 Bcf consensus. That’s a bearish factor. Total storage remains +171 Bcf above the 5-year average.
LNG exports: On October 25 we had a record 17.3 bcfd, and on November 1 the market expected 17.9 bcfd — a new all-time high. That’s +0.6 bcfd in a week, which is a lot for late October. A powerful bullish driver.
Storage is high and the weather is warm, but price is not falling because everyone is watching the LNG number at 17–18 bcfd.
Because of the U.S. government shutdown, CFTC (COT) reports are not being published. Nobody sees the real positioning of large funds.
Fundamentals are pushing down, technicals are pulling up, and the lack of COT does not allow the trend to be confirmed.
The seasonal weight of weather in November puts weather in the first place in terms of price impact.
Exports are very strong, almost record level — that’s why the market doesn’t want to drop even when weather and storage are “bearish.” In this context LNG acts as a support and explains why price is still holding below 4.20 instead of pulling back to 3.6.
Weather is bearish right now, which means you cannot just “relax and hold a trend long.”
The market has formed an upper range and will wait to see what changes first — a shift in NOAA (warmer/colder) or a drop/disruption in LNG. That’s what will drive the next move.
A short from a false breakout of 4.18 and buys from levels are intraday trades.

Natural Gas double top Natural gas forming a double top and a lower top,
The price should go and remain below 4.3 so it can confirm dropping to
4.25
4.2
4.15
4.05
4
Then if it stabilizes below 4 for at least 4 hrs then can be targeting 3.93
3.88
3.77
3.5 also

Natural Gas - Bullish Long Term SignalNatural Gas rallied on inventories today.
Inventory report came in better than expected. 33B build vs 34B estimate.
Natural Gas is on the precipous of squeezing to $5.40
A golden cross is set to occur in the next few sessions....When the 50MA and the 200 MA crossover occurs it likely means the medium to long term price goes higher.
In the very near term that signal often results in some profit taking.

Natural Gas Short Squeeze!Natural Gas has entered the weekly short squeeze level.
Another impeccable rally, it makes you wonder where the bullish fundamentals are coming from.
It hasn't been from the inventory level demand.
Perhaps their is a escalation or conflict brewing that we will be discovering soon enough.
We have been discussing the Nat GAs inventories and how they were into good accumulation levels.
If Nat gas can hold above that weekly high pivot it swing the probabilities in favor of a $5 target.

Is This the Start of the Next Natural Gas Upswing?💨 Natural Gas (XNG/USD) — “Profit Pathway Setup” 🎯 Swing / Day Trade Edition
📊 Market Overview:
The Energies Market is heating up — and Natural Gas is showing its next potential boom move! After a confirmed Moving Average Breakout, bulls are sneaking back in. 🕵️♂️
This setup blends discipline + creativity, using the Thief-Trader layered entry method — designed to catch price action efficiently while minimizing emotional errors. ⚙️
⚔️ Trade Plan (Bullish Setup):
Entry Zones (Layered Buys):
🟩 3.500
🟩 3.600
🟩 3.700
(You can expand your buy layers depending on your own comfort and risk plan.)
Stop-Loss (Thief SL):
🧯 3.350 — just below the nearest lower-low candle wick.
💬 Dear Ladies & Gentlemen (Thief OG’s) — this SL is a personal style choice, not a fixed rule. Manage your risk your way.
Target (Profit Escape Zone):
🎯 4.100 — a strong resistance + overbought + trap + distribution zone.
💬 Reminder: I’m not forcing my TP; you’re the boss of your own bag — make your profits, then take them! 💰
📈 Why This Setup Works:
🧠 Technical Confirmation: MA breakout = bullish continuation in progress.
🎯 Layering Strategy: Multiple limit orders reduce average cost + improve flexibility.
🏗️ Structural Setup: Clear accumulation → breakout → markup pattern emerging.
🧩 Exit Logic: Resistance + trap-zone = high-probability exit zone for profit capture.
🌍 Related Assets to Watch (Correlation Check):
💹 NYMEX:NG1! — Natural Gas futures benchmark, strong global mirror.
AMEX:UNG — U.S. NatGas ETF; sentiment confirmation.
🛢️ BLACKBULL:WTI / BLACKBULL:BRENT — closely tied to energy flow; when oil strengthens, gas often follows.
⚡ TVC:DXY — dollar strength can inversely impact commodity demand.
💵 FX:EURUSD — macro correlation to risk appetite across energy & FX.
Keep eyes on these pairs — their momentum helps confirm or contradict your NatGas bias. 👀
📌 Key Takeaways:
✅ Trend Bias: Bullish
💪 Setup Type: Swing / Day Trade hybrid
🧮 Risk : Reward: Favorable above 1 : 3
⏳ Holding Window: Short-term → Mid-term (2 – 5 days typical)
🧭 Trade Management: Stick to your plan — don’t chase, layer smart.
⚠️ Pro Tip:
If price breaks below 3.350, it’s a signal to step aside — no hero moves. 🛑
Price structure > emotions. Stay patient, and let the plan do the heavy lifting. 🧘♂️
✨ “If you find value in my analysis, a 👍 and 🚀 boost is much appreciated — it helps me share more setups with the community!”
#NaturalGas #XNGUSD #EnergyTrading #SwingTrading #DayTrading #TechnicalAnalysis #BreakoutStrategy #CommodityTrading #ForexTrading #TradingIdeas #RiskManagement #MarketAnalysis #EnergyMarkets #TradingView #ChartAnalysis

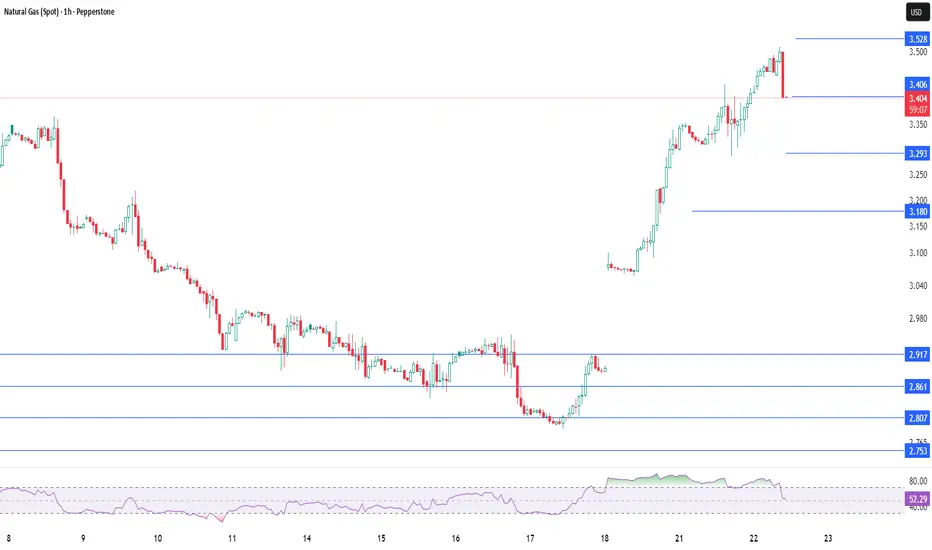
NATGAS Long Setup – Accumulation + Breakout OpportunityInstrument: US Natural Gas (Spot)
Timeframe: 1D
Published: July 24, 2025
By: @Rendon
📈 Idea Summary:
Natural gas is showing signs of accumulation after a corrective downtrend. Price recently tested key horizontal support around $2.96–$2.85 and is now attempting a recovery. Two potential bullish scenarios are outlined:
🧠 Bullish Scenarios:
🔵 Scenario A (blue path): Clean breakout above $3.32 with strong volume could lead to a continued push toward $3.56 → $3.79 → $4.05.
🔴 Scenario B (red path): Price may first retest the $2.96–$2.85 demand zone again before bouncing and gradually rallying toward $4.05.
🔍 Key Levels:
Support: 2.961 / 2.957 / 2.854
Resistance: 3.323 → 3.568 → 3.792 → 4.046
🛑 Invalidation:
A decisive close below $2.84 would invalidate the bullish thesis and suggest further downside risk.
📊 Volume Insight:
Volume has been drying up, which may indicate a potential spring or absorption before a breakout.
✅ Trade Plan (example):
Entry: On retest of $2.95 or break of $3.32
Stop Loss: Below $2.84
Target: First TP at $3.56, then trail toward $4.05
💬 Let me know in the comments how you see NATGAS developing and which path you’re betting on!

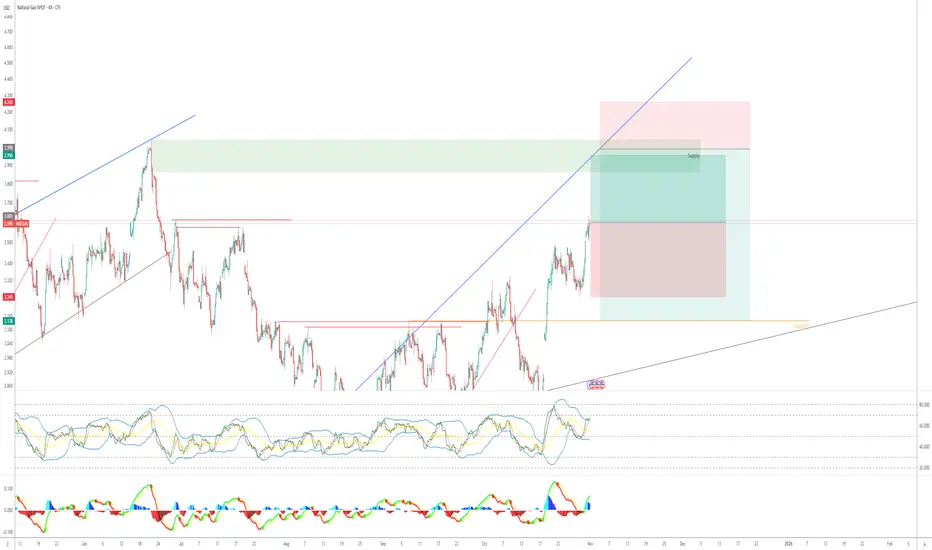
NATGAS Long and Short (B setup)My previous analysis for NATGAS didn't very well catch the upper channel. I have adjusted the upper current channel of NATGAS according to the CHOC that happened on the 4Hr on 28 AUG 2025. Thus, my currently 2 weeks plan is to target the upper channel with correction to the current support level at 3.138 near the lower channel.
The setup up is simple. My current bias shifted to bullish for next 2 months. Therefore, internal and external price action with POIs is my entry points for long and short, as is shown in this setup.
XNG ( Natural Gas)⚡ Natural Gas Showing Stronger Short-Term Potential Than WTI! 🌿
While crude oil (WTI) is struggling to find firm direction, Natural Gas is heating up with renewed momentum.
✅ Weather shifts are boosting short-term demand.
✅ Technical structure looks cleaner with higher lows forming.
✅ Fundamentals favor gas — seasonal consumption is rising while supply remains tight.
Meanwhile, WTI is consolidating under resistance, showing less conviction from buyers.
📊 Short-Term View:
👉 Natural Gas — Bullish Bias
👉 WTI Crude — Neutral
Energy markets often move together, but this time Natural Gas looks ready to lead the way. 🔥
#NaturalGas #WTI #Commodities #EnergyMarkets #TradingView #BullishSetup #GasVsOil #ShortTermTrade

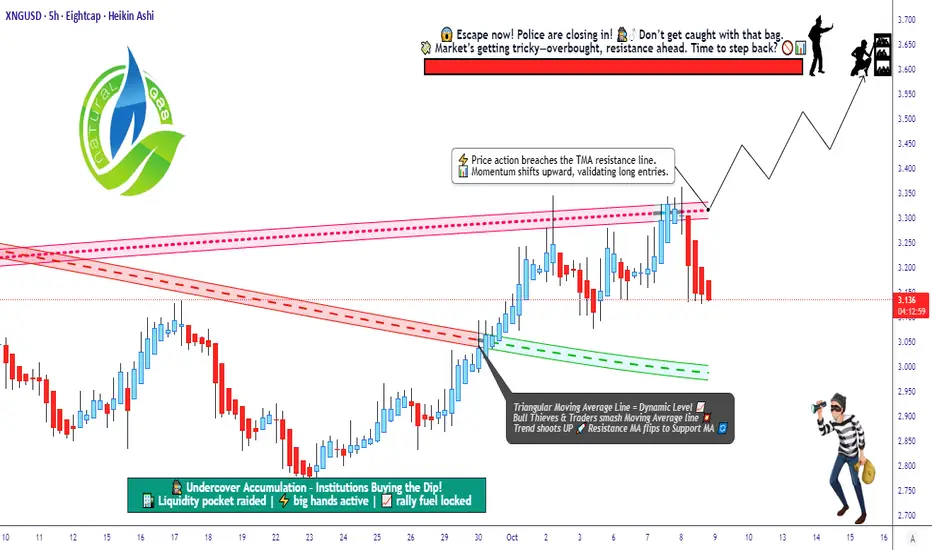
Is This the Start of a Fresh Bull Run in Natural Gas (XNG/USD)?🎯 XNG/USD Natural Gas: The Great Energy Heist! 💰⛽
📊 Market Overview
Natural Gas is setting up for a classic "Ocean's Eleven" style breakout! The 382 Triangular Moving Average has been breached by the bulls, and the trend confirmation is IN. Time to plan our strategic entry into this energy market opportunity!
🔥 The Master Plan: BULLISH Setup
Strategy Type: Swing/Day Trade - Cash Flow Management
Confirmation Signal: 382 Triangular Moving Average breached to the upside ✅
Entry Method: Buy the dip when TMA confirms the bullish trend
💎 Layered Entry Strategy (Scale In Like a Pro!)
⚠️ IMPORTANT: You can enter at ANY price level after the breakout confirmation! Set alerts on your trading platform to catch the breakout easily.
Recommended Entry Layers:
🎯 Layer 1: $3.100
🎯 Layer 2: $3.150
🎯 Layer 3: $3.200
🎯 Layer 4: $3.250
🎯 Layer 5: $3.300
This layering approach helps average your entry and reduces risk!
🛡️ Risk Management Zone
Stop Loss: $3.000
⚠️ Disclaimer: This is MY stop loss level based on my risk tolerance. YOU should determine your own stop loss based on YOUR risk management rules and account size. Trade at your own risk!
🎪 Target Zone: The Great Escape!
Primary Target: $3.600 🚀
Why $3.600? This level acts as:
🚧 Strong resistance (Police barricade zone!)
📉 Oversold bounce area
Potential bull trap zone
Exit Strategy: Lock in profits BEFORE reaching the target zone. Secure your gains and don't get greedy!
⚠️ Disclaimer: This is MY target based on my analysis. YOU should take profits at levels that match YOUR trading plan and risk tolerance. Always trade at your own risk!
🔗 Correlated Assets to Watch
Keep an eye on these related markets for confirmation:
AMEX:UNG (United States Natural Gas Fund) - Direct correlation
AMEX:BOIL (2x Leveraged Natural Gas ETF) - Amplified moves
AMEX:KOLD (Inverse Natural Gas ETF) - Opposite direction
AMEX:XLE (Energy Sector SPDR) - Broad energy sector correlation
NYMEX:CL1! (Crude Oil) - Energy sector correlation
COMEX:HG1! (Copper) - Industrial demand indicator
Key Correlation Point: Natural Gas often moves with broader energy sentiment. Watch crude oil and energy sector strength for confirmation of bullish momentum.
📝 Key Technical Points
✅ 382 Triangular Moving Average breakout = Trend confirmation
✅ Layered entries reduce average cost and risk
✅ Multiple timeframe confluence at target zone
✅ Energy sector showing relative strength
✅ Risk-reward ratio favors bulls above $3.000
⚡ Trading Notes
This setup combines technical precision with proper risk management. The TMA breach is a strong momentum indicator, and the layered entry approach allows for strategic position building. Remember to manage your position size according to your account and always have a plan before entering!
🎭 The "Thief Style" Disclaimer
🎪 FOR ENTERTAINMENT & EDUCATIONAL PURPOSES ONLY!
This "thief style" trading strategy is presented with a fun, heist-themed twist to make technical analysis more engaging. This is NOT financial advice. I'm not a licensed financial advisor, and you should NOT blindly follow any trading setup. Always do your own research, consult with licensed professionals, and never risk more than you can afford to lose. Trading is risky, and past performance doesn't guarantee future results. This is my personal analysis shared for educational purposes only! 🎭
✨ If you find value in my analysis, a 👍 and 🚀 boost is much appreciated — it helps me share more setups with the community!
#NaturalGas #XNG #XNGUSD #EnergyTrading #SwingTrading #DayTrading #TechnicalAnalysis #TriangularMovingAverage #TMA #Breakout #BullishSetup #TradingStrategy #RiskManagement #LayeredEntry #CashFlowManagement #EnergyCommodities #NatGas #CommodityTrading #TrendTrading #PriceAction
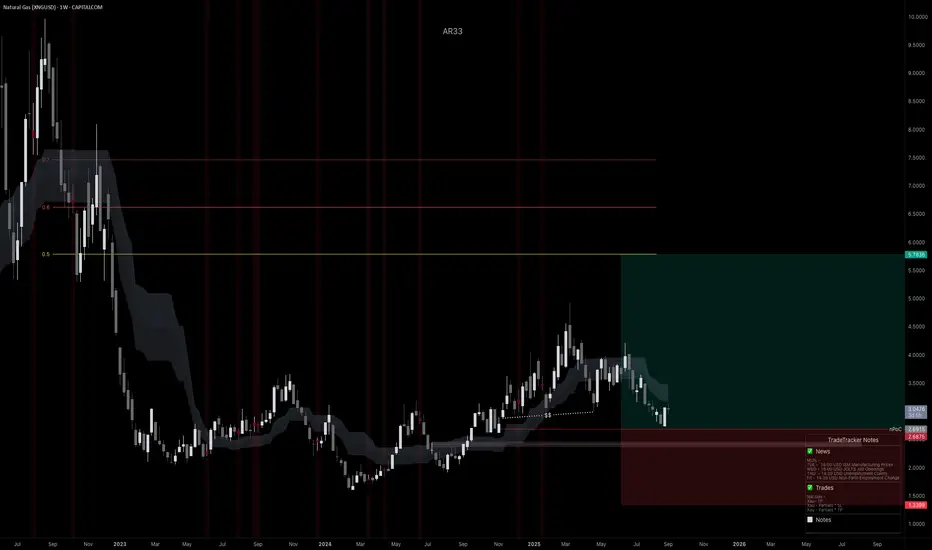
XNGUSD, Accumulation to Expansion? Weekly Long Into Winter RiskI’ve initiated a long on Natural Gas from weekly structure. Price has rotated inside this area since ’23 and is now reacting at a confluence of trendline support + prior demand. The plan is to hold into Q4, when seasonality (heating demand + potential hurricane/LNG disruptions) often provides upside tailwinds. Risk is defined on the weekly chart; I’ll manage around swings and let the position work.
Technicals (Weekly)
• Range base reclaimed: Price is bouncing from the same 2023–2024 accumulation zone (roughly 2.5–3.0).
• Multi-touch trendline support: Current candle is reacting at the rising base trendline; wicks show responsive buying.
• Structure targets: First objective is a move back into mid-range supply; extension aims toward the upper band shown on the chart.
Fundamentals Supporting Long Bias
• Seasonality: Q4 typically brings rising Heating Degree Days across the Northern Hemisphere; winter risk premia often get priced ahead of the draw season.
• LNG pull: Ongoing ramp in global LNG demand + incremental U.S. export capacity tends to tighten the domestic balance on cold forecasts or unplanned outages elsewhere.
• Supply discipline: Gas rig counts have lagged after the 2024 price slump; that slower supply response can tighten later-year balances if weather cooperates.
• Weather & Gulf risk: Peak hurricane season can interrupt Gulf production and processing, periodically supporting price.
• Europe draw season: As EU storage transitions from injection to draws, import needs rise, keeping a bid under seaborne gas.
Trade Plan:
• Entry: From weekly support (see chart).
• Management: Trail below fresh higher lows on the daily; take partials at fib/structure levels; let a runner target the upper band if momentum broadens.
What Breaks the Thesis
• A persistently warm Q4, outsized storage overhang into winter, major LNG outages/delays, or a renewed surge in production that swamps demand.
Note: Please remember to adjust this trade idea according to your individual trading conditions, including position size, broker-specific price variations, and any relevant external factors. Every trader’s situation is unique, so it’s crucial to tailor your approach to your own risk tolerance and market environment.
XNGUSD-NATURAL GAS⸻
🧩 1. Chart Overview
• Instrument: Natural Gas (XNG/USD)
• Timeframe: 1D (Daily)
• Main Concept: Elliott Wave + Demand Zone + Structure Confirmation
• Bias: Bullish — expecting a reversal from the demand zone and a major upward move (Wave (C)).
⸻
⚙ 2. Elliott Wave Structure Breakdown
You’ve labeled a large corrective pattern (A–B–C) on the chart.
🔸 Wave (A)
• The first upward impulse from the 2024 lows — subdivided into five smaller waves (1–2–3–4–5).
• This forms the initial bullish leg.
🔸 Wave (B)
• A corrective phase following (A), consisting of A–B–C down.
• This correction brought price back into the DEMAND ZONE, indicating a retest of key accumulation support.
🔸 Wave (C)
• The next bullish impulse is now expected to begin.
• Your chart projects Wave (C) heading sharply higher — targets between 4.2 – 5.2 USD.
⸻
🧭 3. Key Technical Zones
🟩 Demand Zone (Main Accumulation Area)
• Price range roughly: 2.90 – 3.50 USD
• This area has acted as strong support multiple times.
• Buyers are expected to defend this zone again before a large reversal.
🔳 Invalidation Point
• Near 2.60 USD — marked at the bottom.
• If price falls below 2.60, the bullish count is invalidated (Elliott rule violation).
🟧 Buy Trigger / Confirmation
• “BUY ABOVE” is noted near 3.40 – 3.50 USD.
• Indicates confirmation when the market breaks above short-term resistance (end of subwave 2), confirming that Wave 3 of (C) has started.
⸻
⚡ 4. Pattern: Expanding Wedge / Ending Diagonal
• The previous rally (marked “Expandable Wedge” or “Ending Diagonal”) indicates exhaustion of a prior uptrend.
• After such a wedge pattern, a deep correction usually follows — which fits your Wave (B) perfectly.
• Now, the pattern suggests that the correction is complete and accumulation is forming for the next impulse.
⸻
📈 5. Expected Price Path (Projection)
1. Current Zone (Demand) → small consolidation.
2. Breakout above 3.4–3.5 → confirms bullish momentum.
3. Targets for Wave (C):
• 1st Target: 4.21 USD
• 2nd Target: 4.92 USD
• 3rd Target (max extension): 5.50 USD
This projection assumes Wave (C) = Wave (A) in length (Elliott symmetry principle).

LNG Week 44: 80 BCF Storage Gain as Demand Edges Supply*Due to the platform's features, the charts are arranged in sequence from left to right, from the first to the Eighth chart. The charts were created by our team and based on an analysis from Bloomberg and the EIA data. This analysis was conducted in cooperation with Anastasia Volkova, analyst of LSE.
Current prices compared to price dispersion 10 days before expiration, by month since 2010
The expiration of the NGX25 contract was above the median according to data from 2010. Quotations for December and winter contracts for 2026 support growth and remain above the upper limit of the interquartile range.
Forward curve compared to 2020-2025
The shape of the forward curve in 2025 shows a steady convergence and is even closer to the configurations recorded in 2023 and 2024 for comparable dates. This trend is particularly evident in contracts with delivery in three years or more, where prices are steadily converging towards historical levels.
Current stocks and forecast for next week compared to 2019-2024
According to the forecast for week 43 (October 20-26), gas reserves in underground storage facilities will increase by +80 BCF, which is slightly above the average of +78 BCF for the past 5 years.
15-day sliding sum HDD+CDD based on current NOAA data and forecast for the next two weeks compared to 1994-2024
The current values of HDD+CDD accumulated over 15 days are in the average range for 1994–2024. The forecast for the coming week suggests that the values will exceed the average by 15–20 points, but in two weeks, there will be a trend toward returning to the average and below.
Accumulated HDD+CDD for 15 days based on current NOAA data and forecast compared to 1994-2024 by region
The current values of HDD+CDD accumulated over 15 days remain within the average range for 1994–2024. The forecast for the next two weeks suggests a return to the average weather trend in all regions.
Weekly total supply/demand difference compared to 2014-2024
This week, the difference between supply and demand in 2025 rose above the average values for 2014–2024, indicating that demand is growing faster than supply.
Number of days for delivery from warehouses
The graph shows the number of days of supply from storage facilities alone, based on current consumption levels. At the end of October 2025, reserves will last for approximately 34 days, which is below the lower limit of the interquartile range. With such a moderately reduced level of reserves, even minor disruptions in production or spikes in demand could cause sharp price reactions, especially in late winter and early spring.
Anomalies in weather (HDD+CDD) and fundamental factors
Overall, fundamental and weather factors are within the expected range, except for continued growth in consumption in the residential and commercial sectors caused by the start of the heating season. However, there has been no significant cooling at the start of the heating season so far.

Natural Gas - Did You Profit?Today natural gas saw some downside pressure.
We closed our KOLD long - which was our short trade on Nat Gas, netting over 8% gain.
Being nimble in the Nat gas market is key, as its a very choppy asset and gains can be lost very quickly.
Breaking below the 7 day MA needs to be watched closely as it does leave room for more downside.
Inventories lately have been lack luster and need to show some positivity before price start to gravity to the weekly trend.

Natural gas - Target downsideNatural gas continue its down trend and meet the lower target as published

NATGAS Short (A+)Natgas has touched the supply zone within the channel, in a longterm down trend. This provides a great opportunity to sell at the premium price range with a 1R sell market order, and 2R sell limit if it provides a reentry from a higher price.
Technical analysis aligns well with fundamental analysis for positive PMI news on Friday.
Natural Gas - Horrific Inventory ReportToday Nat gas showed a greater than expected build in inventories.
The consensus was 78B vs 87B actual.
Nat Gas has now triggered a bearish hourly pattern that takes us lower. If we lose the 3.60 area you can be sure we are likely going to target the gap fill.
I'm watching for Natural gas to potentially end the week with a weekly topping tail.
This colder weather report could be a fakeout pump to shakeout shorts.

LNG Week 43: 92 BCF Storage Surge Signals Weather-Driven Shift*Due to the platform's features, the charts are arranged in sequence from left to right, from the first to the Eighth chart. The charts were created by our team and based on an analysis from Bloomberg and the EIA data. This analysis was conducted in cooperation with Anastasia Volkova, analyst of LSE.
The natural gas market enters Week 43 with a robust storage uplift, as reserves are projected to rise 92 BCF during Week 42 (October 13-20), hitting 3,813 BCF-53 BCF above last year and well above the 5-year median of 74 BCF. The NGX25 contract swings to the upper end of the interquartile range with heightened volatility, while 2026 winter contracts stay above the range, fueled by growth momentum. Weather shifts, with HDD+CDD nearing 30-year averages and a 15-20 point uptick forecast, hint at rising demand. We analyze these trends below.
Current prices compared to price dispersion 10 days before expiration, by month since 2010
The NGX25 contract changed direction and is trading at the upper end of the IQR 10 days before expiration, demonstrating increased volatility. Quotes for 2026 winter contracts supported growth and remain above the upper limit of the interquartile range.
Forward curve compared to 2020-2025
The shape of the forward curve in 2025 shows a steady convergence and is even closer to the configurations recorded in 2023 and 2024 for comparable dates. This trend is particularly evident in contracts with delivery in three years or more, where prices are steadily converging towards historical levels.
Current stocks and forecast for next week compared to 2019-2024
According to the forecast for week 42 (October 13-20), gas reserves in underground storage facilities will increase by +92 BCF, reaching 3,813 BCF, which is 53 BCF higher than the figure for the same period last year. Last week's inventory growth was supported by high production volumes and mild weather conditions.
15-day sliding sum HDD+CDD based on current NOAA data and forecast for the next two weeks compared to 1994-2024
The current values of HDD+CDD accumulated over 15 days have reached the average range for 1994–2024. The forecast for the next two weeks suggests that the values will exceed the average by 15–20 points, which may be a significant driver of growth in the near-term contract.
Accumulated HDD+CDD for 15 days based on current NOAA data and forecast compared to 1994-2024 by region
The current values of HDD+CDD accumulated over 15 days are within the average range for 1994–2024. The forecast for the next two weeks suggests a departure from the current mild weather trend in all regions except WS CENTRAL, WN CENTRAL, MOUNTAIN, and PACIFIC.
Weekly total supply/demand difference compared to 2014-2024
This week, the difference between supply and demand in 2025 continues to be below the average values for 2014–2024, indicating weaker demand or excess supply.
Number of days for delivery from warehouses
The graph shows the number of days of supply from storage alone, based on current consumption levels. In the second half of October 2025, reserves will last for approximately 35 days, which is below the lower limit of the interquartile range. With such moderate reserves, even minor disruptions in production or spikes in demand could cause sharp price reactions, especially in late winter and early spring.
Anomalies in weather (HDD+CDD) and fundamental factors
Overall, fundamental factors and weather anomalies are within the expected range, with the exception of consumption in the residential and commercial sectors, caused by the start of the heating season.