LNG: Conditions Reached 30Y Median & Moderate Storage IncreaseThis LNG analysis was prepared by Dr. Igor Isaev in cooperation with Anastasia Volkova, LSE analyst.
Current prices vs. price spread 10 days before expiry by month since 2010
Total monthly price decline exceeded 17%. Near-term contracts NGU25, NGV25 are trading 3-5% below the average price 10 days prior to expiration for all expired contracts over the previous 15 years. NGX25 has reached the median. Prices of 2026 and 2027 contracts are also declining and are already trading at or below the upper quantile boundary for almost all months.
Forward curve vs. 2020-2024
The shape of the forward curve flattens out and comes closer and closer to the states of the curve on the same calendar day of the year as the curves of 2023, 2024. This is especially noticeable on contracts with delivery in 3 years and beyond. On contracts closer the divergence is still large.
Current inventory and forecast for next week compared to 2019-2024
For week 33 (Aug 11-17), we expect a +14BCF gain in storage. Fill rates are holding steady above the median for the previous 5 years. Injection rates remain positive, which reduces shortage risks and contributes to downward price pressure.
Weekly HDD+CDD total from current NOAA data and forecast for the next two weeks comparing 1994-2024
In a continental cross-section, the current week 34 weather is holding at the same level as the average values observed over the past 30 years. Next week (35), HDD+CDD values are forecast to be well below average, contributing to lower air conditioning electricity demand and downward price pressure.
Explanation of the chart: in candlesticks quantiles for 30 years from 1994 to 2024. Red dots 2024, green 2025, blue prediction 2025
Weekly HDD+CDD total from current NOAA data and forecast for the next two weeks compared to 1994-2024 by region
Forecasts by major regions are consistent with the overall picture. Temperatures are expected to be slightly above normal in week 34 in the Eastern, Western regions followed by a decrease in week 35. In the PACIFIC region, values remain high. On the contrary, the Atlantic regions are below normal.
Weekly cumulative supply/demand difference compared to 2014-2024
For the past 2 weeks, the supply/demand differential has held well above the upper 10-year range. Despite record production levels, total natural gas consumption also increased due to electricity demand, the industrial sector and LNG exports.
Trade ideas
Buy the dip on natural gas For a swing trade Natural gas seems very you know touching the most happening support line and it might bounce back from 2.7 to 3.8 a very good you know you can capture to make money thank you so much for watching it's not investment advice

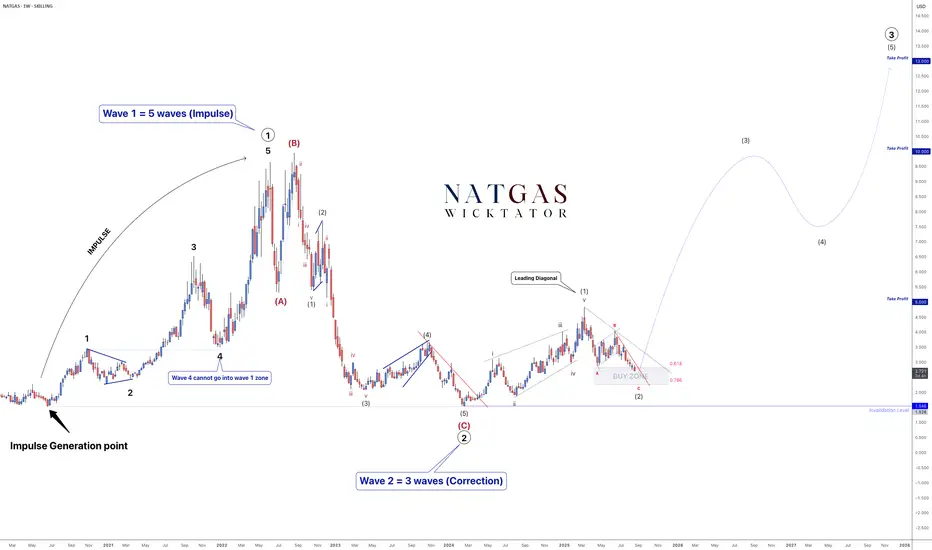
NATGAS - Catch The Impulse!As Wave Traders, our job is to spot corrections and catch the impulse, because that’s where the biggest moves happen.
On NATGAS, we completed Wave 1 with a leading diagonal, and are now finishing Wave 2 (an ABC correction). Once corrections are done, the next phase is Wave 3 - historically the longest and strongest wave in Elliott Wave Theory.
We've almost completed wave 2 and looking for a breakout for wave 3, which is the longest wave.
Trade Idea:
- Watch for break of the red trendline to indicate the start of wave 3
- enter with stops below breakout or below invalidation
- Targets: 5, 10, 13
NATGAS 12H Chart:
We'll be looking to enter on break of the red trendline with stops below breakout.
This setup is a textbook example of how Elliott Wave helps us prepare - not chase - the market.
Goodluck and as always, trade safe!
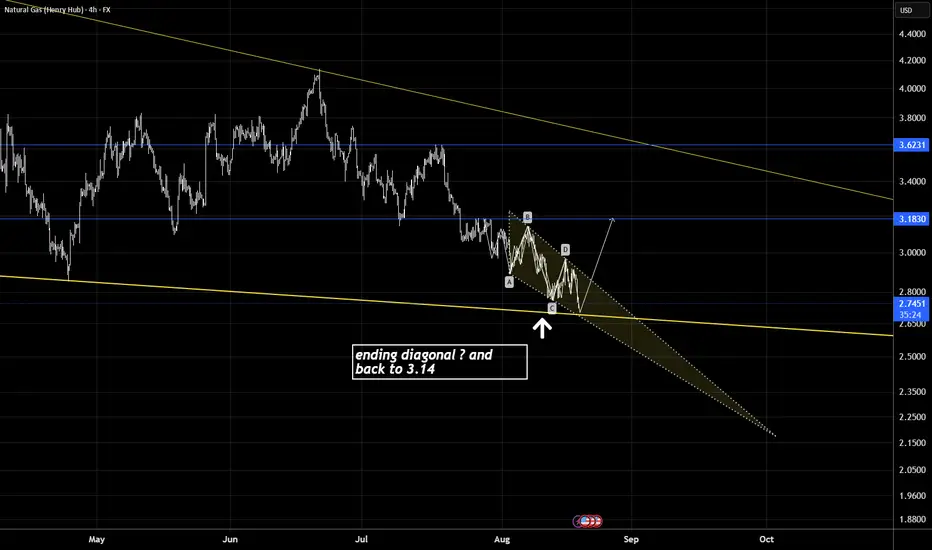
ending diagonal in nat gas... and back to 3.14? Looks like an ending diagonal almost finishing up or possibly has finished ? .... lets see if we get a hard rally back to 3.14 .
Natural Gas (Spot)Bullish Butterfly has formed in ng spot, target in charts. I am not sebi registered analyst and its not buy, sell and hold recommendation.

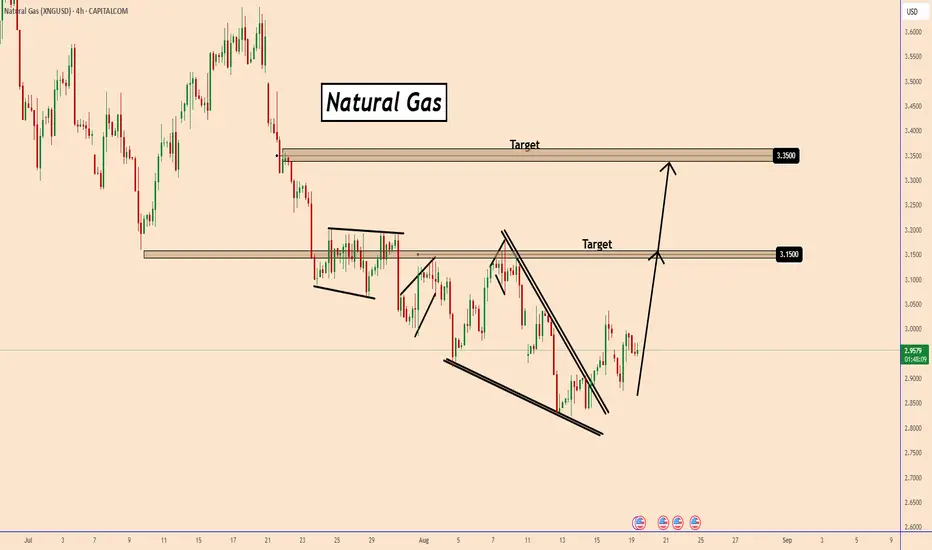
Natural Gas Breaks Out Again-Bullish Wedge in PlayNatural Gas Breaks Out Again – Bullish Wedge in Play
Natural gas has confirmed another bullish wedge pattern, after a period of unclear price direction.
For now, the price looks set to climb toward $3.15 and $3.35.
However, traders should stay cautious.
Ongoing peace talks between the U.S., Russia, and Ukraine could shift momentum quickly—either way.
From a technical perspective, the setup remains bullish.
You may find more details in the chart!
Thank you and Good Luck!
PS: Please support with a like or comment if you find this analysis useful for your trading day
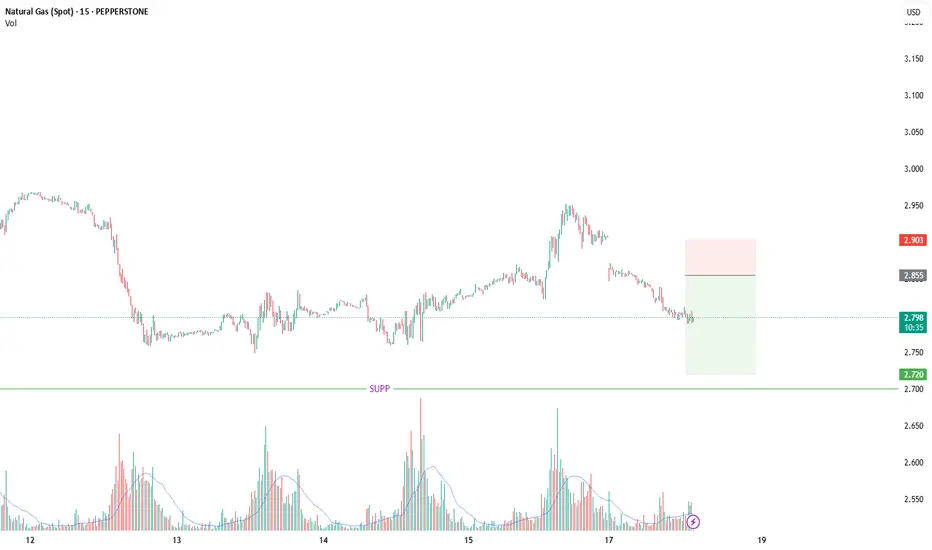
Monday movefirdays bullish move clearly failed as the volume was drying out. The move was clearly news driven as Ukraine had blown a Russian refinery. The move still remains bearish i believe 2.72 is likely where the next stop is for today.
XNGUSD came to a global support lineXNGUSD came to a global support line
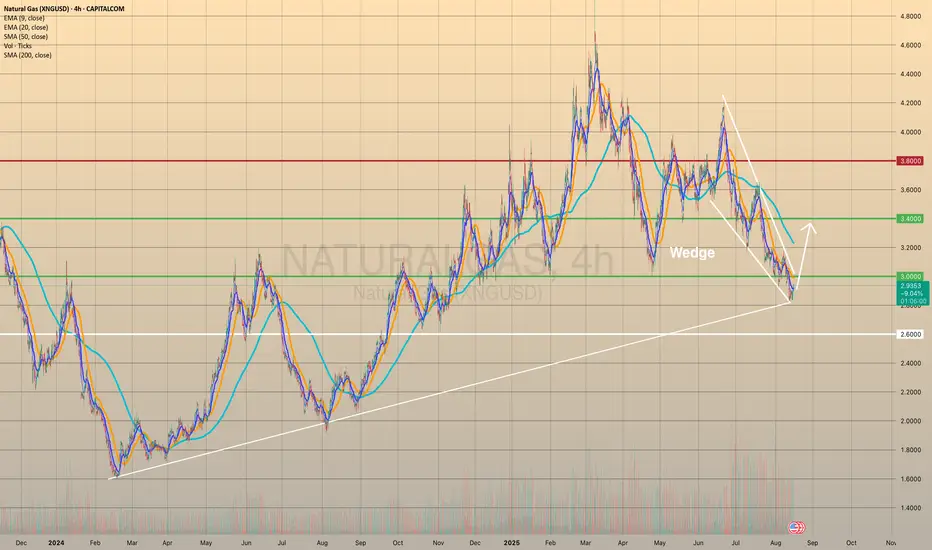
Natural Gas has been declining since the beginning of June, forming the falling wedge. On Tuesday the price found support on a global trendline. The price is ready to reverse. Additionally, seasonals notice that shoulder season is about to get started, which historically means buying pressure for the natural gas, due to more natural gas is purchased before winter comes. Mid-term target may be the 3.4000 level.
thurs mani-POO-lationthe market always ranges before news. high probability that there will be a bullish breakout and the selloff will continue. the report last week was bullish but sellers still outweighed the bulls. this time i bet it will be no different despite the hot weather. its going to test the supp at $2.7 but it might break and continue till $2.6

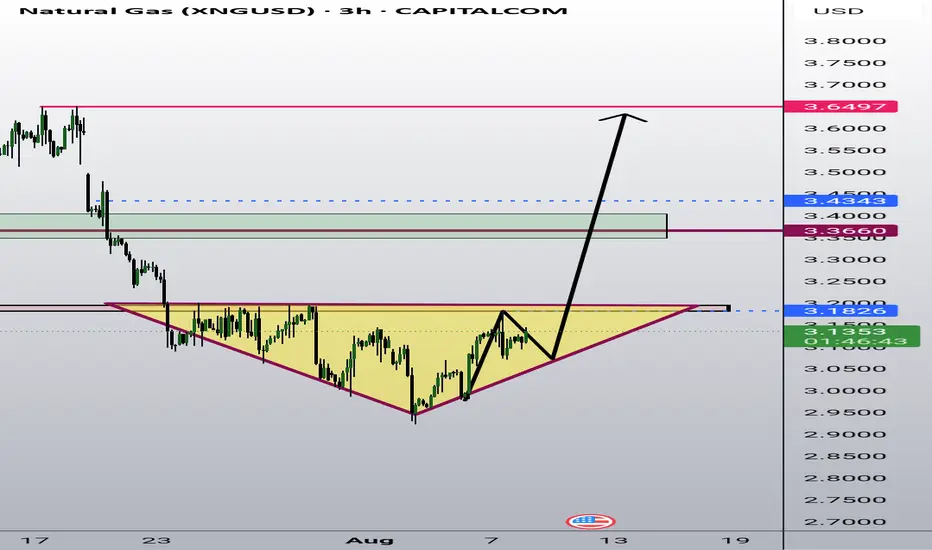
Natural Gas consolidates nearby support level of 3.0000Natural Gas consolidates nearby support level of 3.0000
U.S. Natural Gas has been declining since mid-June, forming the bullish wedge. Since the end of July 4-h RSI shows us bullish divergence, the price consolidates nearby the 3.0000 support level. The price is expected to rise towards 3.4000 level as a first target with 3.6000 as a final target. Additionally, according to seasonals, since the second half of the august, natural gas prices go bullish due to the beginning of the shoulder season, which may be an extra support factor for the asset.

Long for short-coverMight have bottomed out finally. I think this might be one in a million chance to come out true but i believe that this setup has got a high probability. I can be wrong.. if so then i still have more to learn in order to actually trade this instrument but, if this runs with success then ill let you know behind my reasonings.

NATGAS: When Triangles Go FlatGAZ is acting up again! Had to bail and re-enter. Just playing the trend and indicators.
Instead of forming a clean wedge, it’s just chopping sideways now. Though the wedge pattern could still play out.
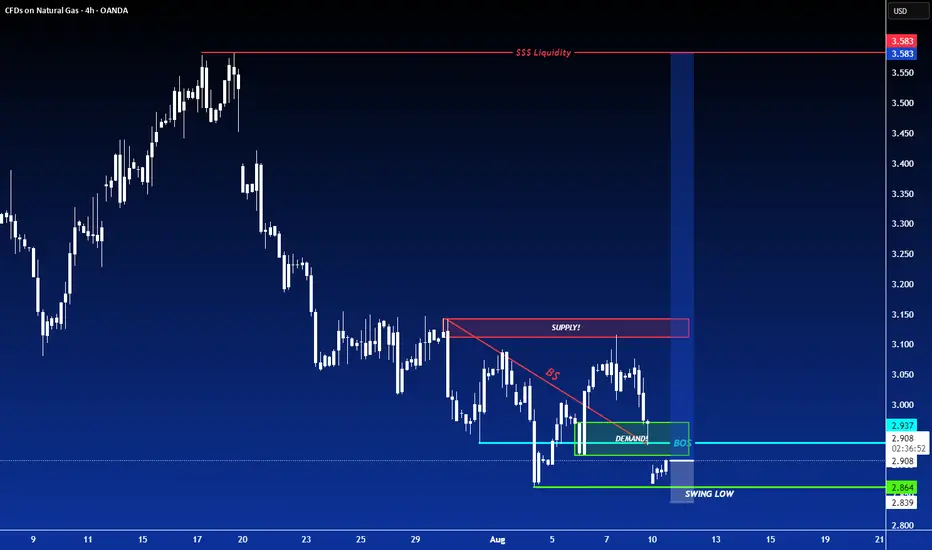
LONG ON NATURAL GASNatural gas has given us a nice CHOC (change of character) to the upside to start a upward move from a major demand zone.
I will be buying natural gas to the next level of supply.
Natural Gas is in the Buying DirectionHello Traders
In This Chart NATGAS HOURLY Forex Forecast By FOREX PLANET
today NATGAS analysis 👆
🟢This Chart includes_ (NATGAS market update)
🟢What is The Next Opportunity on NATGAS Market
🟢how to Enter to the Valid Entry With Assurance Profit
This CHART is For Trader's that Want to Improve Their Technical Analysis Skills and Their Trading By Understanding How To Analyze The Market Using Multiple Timeframes and Understanding The Bigger Picture on the Charts

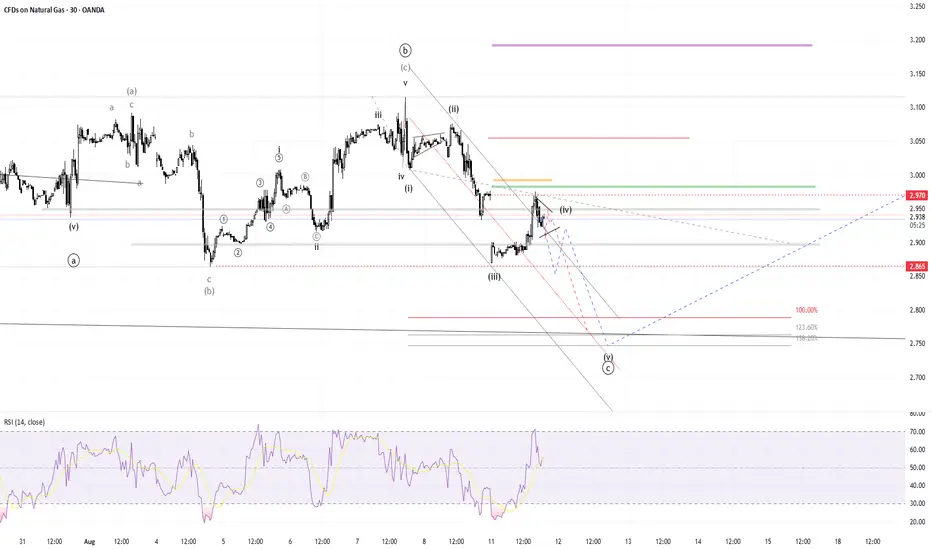
NATGAS TRADING PLANSlowly, very slowly, I'm transitioning from trading based on waves to trading waves through the filter of key levels and trend-moving averages.
Levels make me see scenarios that I used to ignore before.
Also, very slowly, I'm letting go of the habit of holding positions for too long.
Key levels for the next week are as follows:
Colored levels are a given. They act as magnets but also confirm the direction if the price continues pushing downward from the moving averages.
They will serve as confirmation of a trend reversal if the price breaks upward, retraces, and bounces off the levels and moving averages.
Such a filter + rules and avoiding tilt will ensure a return to profitable trading.

"NATURAL GAS PRICE THEFT IN PROGRESS – JOIN THE HEIST!"🔥 XNG/USD HEIST – BEARISH LOOT AWAITS! SWIPE & ESCAPE BEFORE THE COPS ARRIVE! 🔥
🌍 Greetings, Fellow Market Robbers! (Hola! Oi! Bonjour! Hallo! Marhaba!) 🚔💸
🚨 Mission Briefing:
Based on 🔥Thief Trading Intelligence™🔥, we’ve identified a prime robbery opportunity in the XNG/USD (Natural Gas) Energy Market. Our Bearish Heist Plan is locked & loaded—long entries are a trap, and the real loot lies in the downside escape.
🎯 Heist Strategy:
Entry (Swipe the Loot!) 🏦
"The vault is cracked! Bears are distracted—time to steal!"
Sell Limit Orders preferred (15m-30m pullback entries).
DCA/Layering Strategy for maximum loot efficiency.
Stop Loss (Escape Route) 🚨
SL at nearest swing high (4H basis) – 3.480 (Day/Swing Trade)
Adjust based on risk tolerance, lot size, & number of orders.
Target (Police Evasion Zone) 🎯 2.900 (or earlier if cops close in!)
🔪 Scalpers’ Quick Heist:
Short-side scalp ONLY!
Big money? Go direct. Small stack? Join the swing robbers.
Trailing SL = Your Getaway Car! 🚗💨
⚡ Why This Heist? (Bearish Forces at Play)
Fundamentals: Oversupply, weak demand, storage glut.
Technicals: Overbought, trend exhaustion, reversal signals.
Sentiment: Bulls are overconfident—perfect trap setup!
📰 Breaking News Alert (Stay Sharp!)
High-impact news = Volatility spikes!
Avoid new trades during releases.
Trailing SL = Your Shield. (Lock profits before the cops raid!)
💥 BOOST THIS HEIST!
👉 Hit LIKE & FOLLOW to fuel our next robbery! More loot = More strategies! 🚀💰
⚠️ WARNING (Legal Escape Plan):
Not financial advice!
Your risk, your loot.
Markets change—adapt or get caught!
🤑 NEXT HEIST COMING SOON… STAY TUNED, ROBBERS! 🐱👤🔥

Natural gas BUY at supportNatural gas is at a support level. BUY for target back up to the 3.80 range

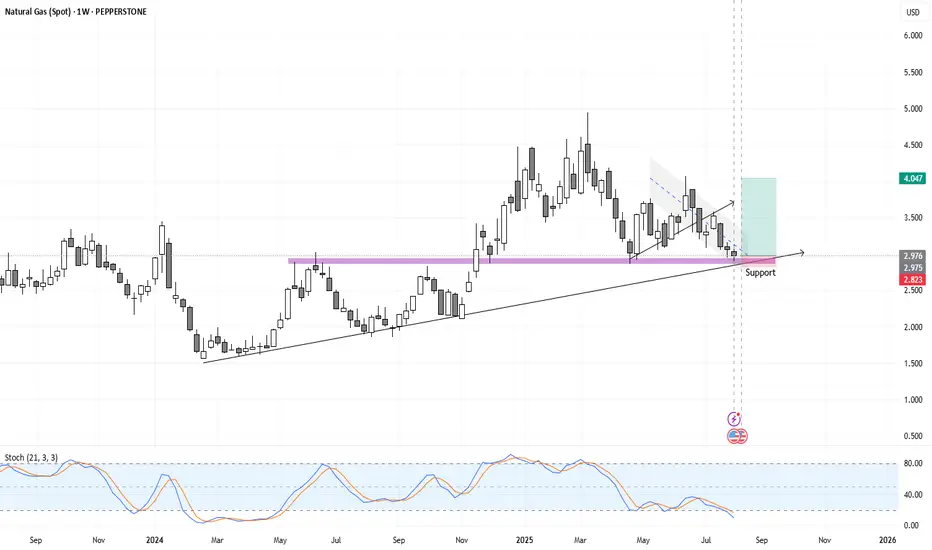
NATGASThis weekly chart of Natural Gas (Spot) shows the price currently trading around 2.976 USD, sitting directly on a long-term ascending trendline and a horizontal support zone near 2.82–2.85 USD. The support has been tested multiple times in the past, reinforcing its importance as a key demand area. The stochastic oscillator at the bottom is deep in the oversold region, hinting at potential reversal conditions.
The recent candles show a downtrend channel that has just been broken to the upside, suggesting the possibility of a trend change. A highlighted green box indicates the potential upside target area around 4.04 USD if the rebound from support continues. This aligns with a technical bounce expectation after prolonged downside pressure.
Overall, the chart implies a bullish short-to-medium-term outlook if the support holds. A break below the ascending trendline would invalidate this scenario and could trigger deeper declines. However, with strong confluence of trendline, horizontal support, and oversold momentum, the probability of an upward move appears favorable.
Natural Gas is getting ready for Spike moveFollowup for Prvious published idea 31 July
Natural Gas well fitted in Diamond pattern satisfied all its characteristics
Breakout can happen by gapup opening on Monday
Now atleast for next all temperature are look positive
Natural Gas Shows Signs of Bullish Wave CompletionNatural Gas Shows Signs of Bullish Wave Completion
Natural gas is struggling to drop below 2.92, which could mean the current bullish wave is coming to an end.
Since NG is moving in a clear correction, we might be in the 5th wave—this could either be the start of a larger bullish move or part of a corrective pattern.
Looking at how the price has moved in the past, I believe it's more likely that a bullish wave is forming and could continue into next week.
For now, I’m watching two short-term targets at 3.23 and 3.37.
You may find more details in the chart!
Thank you and Good Luck!
PS: Please support with a like or comment if you find this analysis useful for your trading day

Natural Gas XNG: Trend Reversal or Just a Retracement?Natural Gas (XNG) has been trending bearish 🔻, but we’re now witnessing a bullish market structure shift ⚡— particularly visible on the 4H timeframe ⏱️. At present, price is overextended and pressing into a key resistance zone 📈🧱. I’m watching closely for a retracement back into equilibrium 🔄 within the previous price swing. This could offer a short-term scalp or day trade short setup 🎯.
Should price hold firm at support after the pullback 🛑, we could then begin building a bullish bias and look for long opportunities 📊— depending on how price action develops from there. 🚨 This is not financial advice.

U.S. Hot temperature boosted natural gas prices. For how long?U.S. Hot temperature boosted natural gas prices. For how long?
U.S. natural gas futures rose ~2% August 6 due to near-record LNG export flows and forecasts of hotter-than-normal weather through late August, boosting air conditioning demand and gas use by power plants (over 40% of U.S. electricity). Despite a hot summer, record production has kept gas stockpiles ~6% above normal, with storage likely to grow further.
Technically, price seems to form bullish wedge since mid - August. Price successfully tested the level of 3.0000, still can go on a retest of this level soon once again before some mid-term bullish momentum occurs. Additionally, according to seasonals, since the second half of the august, natural gas prices go bullish due to the beginning of the shoulder season.

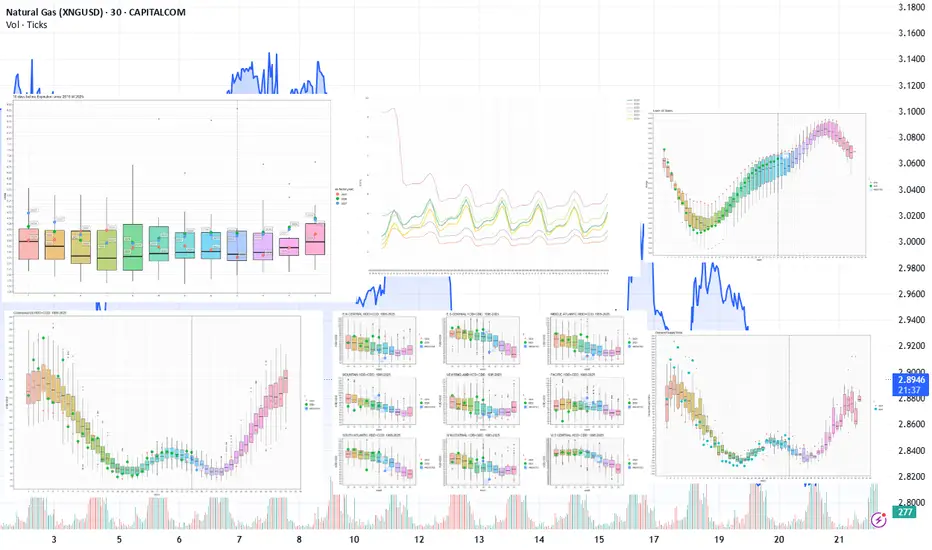
LNG Outlook: Supply-Demand Differential Dropped Below the MedianThis analysis was prepared by Dr. Igor Isaev in cooperation with Anastasia Volkova, LSE analyst.
Current prices vs. price spread 10 days before expiration by month since 2010
(The top left graph)
Contract U is trading at the same level as the average price 10 days before expiration for all expired contracts over the previous 15 years. The futures prices of the Fall 2025 contracts are trading even closer to the median values on the expiration date, while remaining within the interquartile range. Prices of the 2026 and 2027 Winter contracts are declining but have not yet broken through the upper quartile values.
Current forward curve vs. 2020-2024
(The top graph in the middle)
Although the 3-year delivery contract prices as of 2025 have approached the levels of similar 2023 and 2024 contracts, a pronounced forward curve skew remains in the near-term (1-2 years) and distant (5-6 years) delivery segments.
Current inventory and forecast for next week compared to 2019-2024
(The top right graph)
For week 31 (July 28 —August 03), we expect a +16 BCF gain in storage. The fill rate is confidently holding above the median for the preceding 5 years. Injection rates maintain positive dynamics. If the current supply and demand balance stabilizes, reaching levels similar to 2024 peak values is possible. The weather and seasonal phenomena of late summer — early fall remain a restraining factor.
Weekly HDD+CDD total from current NOAA data and forecast for the next two weeks comparing 1994-2024
(The lower left graph)
In the current, 32nd week, the weather is holding steady, reflecting the average values from observations over the past 30 years. Although the seasonal peak HDD+CDD has almost passed, next week (33) is forecast to have significantly above average HDD+CDD values.
Explanation of the chart: candles represent quantiles for 30 years from 1994 to 2024. Red dots 2024, green 2025, blue prediction 2025.
Weekly HDD+CDD total from current NOAA data and forecast for the next two weeks compared to 1994-2024 by region
(The lower graph in the middle)
Looking by region, we see elevated HDD+CDD at week 33 in almost all regions.
Weekly cumulative supply/demand differentials compared to 2014-2024
(The lower right graph)
In the current 32nd week, the supply-demand differential has fallen below the median, almost to the edge of the lower interquartile range. On the demand side, we see a strong decline in consumption by power generation and a recovery in LNG exports. On the supply side, production continues to grow, but imports from Canada have dropped.
