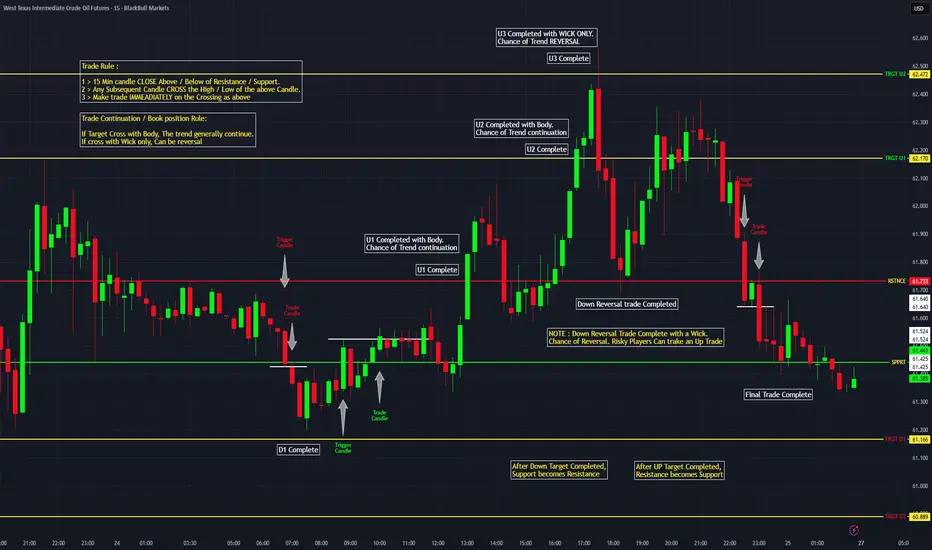
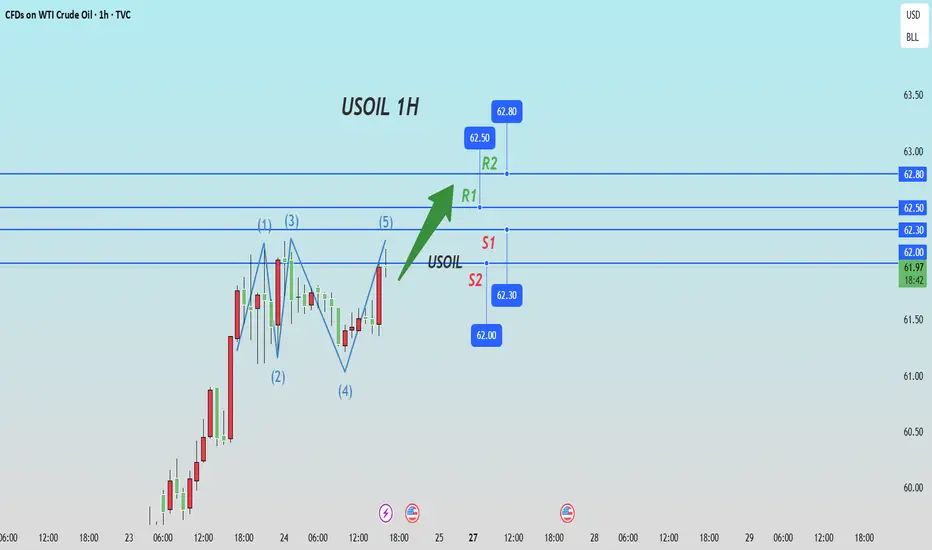
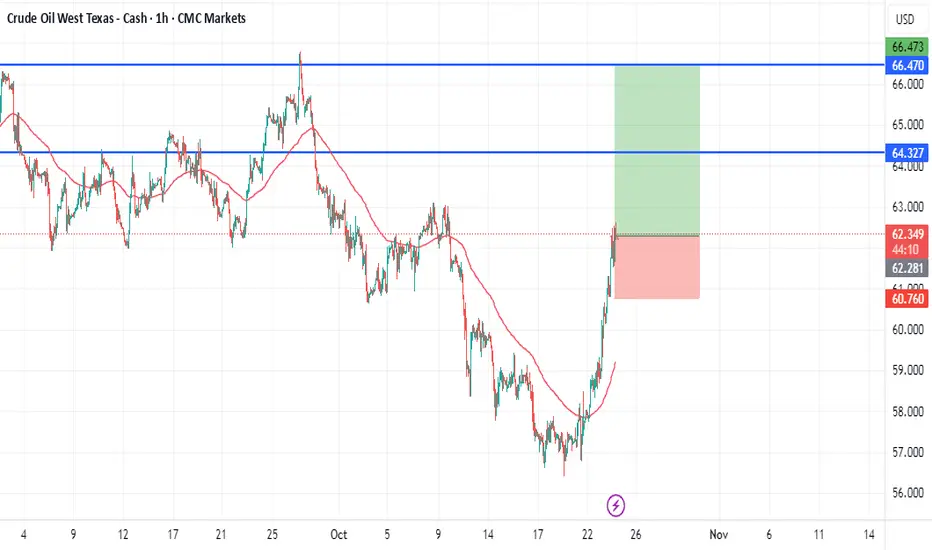
WTI Chart with Levels and all trade rules as an example.
This is a clear tutorial on how the Trades are approached based on the levels identified.
Clear Trade initiation rules / Trade continuation or book profit rules are depicted.
How the Reversal trade in instruments are also explained.
The comments are self explanatory and valid for all instruments
Trade ideas
Analysis of crude oil trend next week.I. Core fundamentals: The contradictory pattern of "short-term geo-political support and long-term oversupply pressure"
(1) Short-term support: Geopolitical sanctions trigger supply concerns (valid for 1-2 weeks)
The implementation of sanctions directly disrupts supply: On October 22, the United States and Europe simultaneously upgraded sanctions against Russia, including including Rosneft and Lukoil, which together account for 50% of Russia's crude oil exports. After the news was announced, major buyers such as India have postponed purchasing Russian oil and instead rushed to buy Middle Eastern crude oil, directly pushing the oil price up by 5% on October 24, from $58.5 to $61.76. The resumption of refinery operations brings a phased increase in demand: The seasonal maintenance of global refineries is coming to an end, and the resumption wave leads to an increase in crude oil purchases, coupled with the gradual start-up of heating oil demand in the Northern Hemisphere, creating a "small peak" in the short-term demand side, which supports the spot price.
(2) Medium- and long-term suppression: Oversupply is inevitable (suppressing force lasts for 3-6 months)
The OPEC+ production increase trend is irreversible: Since April 2025, when it shifted to the "increase production to secure market share" strategy, OPEC+ has cumulatively increased production by nearly 2.5 million barrels per day, and will continue to increase production by 137,000 barrels per day in November, with an additional daily supply of over 430,000 barrels in the fourth quarter. More importantly, Saudi Arabia's exports remain stable at 9 million barrels per day, and Iraq at 4 million barrels per day. The supply from the Middle East remains abundant, coupled with the expansion of production capacity in non-OPEC+ countries, the oversupply pressure further intensifies.
Weak demand + saturated inventory double blow: The IEA has continuously lowered its demand expectations for several consecutive months. It is expected that in 2026, global oversupply will reach 4 million barrels per day (accounting for 4% of global demand), and at the same time, the offshore storage volume has approached the level of the 2020 pandemic, while onshore inventories are approaching saturation. The near and far-month contracts of WTI crude oil in New York have experienced a 5-month-long first-time futures premium, which is the direct reaction of the market to the oversupply.
Crude Oil Trading Strategy for Next Week
usoil @buy 60.5-61.0
tp:62-62.5
SL:59.5

Analysis of Oil Prices Trend Next WeekI. First, understand: The "core issue" of oil prices next week, both rising and falling, have reasons for their movements.
Currently, the oil price stands at 61.41. It just experienced a 5% surge on Thursday, but the increase was "unsteady". The essence is that "short-term positive factors are supporting it, while long-term negative factors are pressing on it". Next week, it will be influenced by three key points:
1.Short-term positive factors: Geopolitical sanctions "just started", which can support the price.
The EU and the United States just issued new sanctions against Russia last week, directly targeting the energy industry. The two major Russian oil giants account for 50% of exports. The market is afraid of supply disruption, just like when the sanctions were implemented before, Indian buyers immediately suspended their purchases of Russian oil and turned to buy oil from the Middle East, and the spot price rose by 3% on the same day. In addition, US inventories have dropped by 960,000 barrels, and refinery operating rates have risen to 88.6%, indicating that "oil is used more than it is stored", and there will be no significant decline in the short term.
2.Long-term negative factors: Oil-producing countries "continuously increase production", and when it rises, it must be brought down.
OPEC+ will increase production by 137,000 barrels per day next week. This is the eighth consecutive increase. The cumulative increase is 2.5 million barrels per day, equivalent to the output of an additional small oil-producing country. More troublesome is that institutions predict that supply过剩 will reach 4 million barrels per day next year, equivalent to 4% of global demand. In the long term, oil prices will not rise at all, and may even fall to around 50 US dollars.
3.Market sentiment: "Retail investors are chasing the rise, while institutions are withdrawing their funds", the fluctuations will be significant.
Currently, 82% of traders are buying the rise, it looks very hot, but the long positions of institutions are decreasing - this is like "a group of people rushing forward, while the leader is quietly retreating". Reflected in the price is: when it hits above 62 US dollars, there are sell orders coming down, when it drops to 61, there are buy orders coming in, next week it is likely to swing back and forth between 60-63, it will not rise or fall in a single direction.
Crude Oil Trading Strategy for Next Week
usoil @buy 60.5-61.0
tp:62-62.5
SL:59.5
USOIL: Go long on pullbacksGeopolitical risks have dominated short-term market sentiment for crude oil. Investors' concerns about the supply side have overshadowed negative factors on the demand side, driving oil prices to rise consecutively. However, the weak global economy has dimmed the long-term demand outlook, limiting the extent of oil price increases, resulting in relatively complicated overall market sentiment.
From a technical indicator perspective, momentum indicators are showing positive signals, and the MACD is trending upward. This indicates that the bullish bias is strengthening, but a fully established uptrend has not yet formed.
Overall, technical indicators point to a certain bullish tendency, though it is also necessary to monitor the price performance at key resistance levels.
In the short term, focus on the resistance range of 63.5–64.5 on the upside and the support range of 60–61 on the downside. For intraday operations, the main strategy is to go long on pullbacks, with short positions on rebounds as a supplementary approach.
💎Trading Strategy:
Buy 61.8 SL 62.4 TP 61.1
Daily-updated accurate signals are at your disposal. If you run into any problems while trading, these signals serve as a reliable reference—don’t hesitate to use them! I truly hope they bring you significant assistance
US OIL SUPPORT, RESISTANCE & TRENDLINE ANALYSISMy final levels for the last day.
Go "LONG" if it breaks 62.18 and if it also breaks the trendline then can move up till 62.59 and breaking that might lead to 63.01.
Go "SHORT" if it breaks 61.77 along with the trendline leading to 61.35 and if it breaks that then aim for 60.94 and lastly if it breaks that as well by EOD then 60.46 should be our target.
Happy Weekend!!

USOIL: Waiting for price to react to 4h resistance
* Trend: assessed using at least three trend indicators, with market structure as the primary guide.
** Weak or Reversal Signals: Assessed based on one of our criteria for trend reversal signals.
*** Support/Resistance: Selected from multiple factors – static (Swing High, Swing Low, etc.), dynamic (EMA, MA, etc.), psychological (Fibonacci, RSI, etc.) – and determined based on the trader’s discretion.
**** Our advice takes into account all factors, including both fundamental and technical analysis. It is not intended as a profit target. We hope it can serve as a reference to help you trade more effectively. This advice is for informational purposes only and we assume no responsibility for any trading results based on it.
George Vann @ ZuperView
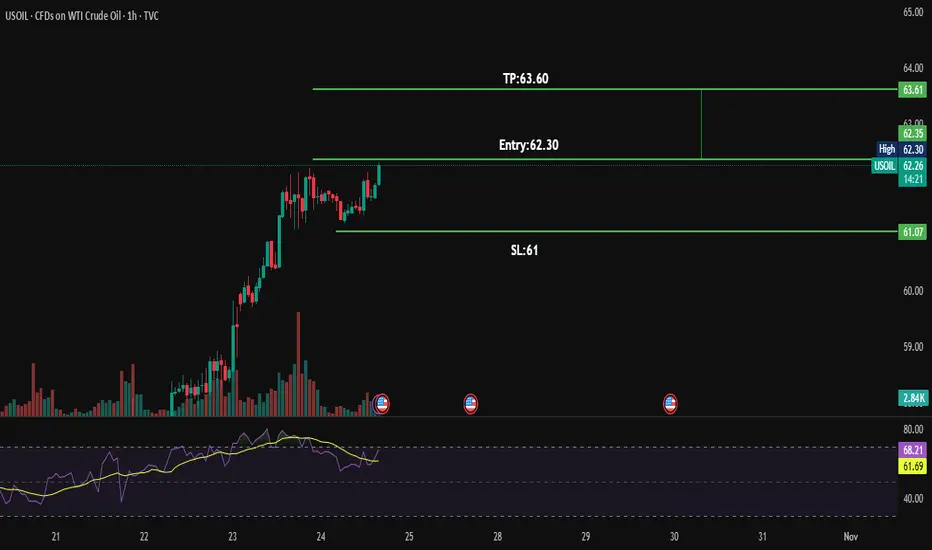
USOILUSOIL 1hr TF trade plan
🔹 5. Trading Logic
✅ Buy Entry at 62.30
👉 You enter when the breakout is confirmed.
✅ SL at 61.00
👉 If the price drops below 61, the breakout fails — exit trade.
✅ TP at 63.60
👉 Expected target area where previous selling pressure could appear.
USOIL BULLS ARE STRONG HERE|LONG
USOIL SIGNAL
Trade Direction: short
Entry Level: 57.23
Target Level: 59.72
Stop Loss: 55.57
RISK PROFILE
Risk level: medium
Suggested risk: 1%
Timeframe: 12h
Disclosure: I am part of Trade Nation's Influencer program and receive a monthly fee for using their TradingView charts in my analysis.
✅LIKE AND COMMENT MY IDEAS✅

Where Does the Short-Term Confidence for Going Long Come From?Geopolitical Conflicts "Continue to Drive Momentum" – Supply Worries Persist
The U.S. has just imposed sanctions on two major Russian oil giants, which account for 50% of Russia’s crude oil exports. This could mean a daily reduction of 1.5 million barrels in global supply, and the market is worried about "insufficient oil". A prime example: when Ukrainian forces attacked Russian refineries earlier, daily exports dropped by 1 million barrels, and oil prices rose 2% the same day. Now, such sanctions are still escalating, which will firmly support oil prices in the short term and prevent a sharp decline.
Demand Data Offers "Genuine" Positives – Strong Floor Support
U.S. crude oil inventories have decreased by 960,000 barrels, and refinery utilization rate has risen to 88.6% – this clearly shows "more oil is being consumed than produced", so the current price increase is not unfounded. Meanwhile, China’s refinery utilization rate has also climbed from 86% to 88%, and there is a requirement to ensure refined oil supply in the fourth quarter. This means demand for crude oil will only increase, not decrease, adding a "safety cushion" for long positions. Even if there is a short-term pullback, the decline will be very limited.
Crude Oil Trading Strategy for Today
usoil @buy 62.0-62.3
tp:62.5-62.8
sl:61.8
Can WTI’s 8% Rally Hold After Trump-Putin Summit Collapse?WTI just staged its biggest two-day rally since June, as hopes for a Trump-Putin summit were dashed, leading to new US sanctions on Russian oil exports.
Here’s what’s fuelling the move and what traders should watch next:
- US sanctions on Russia’s top oil producers after failed Budapest summit trigger supply fears and spike prices
- Trump escalates rhetoric to maintain leverage as Zelensky signs military deals with Sweden, raising geopolitical stakes
- WTI reclaims key $61 resistance, with daily RSI momentum signalling room to run and a possible cup & handle breakout toward $68
- Supply glitch fears (India, OPEC’s slow reaction) and technicals all support continued upside if the current environment holds
Watch for buy the dip signals, respect $61 support, and target the $65–68 channel top if current drivers persist.
Stay tuned!
This content is not directed to residents of the EU or UK. Any opinions, news, research, analyses, prices or other information contained on this website is provided as general market commentary and does not constitute investment advice. ThinkMarkets will not accept liability for any loss or damage including, without limitation, to any loss of profit which may arise directly or indirectly from use of or reliance on such information.

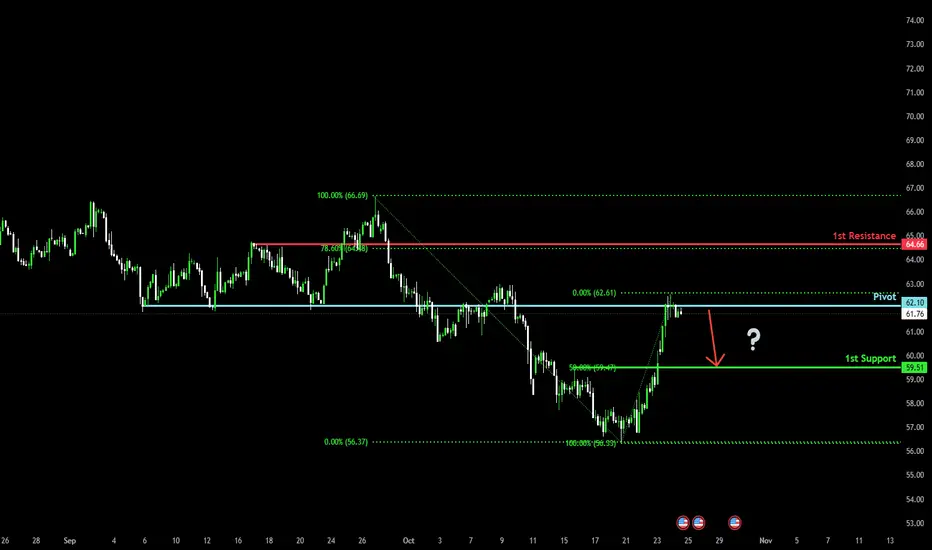
Bearish reversal off overlap resistance?WTI Oil (XTI/USD) is reacting off the pivot whic acts as an overlap resistance and could drop to the 50% Fibonacci support.
Pivot: 62.10
1st Support: 59.51
1st Resistance: 64.66
Disclaimer:
The above opinions given constitute general market commentary, and do not constitute the opinion or advice of IC Markets or any form of personal or investment advice.
Any opinions, news, research, analyses, prices, other information, or links to third-party sites contained on this website are provided on an "as-is" basis, are intended only to be informative, is not an advice nor a recommendation, nor research, or a record of our trading prices, or an offer of, or solicitation for a transaction in any financial instrument and thus should not be treated as such. The information provided does not involve any specific investment objectives, financial situation and needs of any specific person who may receive it. Please be aware, that past performance is not a reliable indicator of future performance and/or results. Past Performance or Forward-looking scenarios based upon the reasonable beliefs of the third-party provider are not a guarantee of future performance. Actual results may differ materially from those anticipated in forward-looking or past performance statements. IC Markets makes no representation or warranty and assumes no liability as to the accuracy or completeness of the information provided, nor any loss arising from any investment based on a recommendation, forecast or any information supplied by any third-party.
Today's crude oil trading strategyDon't be intimidated by "mid-term supply pressure", as the risks are manageable when going long.
1. Geopolitical Conflicts "Keep Adding Fuel" – Supply Worries Persist
The U.S. has just escalated sanctions on Russia and imposed restrictions on Venezuela’s crude oil exports, which directly cuts off part of the global supply. For context: When Ukrainian forces attacked Russian ports earlier, Russia’s daily crude exports dropped by 2 million barrels, and oil prices jumped 3% in a single day. Now, sanctions like these will only make the market more anxious about "insufficient oil supply," which will keep prices supported in the short term.
2. Inventory Data Offers "Genuine" Positives – Demand Provides a Safety Net
U.S. crude oil inventories have fallen for two consecutive weeks, with a further drop of 1.8 million barrels in the latest week. This clearly shows "more oil is being used than produced" – the current price gains aren’t unfounded. Additionally, China’s refinery utilization rate has risen from 86% to 88%, and there’s a requirement to ensure refined oil supply in the fourth quarter. This means demand for crude oil will only increase, adding an extra "safety cushion" for long positions.
Crude Oil Trading Strategy for Today
usoil @buy60.80-61.0
tp:61.5-62
sl:60

USOIL – Short Setup Forming at 4H Supply ZoneAfter a strong bullish recovery from the $56.00 demand zone, WTI Crude Oil has now reached a key 4H supply area (61.80–62.60).
This zone aligns with previous structural resistance and an unmitigated imbalance, making it a potential reversal point.
The recent impulsive rally could now face profit-taking or seller re-entry, especially after such a sharp single-leg move.
📉 Technical Breakdown
Supply Zone: 61.80–62.60, aligning with a previous major breakdown area.
Liquidity Context: Price may have swept buy-side liquidity above short-term highs to fill the imbalance and tap into supply.
Momentum Shift: Bullish momentum appears to be slowing; watch for bearish rejection candles or break of minor structure to confirm entry.
Market Structure: The overall 4H structure remains bearish, so this move could be a retracement leg within a broader downtrend.
💡 Trade Plan
Entry Zone: 61.80 – 62.50 (inside 4H supply area)
Stop-Loss: Above 62.60 (structure invalidation)
Take-Profit Targets:
🎯 TP1: 59.00 (intraday support)
🎯 TP2: 56.00 (major demand zone)
🧠 Bias & Outlook
Bearish short-term, expecting rejection from 4H supply and potential continuation to the downside.
A clean break and close above 62.60 would invalidate this setup and suggest further bullish continuation.
🧩 Summary
WTI is testing a high-probability supply zone after an extended bullish impulse.
Signs of exhaustion and liquidity sweep hint at a potential short opportunity targeting 59.00–56.00.
Waiting for confirmation before entry provides the safest positioning.
Disclaimer:
This analysis is for educational purposes only — not financial advice. Trade at your own risk and confirm setups with your personal strategy.

USOILIF OIL bull can break and close 65$ level than oil could rise into 70-75k from the projection.
#usoil #wti

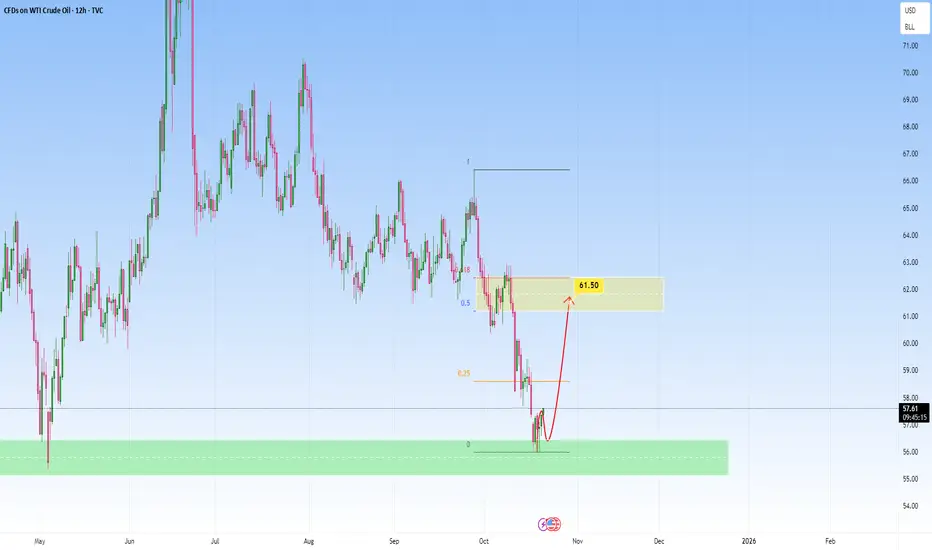
Oil: Key Fibonacci Zone to watch forPrice has been in a clear downtrend, with sellers firmly in control, driving a series of lower lows and lower highs. However, after a strong bearish leg, momentum began to slow, candles started showing long wicks and smaller bodies, signaling that selling pressure might be fading.
If price continues upward, the $61.50 region becomes a crucial zone. A strong rejection from there would confirm that sellers are reloading for another push down.
In short, this is a Fibonacci retracement move within a broader downtrend.
Crude oil shows an optimistic upward trend📈The situation of crude oil is relatively optimistic, showing an upward trend, mainly affected by geopolitics and supply-demand relationships.
💡Geopolitical factors:
The United States has imposed sanctions on Russian oil companies, and the European Union's sanctions against Russia are also continuing. At the same time, the news that the United States intends to take military action against Venezuela has fermented, triggering market concerns about disruptions in crude oil supply and boosting oil prices.
💡Supply-demand factors:
On the one hand, OPEC announced at a new round of meetings that it would continue to increase production by 137,000 barrels, but the scale of production increase is relatively small, and the production increase capacity of some oil-producing countries is limited, which alleviates the pressure of oversupply. On the other hand, as of October 17th, the EIA crude oil inventory data decreased by 960,000 barrels, the gasoline inventory decreased by 21.05 million barrels per day, and the distillate oil inventory decreased by 1.48 million barrels per day. The decrease in inventory has provided some support for oil prices. However, the weakness of the global economy has made the long-term demand outlook bleak, which has suppressed the increase in oil prices to a certain extent.
💡Technical analysis:
From the daily line level, the daily K-line shows a trend of breaking below the previous low point and then recovering, and the weekly K-line forms a rising sun pattern, indicating that there is a possibility of continued rebound in prices in the short term. At the same time, the medium-term indicator MACD supports an upward trend, also indicating that the short-term trend is upward.
💎Trading Strategy:
Buy 60 SL 61.5 TP 59
Daily-updated accurate signals are at your disposal. If you run into any problems while trading, these signals serve as a reliable reference—don’t hesitate to use them! I truly hope they bring you significant assistance

WTI bullish swing setupRSI divergence
Bullish chart pattern
Wait for trend reversal
red line is previous major level
Entry on trend reversal
RRR 1:2

Possible long position.A bulish wave can continue and push price higher and higher.
so a possible long position is already for me.
USOIL WTIthe current price of WTI crude oil (USOIL) stands around $62.050 to $62.31 per barrel, reflecting a recent rise of about 4.97% compared to previous days. The market has experienced volatility driven by geopolitical tensions and US sanctions on major Russian oil companies, which impact global supply dynamics.
Key Factors Affecting USOIL and Oil Trade Policies
Geopolitical Influences and Sanctions:
US sanctions on Russian oil firms such as Rosneft and Lukoil continue to tighten global supply access, especially affecting supply to large importers like China and India. These sanctions heighten supply-side risks and contribute to price volatility.
US Oil Production and Domestic Policies:
The US remains one of the top global oil producers, with policies encouraging increased output (“drill, baby, drill” style) to ensure energy security and moderate prices domestically while using energy exports as geopolitical leverage.
Trade Agreements and Tariffs:
Trade discussions, such as US-India negotiations, aim to reduce tariffs and expand energy trade, influencing crude demand and pricing. Tariffs and trade restrictions remain important policy tools that may alter trade flows and market access.
OPEC and IEA Production Forecasts:
Global supply forecasts have been revised upward, with expectations of growth to 106-108 million barrels per day by 2026. OPEC production strategies continue to influence market balance and price direction.
Market Volatility and Demand Outlook:
Economic uncertainties, inflation concerns, and shifts toward renewable energy impact demand projections. Demand growth for 2025-2026 has seen downward revisions amid these mixed signals.
Overall, USOIL prices and global oil trade in 2025 are shaped by a complex interplay of geopolitical sanctions, domestic production policies, trade agreements, and evolving market demand, creating significant price volatility and trade flow shifts.
#OIL #WTI #CRUDEOIL #GAS

Oil jumps after new US sanctions on RussiaNew sanctions against Lukoil and Rosneft by the USA pushed oil up recently as traders worried that threatened secondary sanctions on banks working with these companies could disrupt supply to China, India and other importing countries. While this has done much to alleviate recent fears of significant oversupply, the effects in the medium term aren’t clear yet.
$54.75-56 seems to be confirmed as an area of support on the weekly chart with 17-20 October having been the third unsuccessful test. The crossover of the slow stochastic in oversold and clear break above the 20 SMA might normally be strong buying signals but volume doesn’t clearly support the bounce yet.
The 50 SMA from Bands which is price is currently testing looks like an important short-term dynamic resistance. Confirmation of more gains might come from a daily close clearly above $62. Beyond there, the 200 SMA just below $64 is likely to be a strong resistance from which a breakout would probably require a significant uptick in buying volume.
This is my personal opinion, not the opinion of Exness. This is not a recommendation to trade.

USOIL : Full analysisHello friends
Well, considering the sharp decline we had, the price has entered a descending channel and is slowly going down in this channel.
Now the price has reached a critical point, namely the bottom of the channel.
We need to see if buyers will support the price at the bottom of the channel like the previous two times or not?
If we do not see support from buyers and the channel is broken, we can expect lower prices.
56.30 and 53 dollars respectively.
But we will most likely see buyers' support in this area and the price could even reach the channel ceiling.
*Trade safely with us*

US OILD SUPPORT, RESISTANCE & TRENDLINE ANALYSISGo "LONG" if it breaks 61.96 with 62.21 as the target and if it breaks that then plan for 62.59 and if it breaks further then go for 62.90
Go "SHORT" if it breaks 61.59 with 61.23 with the first target and if it breaks that along with the trendline support then plan till 60.86 and if it breaks that as well then further till 60.50 and breaking that also will lead to 59.93

