USOIL BEST PLACE TO SELL FROM|SHORT
USOIL SIGNAL
Trade Direction: short
Entry Level: 60.33
Target Level: 59.05
Stop Loss: 61.18
RISK PROFILE
Risk level: medium
Suggested risk: 1%
Timeframe: 5h
Disclosure: I am part of Trade Nation's Influencer program and receive a monthly fee for using their TradingView charts in my analysis.
✅LIKE AND COMMENT MY IDEAS✅
Trade ideas

A buying opportunity for oil — although it’s risky. Oil analysisAfter a strong rejection at the $61 resistance, oil is now approaching the $56–$57 support zone.
This is a time when it’s worth placing a stop in exchange for the potential of a good profit.
The yellow circle area marks the range where it’s worth entering a position.
Of course, the stop for any buy entry should be set below $55.700.

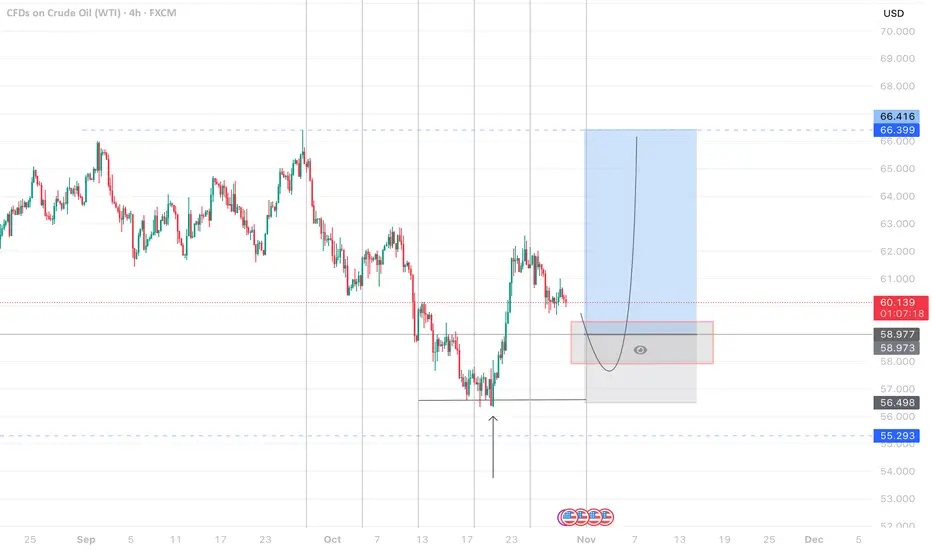
USOIL🧩 Chart Type
• 1-hour timeframe (CFDs on WTI Crude Oil)
• The chart is mainly based on Elliott Wave and harmonic pattern analysis.
⸻
🔍 Key Observations
1. Falling Wedge / Channel
• The price is moving inside a descending wedge pattern (two converging trendlines).
• This usually signals a potential bullish reversal once the pattern completes.
⸻
2. Wave Structure (Elliott Waves)
• The chart labels show A-B-C corrective waves inside the wedge.
• Currently, the market seems to be completing a C wave downwards within a complex correction.
⸻
3. Harmonic Pattern (Possibly a Bat / Gartley)
• There are multiple X-A-B-C-D harmonic projections.
• The final D point appears around 57.8 – 58.0 USD, where Fibonacci extensions (1.618 and 2.24) align.
• This area is likely a potential reversal zone (PRZ).
⸻
4. Expected Move
• After completing the downward C or D leg near $57.8–58.0,
the chart projects a strong upward move — shown by the large vertical arrow.
• This suggests a bullish reversal is expected once the final leg finishes.

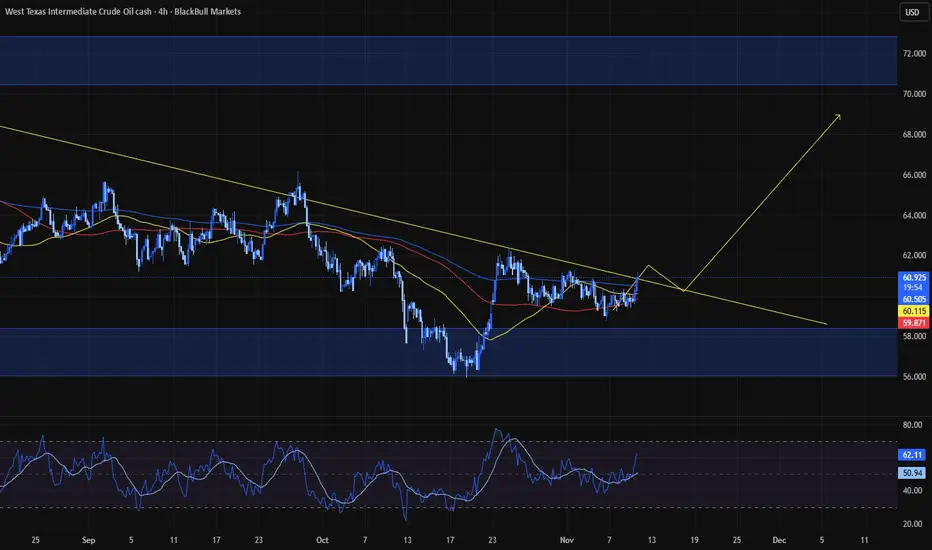
Oil - Expecting Bullish Continuation In The Short TermH1 - Downtrend line breakout.
Higher highs.
No opposite signs.
Until the two strong support zones hold I expect the price to move higher further.
If you enjoy this idea, don’t forget to LIKE 👍, FOLLOW ✅, SHARE 🙌, and COMMENT ✍! Drop your thoughts and charts below to keep the discussion going. Your support helps keep this content free and reach more people! 🚀
--------------------------------------------------------------------------------------------------------------------

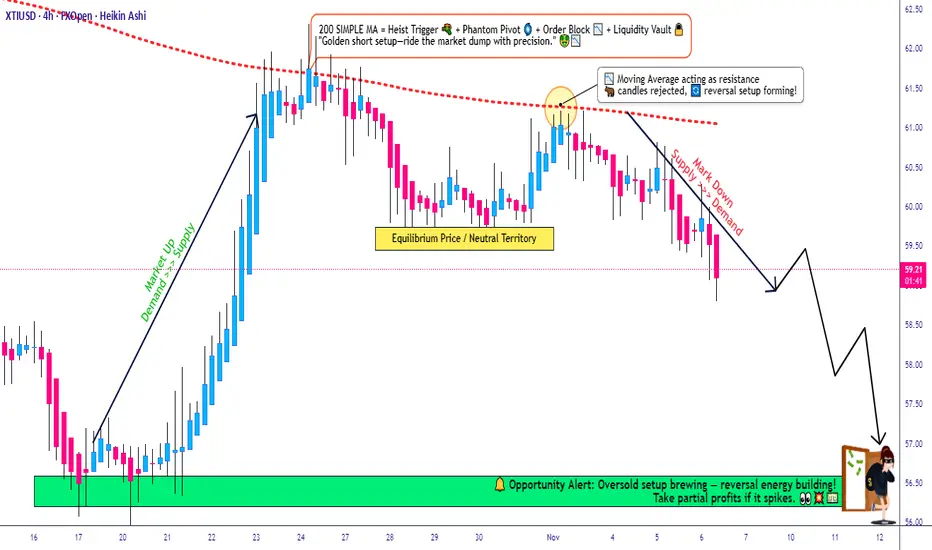
Is XTI/USD Setting Up for a Sharp Bearish Correction?🚨 WTI/USD CRUDE OIL: THE BEARISH HEIST AWAITS 🎯
═══════════════════════════════════════════════════════════
THE SETUP: Breaking Down The Crime Scene 🕵️♂️
We're executing a bearish pullback strategy on WTI/USD spot crude oil, leveraging the 200-period Simple Moving Average (SMA) as our primary technical confirmation. The energy sector is flashing opportunity signals, and it's time to work the levels like a seasoned professional.
📊 STRATEGY FRAMEWORK
Market Direction: Bearish Pullback from 200 SMA Resistance
Timeframe: Suitable for Swing & Day Trading Operations
Asset Class: Energies | WTI Crude Oil Spot
💰 THE LAYERED ENTRY STRATEGY (Multi-Level Approach)
This is where the Thief Method shines—stacking limit orders at key price levels to accumulate positions as the market comes to you:
Suggested Entry Layer Points:
Layer 1: 60.50 💧
Layer 2: 60.00 💧
Layer 3: 59.50 💧
Layer 4: 59.00 💧
⚠️ Pro Tip: Feel free to add or adjust layers based on your risk tolerance and position size. The beauty of this method is scalability—customize to YOUR account size and risk parameters.
🛑 STOP LOSS PLACEMENT
Primary SL Level: 61.00
Positioned at the nearest swing high/candle wick resistance above our entry cluster. This respects natural market structure and gives us a defined, measurable risk point.
⚡ DISCLAIMER ON RISK MANAGEMENT:
This is NOT financial advice. Risk management is YOUR responsibility. The suggested SL is based on technical structure, but YOU control your account. Set stops that align with YOUR risk tolerance. Trade only what you can afford to lose.
🎯 PROFIT TARGET STRUCTURE
Primary Target: 56.50
Secondary Support Level: 56.00 — A police barricade of strength where multiple factors converge:
Strong historical support confluence 📍
Oversold zone recognition ⚖️
Potential reversal trap (exit strategy alert) ⚠️
Exit Strategy: Consider banking profits at 56.50 before support intensifies at 56.00. Lock in gains as the technical structure suggests potential friction.
⚡ DISCLAIMER ON PROFIT TARGETS:
Again, these are TECHNICAL levels only. YOU decide your exit strategy. Whether you take full profits at 56.50, trail stops, or use partial exits—this is YOUR trading plan. No setup is guaranteed.
🔗 RELATED PAIRS TO WATCH (Correlation Check)
Understanding energy market interrelations helps you spot confirmation signals:
US Dollar Index ( TVC:DXY ) → Inverse correlation to crude oil. Strengthen USD = Bearish pressure on oil. Watch DXY for confirmation of our bearish bias.
CSEMA:S&P 500 ( AMEX:SPY / CME_MINI:ES1! ) → Risk sentiment indicator. If equities weaken, crude often follows bearish patterns. Check equity trends for macro confirmation.
Energy Select Sector ETF ( AMEX:XLE ) → Direct correlation. Tracks large-cap energy stocks. Oil weakness often precedes XLE drops.
FX:EURUSD → Global risk sentiment. Weak euro = risk-off environment = potential crude weakness. Monitor for macro context.
AMEX:USO (Crude Oil ETF) → Direct oil tracking instrument. Moves in lockstep with WTI. Use for backup confirmation.
📋 THE THIEF STRATEGY CHECKLIST
✅ Confirm 200 SMA as resistance/bearish context
✅ Stack limit orders—don't chase price
✅ Define your personal stop loss (around 61.00 structure)
✅ Target scale-outs near 56.50-56.00
✅ Use correlation pairs for macro confirmation
✅ Manage position size ruthlessly
✅ Accept losses—they're tuition in the market
💬 ENGAGEMENT BOOST
✨ If you find value in my analysis, a 👍 and 🚀 boost is much appreciated — it helps me share more setups with the community!
#WTI #CrudeOil #EnergyTrading #TechnicalAnalysis #ThiefStrategy #SwingTrading #DayTrading #Trading101 #ForexEnergy #MultiLayerEntry #RiskManagement #TradingSetup #FinancialMarkets #Energies #TradingCommunity
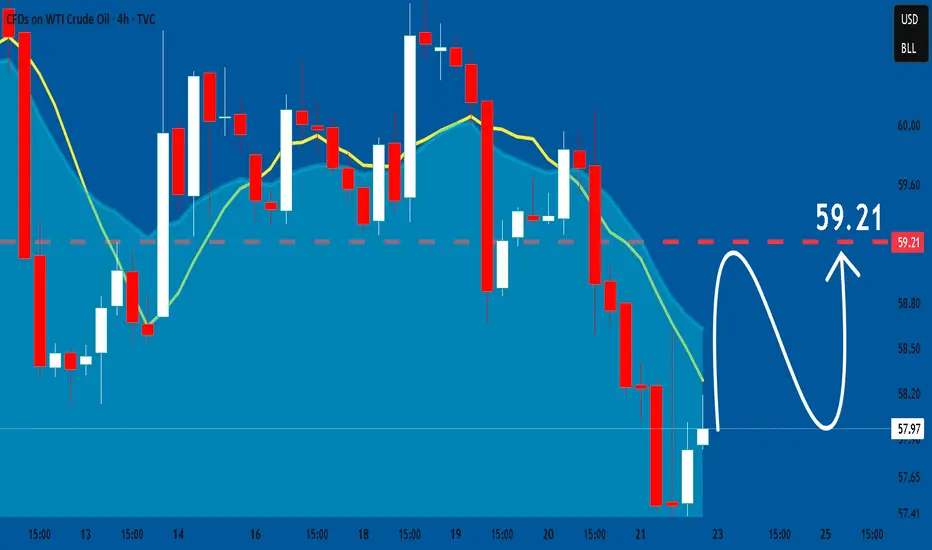
CRUDE OIL (WTI): Strong Selling Imbalance
Look at a large selling imbalance candle that was formed
on an hourly time frame after a test of falling trend line on a daily.
I think that there is a high chance that WTI Crude Oil will
continue falling now.
Goal - 59.6
❤️Please, support my work with like, thank you!❤️
I am part of Trade Nation's Influencer program and receive a monthly fee for using their TradingView charts in my analysis.

Oil analysis — entry trigger is close to being activated.Oil also behaved exactly as we analyzed and the price moved upward, but it is still too early to enter a long position.
In the next analysis, we will review the entry setup.
Potential bullish bounce off?WTI Oil (XTI/USD) has bounced off the pivot and could rise to the 1st resistance.
Pivot: 58.95
1st Support: 57.72
1st Resistance: 61.08
Disclaimer:
The above opinions given constitute general market commentary, and do not constitute the opinion or advice of IC Markets or any form of personal or investment advice.
Any opinions, news, research, analyses, prices, other information, or links to third-party sites contained on this website are provided on an "as-is" basis, are intended only to be informative, is not an advice nor a recommendation, nor research, or a record of our trading prices, or an offer of, or solicitation for a transaction in any financial instrument and thus should not be treated as such. The information provided does not involve any specific investment objectives, financial situation and needs of any specific person who may receive it. Please be aware, that past performance is not a reliable indicator of future performance and/or results. Past Performance or Forward-looking scenarios based upon the reasonable beliefs of the third-party provider are not a guarantee of future performance. Actual results may differ materially from those anticipated in forward-looking or past performance statements. IC Markets makes no representation or warranty and assumes no liability as to the accuracy or completeness of the information provided, nor any loss arising from any investment based on a recommendation, forecast or any information supplied by any third-party.

USOIL LongsUSOIL is correcting into a demand zone. The current risk to reward ratio is wide, so I am waiting for price to get to the zone, then give buy confirmations before partaking in the trade. Keep an eye out for this one. Manage Risk!

USOIL: Bullish Continuation
It is essential that we apply multitimeframe technical analysis and there is no better example of why that is the case than the current USOIL chart which, if analyzed properly, clearly points in the upward direction.
Disclosure: I am part of Trade Nation's Influencer program and receive a monthly fee for using their TradingView charts in my analysis.
❤️ Please, support our work with like & comment! ❤️
November close Where will FX:USOIL close this month?
A. $65
B. $61
C. $58
D. Below $58 somewhere around $55
What do you think?
My guess would be B. $61 because there is RSI divergence on W timeframe.

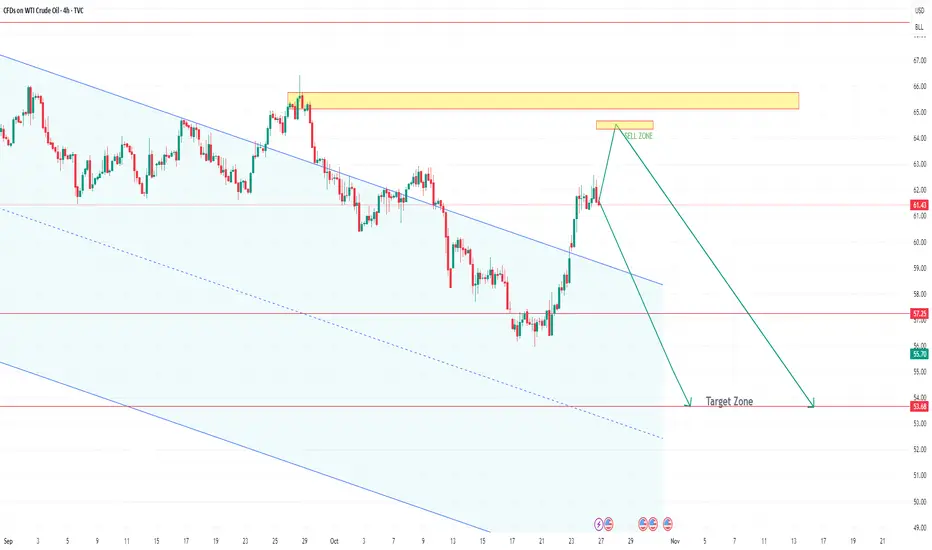
US OIL Short to 53.68The Commodity is expected to hit lower levels . The trend shows weakening of the Oil prices to the levels of 53 level.
The retracement is expected to the levels of 64.50 before the fall happens.
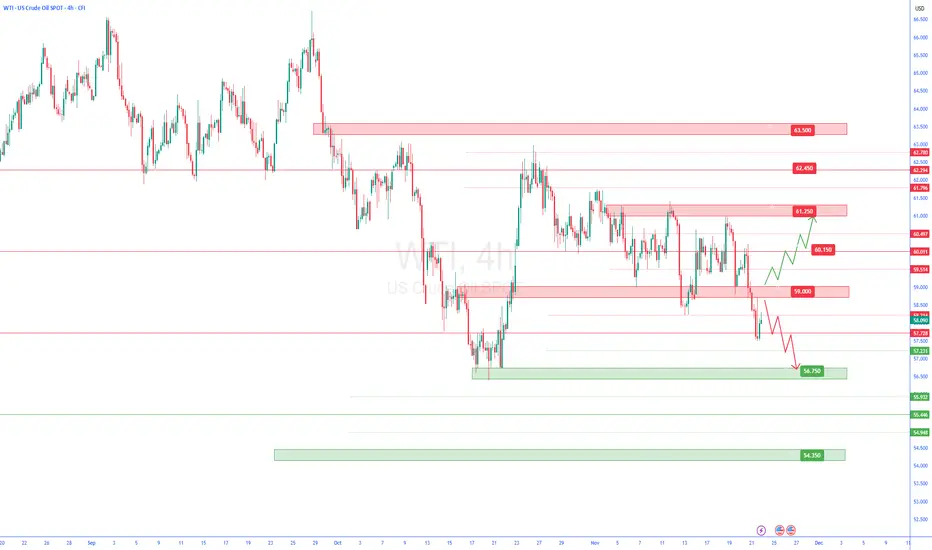
wti 4h🔹 Overall Outlook and Potential Price Movements
In the charts above, we have outlined the overall outlook and possible price movement paths.
As shown, each analysis highlights a key support or resistance zone near the current market price. The market’s reaction to these zones — whether a breakout or rejection — will likely determine the next direction of the price toward the specified levels.
⚠️ Important Note:
The purpose of these trading perspectives is to identify key upcoming price levels and assess potential market reactions. The provided analyses are not trading signals in any way.
✅ Recommendation for Use:
To make effective use of these analyses, it is advised to manually draw the marked zones on your chart. Then, on the 15-minute time frame, monitor the candlestick behavior and look for valid entry triggers before making any trading decisions.
CRUDE OIL Will Fall! Sell!
Hello,Traders!
USOIL is reacting inside the horizontal supply after a liquidity sweep, showing early bearish displacement. If rejection holds, price may continue lower toward the sell-side liquidity at the marked target zone.Time Frame 2H.
Sell!
Comment and subscribe to help us grow!
Check out other forecasts below too!
Disclosure: I am part of Trade Nation's Influencer program and receive a monthly fee for using their TradingView charts in my analysis.

USOIL Is Very Bearish! Sell!
Please, check our technical outlook for USOIL.
Time Frame: 15m
Current Trend: Bearish
Sentiment: Overbought (based on 7-period RSI)
Forecast: Bearish
The market is approaching a significant resistance area 57.983.
Due to the fact that we see a positive bearish reaction from the underlined area, I strongly believe that sellers will manage to push the price all the way down to 57.471 level.
P.S
We determine oversold/overbought condition with RSI indicator.
When it drops below 30 - the market is considered to be oversold.
When it bounces above 70 - the market is considered to be overbought.
Like and subscribe and comment my ideas if you enjoy them!

Approaching Major Support (56.5–57.0) | Potential Double Bottom WTI Crude Oil – Multi-Timeframe Analysis
Monthly (1M)
WTI is approaching a major long-term support zone at 56.5–57.0. There is a potential monthly double bottom forming, but it’s still unconfirmed. Trend remains bearish as price stays below EMA20/EMA50.
Weekly (1W)
Momentum remains weak – RSI < 50 and MACD pointing down.
However, the 56.7 level has been tested three times, forming a strong structural support. No strong bullish signals yet, but buyers are defending the area.
Daily (1D)
Price keeps rejecting EMA50, confirming the broader downtrend, but Stoch RSI is entering oversold territory. A clean retest of 56.5 would form a daily double bottom. MACD is flattening near zero, showing early signs of exhaustion.
4-Hour (4H)
This is where the strongest bullish signals appear:
MACD deeply oversold
RSI showing bullish divergence
Stoch RSI turning up from zero
Clear reaction from 57.18 support
This timeframe suggests a potential short-term bounce.

USOIL BEARISH BIAS|SHORT|
✅CRUDE OIL rejected the 3H supply after taking buy-side liquidity, producing strong bearish displacement. With order flow turning lower, price is likely to seek the sell-side liquidity resting at the marked target zone. Time Frame: 3H
LONG🚀
✅Like and subscribe to never miss a new idea!✅

Weekly Oil Candle AnalysisAs you can see, oil has been in a long-term downtrend, and this trend has been weakening over time.
Toward the end of this trend, the last few candles show that price is entering a compression zone, which usually leads to a strong move afterward. Now we need to wait and see in which direction this “spring-like” compression will release, so we can follow the trend once it starts.

Best spot to go long on OIL / WTINeed I to say more.
Oil has had not one but three attempts to go and break the $56 level which we consider as a base price since some time now for this commodity and it has failed. Then it has has a very decent upwards impulse (which for the time being we will take as an A wave) followed by quite a long and structured correction with a false break out inside as well. At this point, it cannot get better than this to go long from today's low.
First target is the +0.27% of the aforementioned impulse that took the price from $56 of October 20 to $62 of October 24.
Levels on the chart, trade with care. If structured properly this is at least a 1:10 risk to reward operation.
Please follow us for updates.

US OIL SUPPORT, RESISTANCE & TRENDLINE ANALYSISHello Guyzz apologies for ghosting out.
Let's do this. Go "LONG" only if it break 60 and above its a key hurdle and sellers are active with 60.22 and 60.69 as the possible targets.
Go "SHORT" below 59.92 with 59.60 as the first target and breaking that might lead to 59.29 and breaking further might go till 58.98 and lastly 58.52.

USOIL BEARISH BIAS RIGHT NOW| SHORT
USOIL SIGNAL
Trade Direction: short
Entry Level: 59.57
Target Level: 56.37
Stop Loss: 61.70
RISK PROFILE
Risk level: medium
Suggested risk: 1%
Timeframe: 1D
Disclosure: I am part of Trade Nation's Influencer program and receive a monthly fee for using their TradingView charts in my analysis.
✅LIKE AND COMMENT MY IDEAS✅

