QQQ's 3rd PillarAAPL is the strongest of the 3 generals since price is holding above it's 20d MA with no meaningful breakdowns since mid-October
Higher highs/higher lows intact
AAPL is the relative strength leader
Pullbacks are still being bought
Upside momentum is slowing, but no bearish triggers
MSFT clea
Related funds
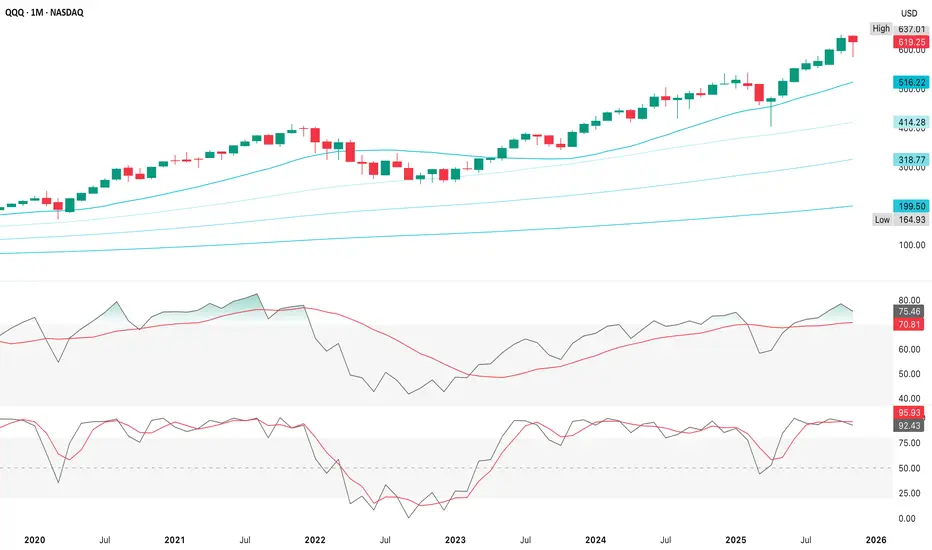
Qqq And tech sectorsI think in the coming week we will see Qqq close gap at 632, there is a chance for a pullback to 618-620 also this week.. I'll explain below how I come to both conclusions..
First The bad :
I'll start with The TVC:VIX
Fallen wedge here which is bullish for the vix... looks like a minimum bounc

QQQ Retest Into Resistance
1. AW1!/US10Y is a bond market stress gauge
This futures-to-UST ratio pushing 27-28 after bottoming near 21 shows a persistent grind higher, which usually reflects firmer demand for risk relative to sovereign debt or a rotation into duration (falling yields) boosting growth-sensitive ratios
Si
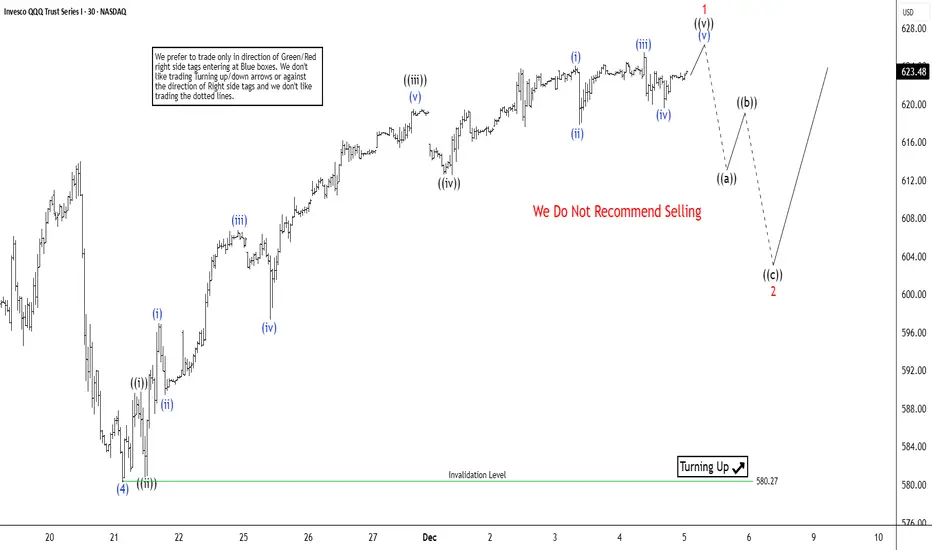
QQQ Short Term Cycle Nearing End; Pullback to Attract BuyersThe short-term Elliott Wave outlook for the Nasdaq 100 ETF (QQQ) indicates that the cycle from the April 2025 low remains active. Wave (4) of the ongoing impulse concluded at 580.27, and the ETF has since resumed its upward trajectory. To confirm continuation, price must break above the prior wave (
QQQ Heading to 635 soonBy breaking the current resistance layer chances are high we will be heading to 635 this week.

Stock Market Forecast | BTC TSLA NVDA AAPL AMZN META MSFTStock Market Forecast | CRYPTOCAP:BTC SP:SPX NASDAQ:NDX CME_MINI:ES1!
Mag 7 | TSLA NVDA AAPL AMZN META MSFT GOOGL

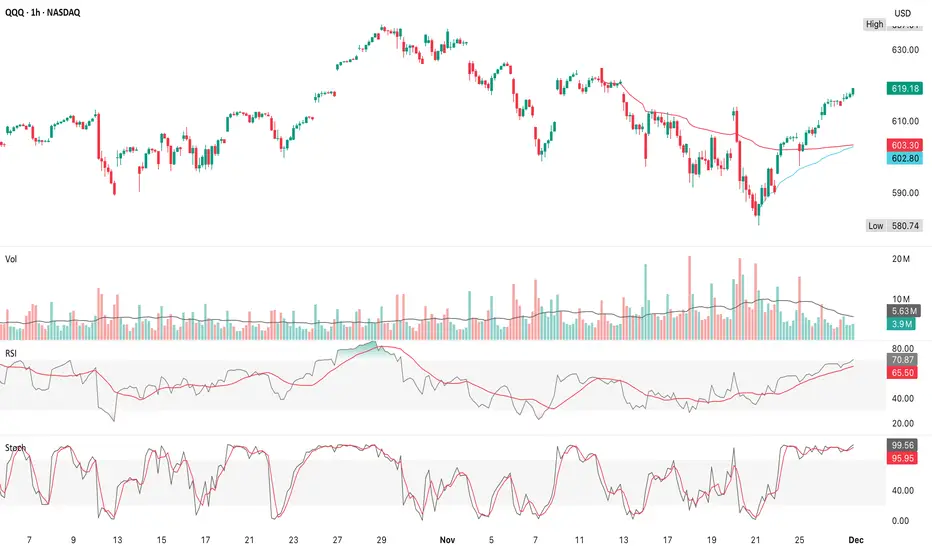
QQQ (5 December)When QQQ tops on the daily timeframe, you typically see upper-band overextension, multiple rejection wicks, bearish engulfing candles, a clear lower high formation, EMA breakdown & shrinking momentum + rising volatility, but the chart shows the opposite
Price bounced cleanly off the mid-band & is

QQQ Is QQQ topping?The 4H chart shows a clean breakout retest attempt as price is now testing the $625 resistance, the same area that previously rejected multiple times, but this time the backdrop is different
RSI shows no bearish divergence & sits at ~63 (bullish, but not overbought) which supports continuation up

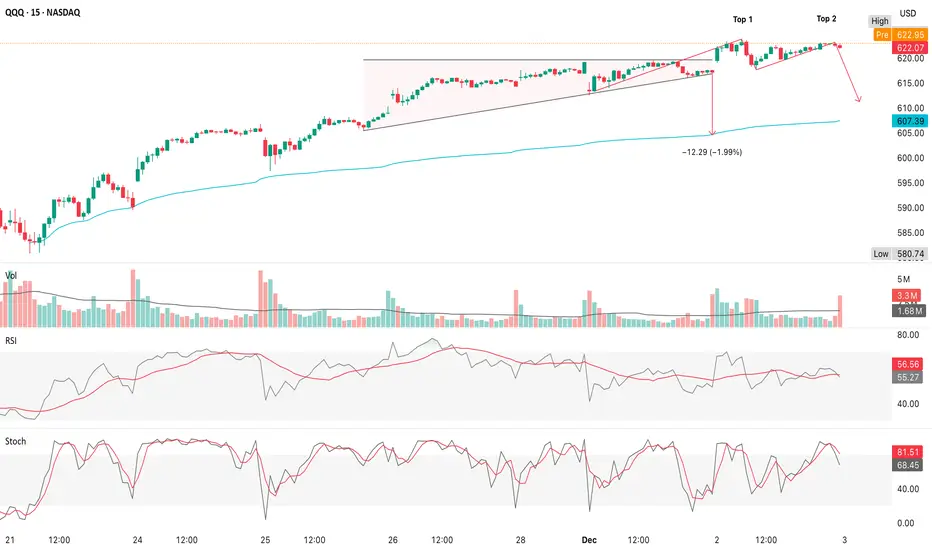
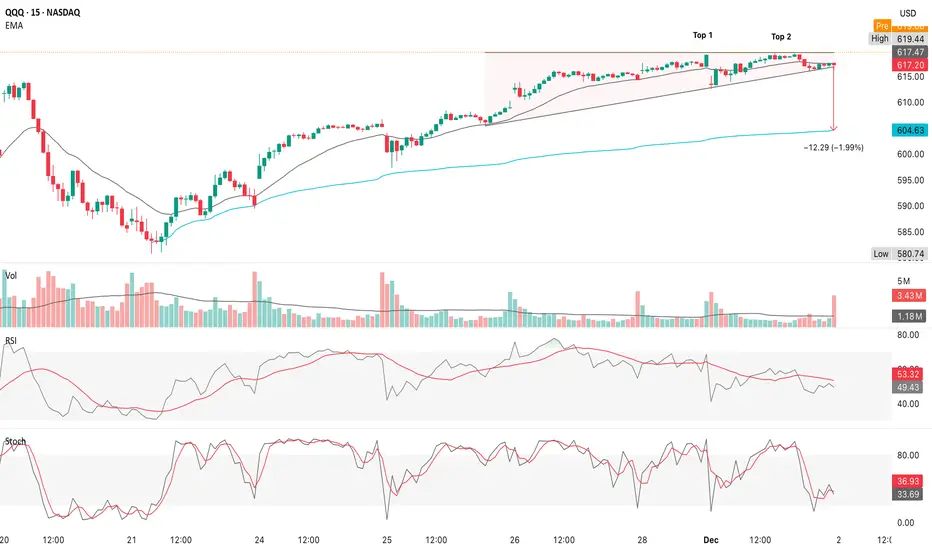
QQQ Short-Term RoadmapThe 15m chart shows 3 things with absolute clarity
1. Rising wedge
• A clean candle through wedge support
• A retest attempt that failed
• Follow-through selling
• High-volume breakdown bar
2. Double top at $619-$620
• Top 1 rejection
• Top 2 rejection
• Neckline broken
• Pattern validated
• The
QQQ (28 November)November's monthly candle is closer to a hanging man than a hammer, but the context determines whether it’s actually bearish, since a true hanging man requires 1) a long lower shadow (yes), 2) a small real body near the top of the range (yes) & 3) appears after a strong uptrend (definitely yes)
T
See all ideas
Displays a symbol's price movements over previous years to identify recurring trends.
Frequently Asked Questions
An exchange-traded fund (ETF) is a collection of assets (stocks, bonds, commodities, etc.) that track an underlying index and can be bought on an exchange like individual stocks.
Since ETFs work like an individual stock, they can be bought and sold on exchanges (e.g. NASDAQ, NYSE, EURONEXT). As it happens with stocks, you need to select a brokerage to access trading. Explore our list of available brokers to find the one to help execute your strategies. Don't forget to do your research before getting to trading. Explore ETFs metrics in our ETF screener to find a reliable opportunity.
No, QQQ doesn't pay dividends to its holders.