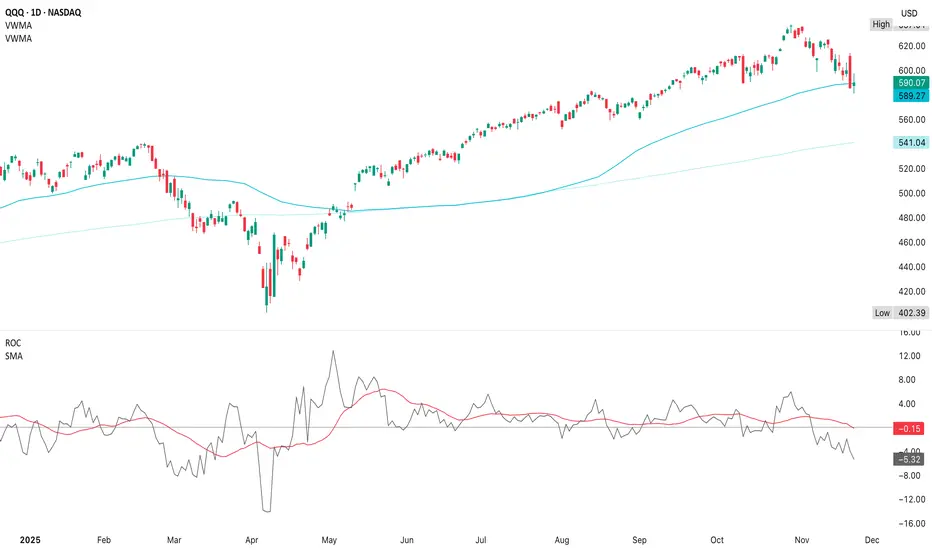
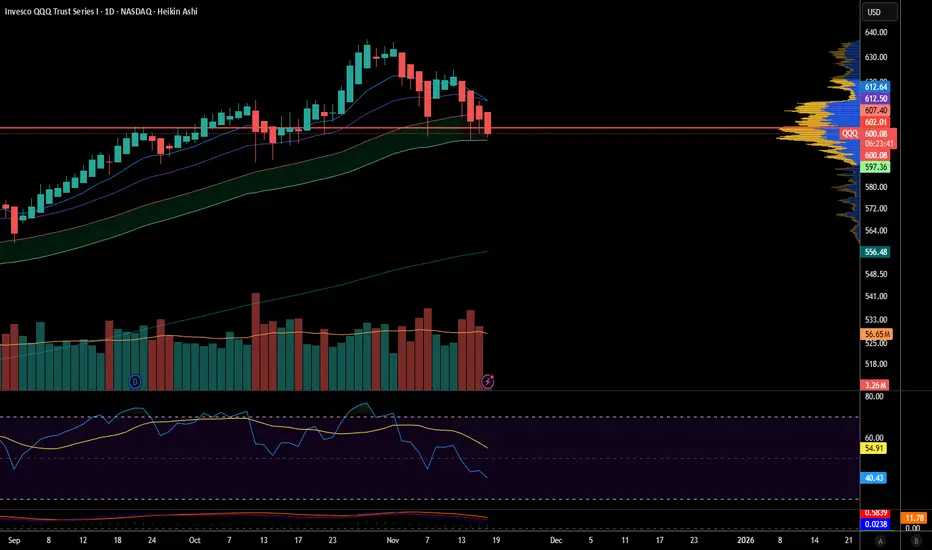
QQQ (21 November)VWMA is like an EMA, but weighted by volume, so it tells you what price the heavy money is actually paying & it exposes trend shifts earlier than simple moving averages
The 20d VWMA is curling down which shows that the short-term trend has firmly turned bearish
This downturn began well before the breakdown
The 50d VWMA is flattening, slightly bending down so the medium-term trend is now losing momentum
When 20d crosses below 50d VWMA (if it happens), that’s a trend-change confirmation
This aligns with the multi-timeframe weakness in stochastics rolling over on daily & 4H & RSI making lower highs
ROC is trending below its signal line which signals that this isn’t just a dip, but that momentum is deteriorating across multiple layers
ROC is extremely useful for measuring acceleration; rather than, direction
ROC has been trending under the signal line for about 2 weeks & is now below zero, indicating negative momentum
No bullish divergence appears yet (price lows not rising vs ROC lows rising)
The ROC signal line is sloping down which signals sustained weakness
There are only 2 reasons for VROC to spike this hard (unusual ahead of Thanksgiving) & spikes above 100% only occur near major turning points, both tops & bottoms
Capitulation into a low
Institutional rotation before another leg lower
This is the opposite of a bottoming structure
Current ROC behavior matches early-cycle pullback phases from February 2020, September 2021, April 2022 & March 2024
Each of these periods saw a continued drift lower, lower highs on oscillators & price returning to mid-range support levels
Looking at earlier timeframes, initial support is $586-$589
$573-$576 is highly probable if the oversold bounce fails
$558-$563 is weekly support & $540-$545 is less likely, but possible in a deeper correction (50wk MA)
Given VWMA downtrend & ROC weakness, the path of least resistance is still down to the $573-$576 or $560 area unless a catalyst interrupts the selling
Historically, when ROC breaks below zero & VWMA is rolling over, the pullback usually extends 2-4 weeks
Price tends to form a lower low or retest the first low before recovering
Bounce attempts during this period are weak (exactly what we saw this week)
Thanksgiving week usually has lighter volume that contribute to false moves & NFP data the following week is a a major event into the December FOMC, so expect a weak bounce ($598-$605) in the next 3-5 trading days with a pullback lower into early/mid December
The true reversal likely only after a vol spike & ROC divergence
This is not yet bottoming behavior, momentum is declining, the short-term bounce attempts are corrective, not impulsive, so the next logical destination remains $573-$576 & then $560
Price may push higher to $605-$612 which means we see a sharper sell-off in December
Until ROC flattens, ROC offers a bullish divergence, price reclaims 20d VWMA & stoch/RSI turn up on the daily, QQQ is still in the middle of a corrective leg down; instead of a real, tradable reversal
Trade ideas
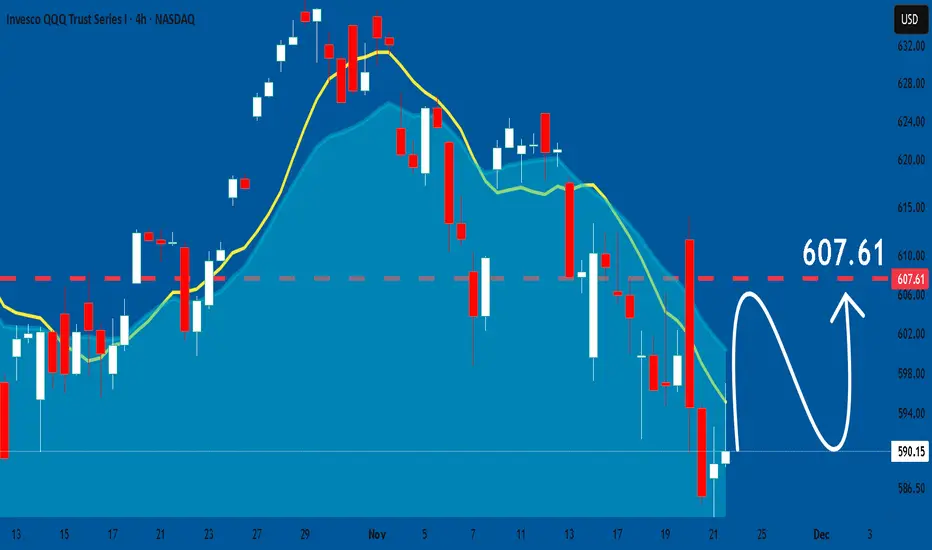
QQQ: Growth & Bullish Forecast
The analysis of the QQQ chart clearly shows us that the pair is finally about to go up due to the rising pressure from the buyers.
❤️ Please, support our work with like & comment! ❤️
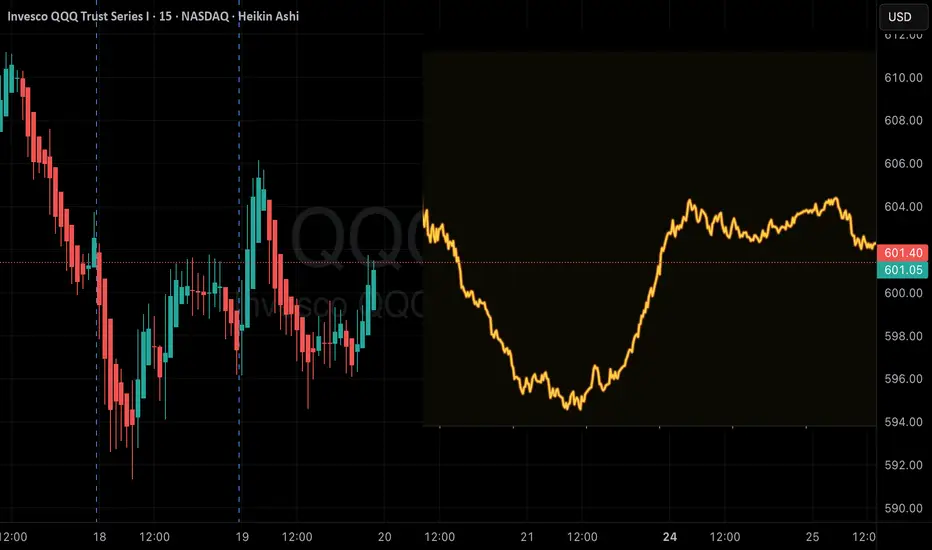
Daily QQQ (US100-NQ) Outlook - Prediction (21 NOV)Daily QQQ (US100-NQ) Outlook - Prediction (21 NOV)
📊 Market Sentiment
Market sentiment is bearish right now, in my opinion. The FED is expected not to cut rates in December, and the uncertainty around when rate cuts may resume in 2026 is adding pressure. After yesterday’s intraday crash, overall market anxiety has increased significantly.
📈 Technical Analysis
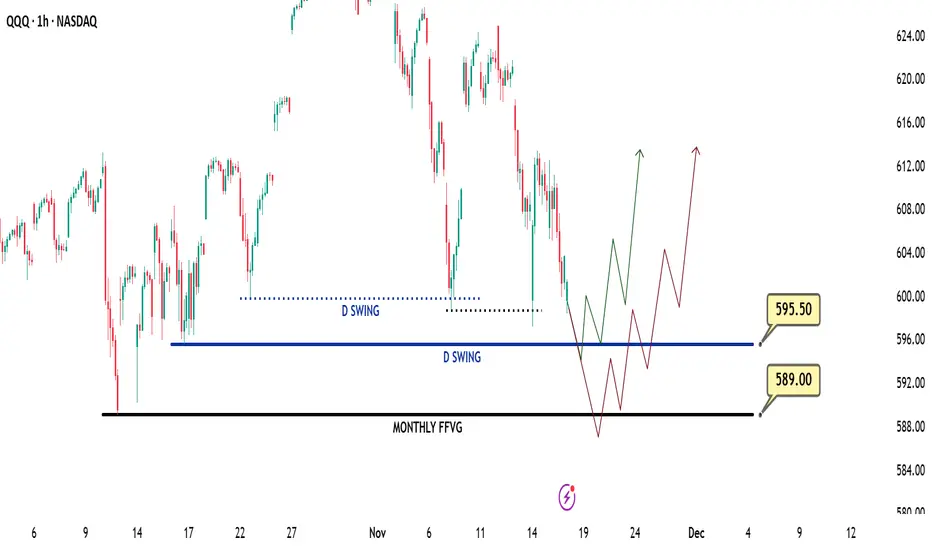
Price tapped the monthly FVG level around 588.5, which holds significant liquidity. In my view, this zone may set up the foundation for a potential Friday bounce.
📌 Game Plan – Prediction
I expect two possible scenarios:
Scenario 1 (Black Line):
Price may consolidate and range between 597–588, creating choppy intraday price action.
Scenario 2 (Red Line):
Price may retrace toward 578.5, then recover and move back above the 588 level.
💬 For detailed insights and broader market context, please check my Substack link in profile.
⚠️ For educational purposes only. This is not financial advice.

QQQ Gobble, Yelp, Cluck, Purr, Cackle, Cutt, Keekee!Thanksgiving week has a strong statistical pattern & historically, Monday-Tuesday shows normal volatility (often a continuation of the prior trend), Wednesday is a half-day with very little volume (small bounces) & Friday (also a half-day) is choppy with fake moves, low conviction & slow
Thanksgiving week is bullish during uptrends & during downtrends these shallow bounces fizzle out
The bounce ahead of the holiday fizzles out due to low volume & lack of buyers
Week after Thanksgiving usually gives a big directional move & usually down, or a continuation of the current downtrend
The moves next week tend to lack power & any bounce is not a true reversal, but the week after Thanksgiving (2-6 December) is when the real move happens & could be the window for the drop towards $568 to $560
Funds don’t reposition aggressively on holiday weeks
Low liquidity prevents trend continuation
Big red moves require volume, which returns first week of December
Early December is historically one of the most volatile periods each year
So this add confidence to the timeline of the expected move lower
QQQ will likely bounce next week to $598-$605 then the drop into $560 between 2-6 December supported by the fact that QQQ is still well below its 20d/50d MAs & losing trend support
If you want to trade, keep to small bullish scalps only & avoid heavy puts short-term since low volume kills momentum
Key upside is likely capped to $599-$605
After Thanksgiving is the best window to enter puts because the directional moves become strong with clear downside targets of $575 to $570 to $562 to $560
Thanksgiving delays the big leg down, but does not cancel it; in fact, the small expected bounce sets up the sharp drop the following week

QQQ Momentum Play: QuantSignals V3 Sees Sharp DownsideQQQ | QuantSignals Katy 1M Prediction (2025-11-21)
Current Price: $595.17
Predicted Close: $582.79 (-2.08%)
30-min Target: $584.69 (-1.76%)
Trend: Bearish
Confidence: 73.9%
Volatility: 16.8%
Trade Signal
Direction: PUT (SHORT)
Entry: $595.17
Target: $585.26
Stop Loss: $604.10
Expected Move: -2.08%
Summary: 1 trade signal generated from 1 successful analysis.
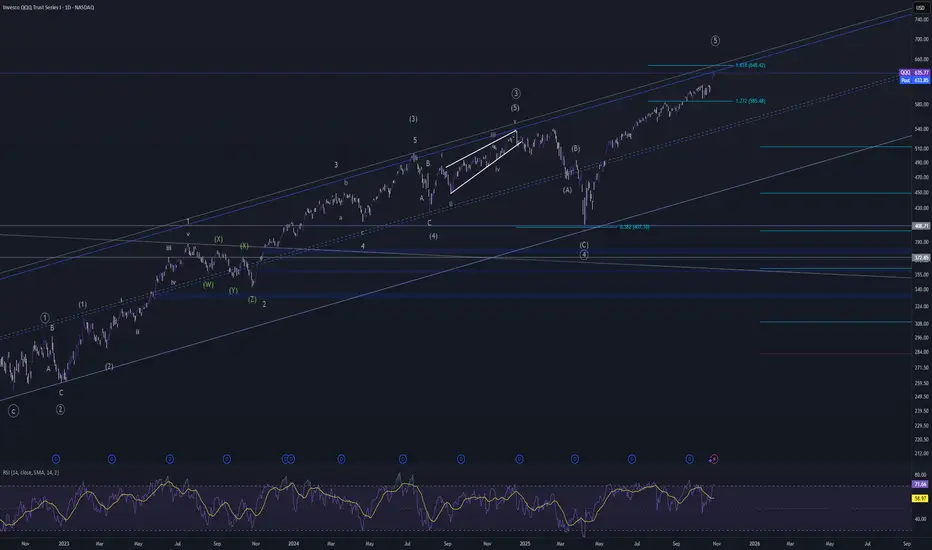
QQQ- BEarish Sequenceexpecting a 5-3-5 correction not to different from othe out look but had to change a few things good luck!

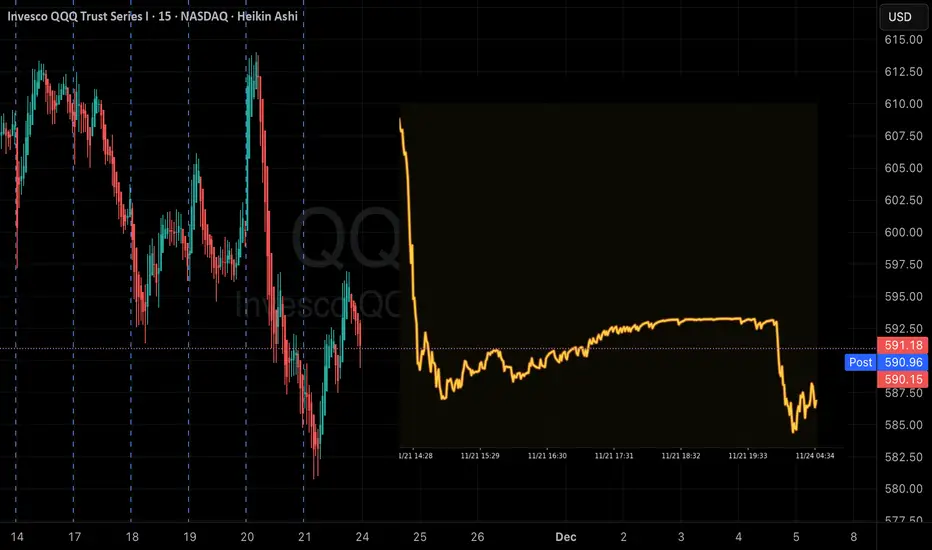
QQQ Liquidation FlushToday was a liquidation flush & the opening price action wasn’t a bounce attempt, since it largely occurred after-hours rather than during regular trading hours
• The failed push was simply a backtest of broken intraday moving averages & not the bounce to the 20d MA that's expected, but today's drop sets the stage now
• The bounce was initially expected from the level that price hit today (~$583)
• The market needed this flush to generate real bounce conditions, so the bounce expectation remains because the real signal just fired
The daily Bollinger band breakdown has a very high mean reversion probability
• When QQQ closes a full red candle outside the lower Bollinger band, a reflex bounce occurs within 1-2 sessions almost ~85% of the time & today was the breakdown day
• The bounce almost never happens on the breakdown candle, but comes immediately after, so we're on schedule
Intraday indicators didn’t actually show bounce conditions until the last hour
• 15m Stoch is curled up after the close
• 1H RSI at ~32
• 1H candle bodies are extended from 1H 20 MA by 3%
• 4H Stoch is basically 0
These are the conditions that produce the bounce
• We now have oversold momentum, a completed flush, a proper lower band break, a perfect touch of the 100d MA, capitulation volume & structure completion (wave a likely ended today)
Today wasn’t the bounce, but the setup, so the expected bounce remains to $603-$612 with a high probability of hitting it before the next major leg lower
• Now to 27 November 27 into 3 December (NEVER SHORT A DULL TAPE - Thanksgiving week)
• 3 December to 20 December (tax-loss selling & liquidity pockets produce the broader correction)
• Final low into mid-late December, then a strong Q1'26 rebound
Monthly is overbought & starting macro reversal
⬇
Weekly's momentum turning into a multi-week correction
⬇
Daily lost 20d MA & Bollinger breakdown signals trend shift
⬇
4H/1H VWAP resistance & declining MAs suggests bounces will fail
⬇
Intraday completed wave a flush into first support so everything is aligned & nothing contradicts anything else
Short-term (next 5-10 days)
• 70% probability
• Bounce to $603-$612
• Rejection
• Move down into $555-$570
• Within 1-3 days
• Late November into early December
Today wasn’t the bounce, but the flush into the bounce
• After-hours price action (around $583-$585) hit the exact lower Bollinger band, so that is where bounces begin, not where they end
• If QQQ opens anywhere above $585 tomorrow, your upside window is bounce target = $603 to $612 (these are the 1H/4H resistance & the 20d MA retest) creates a clean 3-5% snap which is perfect for short-term calls
• Invalidated if QQQ closes below $580-$583
• Calls are a good idea for a bounce, not a swing with an expiry 6 December & strikes $600, $605 & $610 for an expected peak before rejection anywhere from $603-$612, but don't overstay
After the bounce, the most straightforward option place is directions with puts
• $580 strike with an expiry 20 December (monthly) because $580 is right inside the target area of $555-$570 so gives room for theta decay since the expected decline is expected to last 2-3 weeks
• Avoids weekly expiries that get crushed by time decay
• You get IV expansion as price drops
A higher risk/reward strategy is a put spread if you want defined risk & better capital efficiency, so buy a $590 put & sell a $560 put with a 20 December expiry
• $590 is the current breakdown level
• $560 is the projected low of wave c
• Profit if QQQ lands anywhere ≤$560 into December OPEX
• Captures maximum value if $555-$570 target hits
An ultra safe hedge with less stress is $600 puts with a 16 January expiry (monthly)
• This one is for lower IV entry, more time for the correction to fully complete & survives a bigger bounce (even if it pushes to $612-$616)
$580P 20 December expiry is the best match for the projected correction's timing & target
(IF QQQ CLOSES BELOW $580, THIS INVALIDATES THE EXPECTED BOUNCE & THE CORRECTION BEGINS IMMEDIATELY)

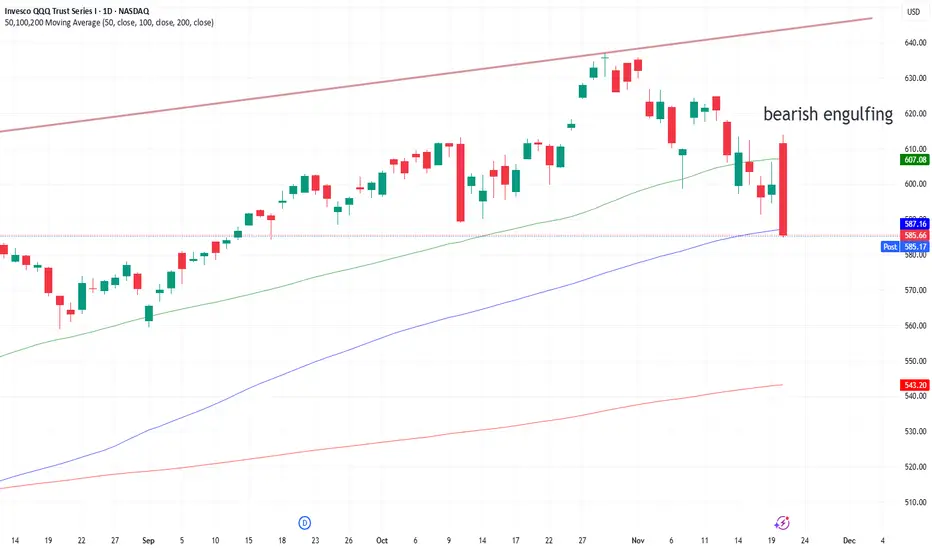
QQQ finally topping out?Getting near the top of the channel since 2022. The 161.8% extension of the drop down to April is right above today's high as well. Market is overbought with bearish divergence on the daily, weekly, and monthly. Maybe 1 more high???
QQQ bearish engulfing with close below 100 DMAThere should be continued follow-through on the sell-off from this level. $540 is a support level from Pre-April 2025 highs.
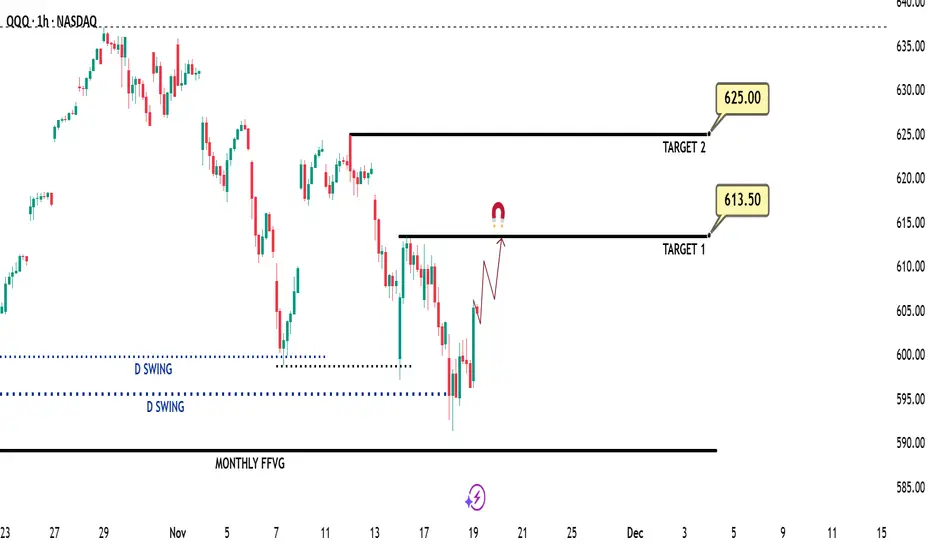
Daily QQQ (US100-NQ) Outlook - Prediction (20 NOV)Daily QQQ (US100-NQ) Outlook - Prediction
📊 Market Sentiment
Market sentiment appears neutral to bullish right now, in my opinion. The FED may pause rate cuts in December, which previously contributed to selling pressure and hedging flows. However, with the U.S. government reopening last week, updated economic data will begin to flow again. If employment data weakens and CPI comes in low or stable, it could support renewed bullish momentum.
NVDA beat earnings expectations and addressed AI bubble concerns clearly. AI demand remains strong, and their revenue growth continues to accelerate. U.S. tech firms turned notably green after the release, further boosting bullish sentiment.
📈 Technical Analysis
Price is currently rising toward 613.5 following NVDA’s earnings results. A strong bullish candle close has appeared on NQ, indicating solid upward momentum heading into today’s session.
📌 Game Plan – Prediction
I will be buying calls at the opening, targeting 613.5 first. After that, I will be targeting 625. If I see a 1H bearish close below the opening price, I will exit my positions, as I expect strong bullish momentum after the market opens.
💬 For detailed insights and broader market context, please check my Substack link in profile.
⚠️ For educational purposes only. This is not financial advice.

QQQ Mean-ReversionEvery time QQQ reached the lower Bollinger band, a mean-reversion bounce followed this year
When price tags the lower band & doesn’t expand downward, it means the selling is losing momentum
The 20d MA is near $605 & the nearest magnet after a lower band tag
Price almost always returns to the middle band unless there is a trend breakdown (not yet the case)
There is a volatility expansion event (NVDA earnings maybe)
As of now, the bands aren't expanding, but stable, which means the chart favors mean-reversion rather than breakdown
The upper Bollinger band is near $620-$625 & aligns with the 10 October AVWAP & the 4H resistance around $617 & is the maximum price target if the bounce extends above the 20d MA
A bounce to $605-$610 isn’t just possible - it’s expected
Price almost always returns to the mean; unless, the trend breaks
Price still above the September/October high-low structure
The probability favors a bounce to $605-$610
Only one thing invalidates the mean-reversion bounce - A full body daily close below the lower Bollinger band which signals volatility expansion, trend transition & momentum breakdown

Nasdaq. Neochanneling vision practice from November 20, 2025.Analysis of the probable movement of Nasdaq using the psychological technology of neochanneling.
For the NASDAQ index, a decline toward the price levels of September 2025 is expected. The first target level of the decline is around 560 points.
По индексу NASDAQ ожидается снижение в район цен сентября 2025 года. Первый целевой уровень снижения — около 560 пунктов.

QuantSignals V3 | QQQ Short-Term Downside OpportunityQQQ QuantSignals V3 – 0DTE PUT Trade (2025-11-19)
Trade Signal:
Direction: BUY PUTS (Short)
Strike Price: $598.00
Entry Price: $0.04–$0.05 (mid $0.04)
Target 1: $0.08 (100% gain)
Target 2: $0.12 (200% gain)
Stop Loss: $0.02 (50% risk)
Expiry: 2025-11-19 (same-day)
Position Size: 2% of portfolio
Confidence: 68% (Medium)
Market Analysis:
Trend: Katy AI predicts bearish trajectory despite composite BUY CALL signal
Price Action: $602.62 declining toward $599.59 (-0.50%)
Technicals: RSI overbought at 87.1, EMA alignment bullish but multi-timeframe divergence bearish, VWAP support at $598.72
Options Flow: Put/Call Ratio 1.25, unusual activity at $603 put, max pain at $598
News Sentiment: Neutral; no strong directional catalysts
Volatility: High due to 0DTE time decay and overbought conditions
Competitive Edge:
Katy AI’s detailed prediction shows consistent short-term downside
Entry at max pain strike captures natural gravitational pull
Morning session entry (9:35–11:00 ET) aligns with predicted momentum fade
Tight stop loss mitigates extreme 0DTE gamma/time decay risk
Risk Notes:
High-risk trade due to 0DTE expiry
Monitor actively; close positions at target or stop without hesitation
RSI extreme overbought and high volume indicate potential reversal
QQQ megaphone updateLooking for a small bounce here on NVDA earnings that gets sold into, then the larger correction can begin in earnest

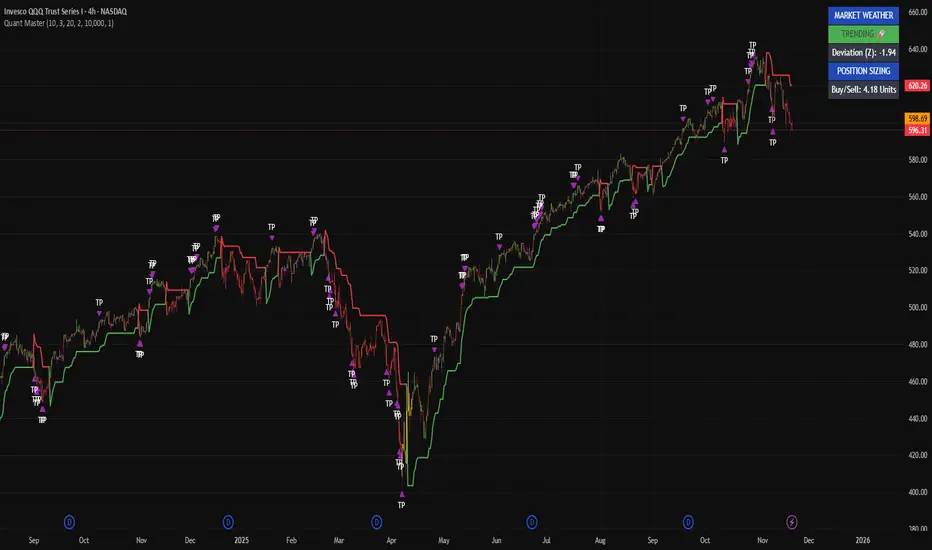
Why I'm NOT Buying the Dip on QQQ (Yet)Many traders are trying to catch a falling knife on the Nasdaq right now. Here is why my system says "Wait."
Looking at the Quant Master system on the 4H timeframe:
Trend is King: The candles are Red. This means Price is below the Volatility Stop and below the institutional VWAP anchor. There is no "Green Light" to buy yet.
Beware the "Black" Zones: If the candles turn Black, it means volatility has spiked or momentum has died (Chop). I do not trade in Black zones. I am waiting for clear Blue structure.
The Exit Was Clear: If you look at the top of the chart, the system printed multiple Purple Triangles. This signaled that the trend was exhausted relative to its statistical baseline. If you didn't take profit there, the market took it for you.
The Plan:
I am sitting on my hands until price closes ABOVE the VWAP (Orange Line) and the Stop Loss line turns Blue.
Trade what you see, not what you think.

Daily QQQ (US100-NQ) Outlook - Prediction (19 NOV)Daily QQQ (US100-NQ) Outlook - Prediction (19 NOV)
📊 Market Sentiment
Market sentiment appears bearish right now, in my opinion. The FED may pause rate cuts in December, which has contributed to recent selling pressure and possible hedging flows. However, with the U.S. government reopening last week, we will begin receiving updated economic data again. If employment data weakens and CPI comes in low or stable, it could trigger renewed bullish momentum.
NVDA earnings will be released today after market close. If NVDA beats expectations, this could trigger an impulsive bullish move for both QQQ and SPY. If earnings miss, that may create strong bearish sentiment across the market.
📈 Technical Analysis
Price tapped the 595.5 level and bounced cleanly from there. A strong bullish candle close has appeared on NQ, indicating solid upward momentum for the day.
📌 Game Plan – Prediction
I am buying calls targeting 613.5 first. I will also keep a runner for a potential move toward 625 in case NVDA reports strong earnings. That could generate significant bullish momentum, potentially pushing price toward new all-time highs. My runner is positioned for that potential after hours continuation.
💬For detailed insights and broader market context, please check my Substack link in profile.
⚠️ For educational purposes only. This is not financial advice.
$QQQ Strong momentum down- Watch your assetsTake profit, enter Sell mode! All risk factors in my indicator I made are showing large amounts of risk in holding long positions. Sell!
Market structure has broken down

QQQ – Mapping the Trend With My Quant Master System (4H)Precision trend tracking. Zero noise. Pure structure.
I’m tracking QQQ on the 4-hour using my Quant Master Trend System, a custom-built model that blends volatility stops, structural momentum, deviation analysis, and adaptive TP logic.
The goal isn’t to predict — it’s to read the map, stay aligned with the dominant pressure, and avoid the traps that most retail traders fall into.
The Quant Master ribbon has flipped red, confirming we’re in a short-term downtrend.
QQQ has lost its green momentum base, and that base is now acting as resistance.
Whenever my ribbon flips red on the 4H while the market weather panel stays TRENDING, it means:
Trend strength is still alive
Pullbacks are not dips — they’re continuation setups
Bulls are not in control (yet)
That’s exactly the current environment.
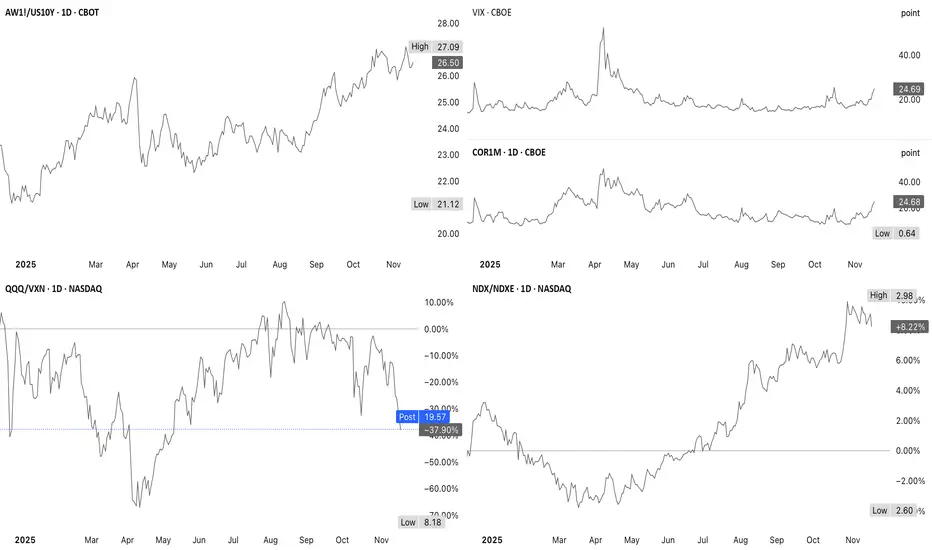
QQQ Macro + Volatility Read1. AW1!/US10Y shows commodities trending higher
A rising broad commodity index means inflationary pressure is accelerating & this tends to push yields up, which pressures tech multiples
Higher commodity prices is a drag on QQQ
2. VIX & COR1M shows volatility is high
COR1M ripping harder than VIX indicates front-loaded hedging & is event-driven
After NVDA earnings, volatility normally compresses sharply unless the event is disastrous
This is supportive for a post-event equity bounce
3. QQQ/VXN is still extremely washed-out
QQQ underperforming implied volatility by a wide margin is historically associated with short-term exhaustion lows
This extreme is more consistent with fear/hedging overshoot
This favors a bounce unless VXN continues ripping
4. NDX/NDXE shows breadth remains strong
Even with commodities rising (inflation pressure), equal-weight Nasdaq is firmly outperforming
When inflation becomes a serious tech headwind, breadth usually collapses, not expands
Breadth made higher highs, is still in an uptrend & turned bearish
This is event-driven fear layered on top of a still-healthy breadth structure
NVDA event hedging elevates COR1M/VIX, QQQ dips into support ($598-$602)
Volatility crush after earnings if NVDA isn’t disastrous results in a bounce toward $610-$620; however, rising commodities means the upside is less explosive & may fade sooner
A rebound toward $610-$620 remains the more probable post-NVDA path
NASDAQ:QQQ AMEX:SPY NASDAQ:NVDA
QQQ overbought positionThis chart looks at the exponential moving averages on a daily timeframe and puts into perspective the overbought or oversold position of the price action.
Daily QQQ (US100-NQ) Outlook - Prediction (NOV 18)Daily QQQ (US100-NQ) Outlook - Prediction (18 NOV)
📊 Market Sentiment
Market sentiment appears bearish right now, in my opinion. The FED may pause rate cuts in December, which has contributed to recent selling pressure and possible hedging flows. However, with the U.S. government reopening last week, we will start receiving updated economic data again. If employment data weakens and CPI comes in low or stable, it could trigger renewed bullish momentum.
NVDA will report earnings this Wednesday after market close. I will be watching closely in my view, if NVDA were to miss expectations, both QQQ and SPY could see a strong retracement. However, I think this is unlikely. I expect solid earnings growth and believe the ongoing AI cycle continues to support upside.
Additionally, U.S. Treasury Secretary Scott Bessent stated that the Trump administration aims to finalize its trade agreement with China by Thanksgiving (November 27). This could bring further bullish sentiment into the market.
📈 Technical Analysis
The market showed a strong bounce on Friday after tapping the 599 level. RSI has also reset, meaning price is no longer overbought. We remain inside the weekly range, and price has now touched the 0.75 max discount zone for the second time.
📌 Game Plan – Prediction
There are 2 different expectations outlined on the chart.
S cenario 1 (Green line): Price to hit 585.5$ then close 1H above the level, bringing it back to us for a bounce.
Scenario 2 (Red line): Price retraces till 579 and gets a bounce from there. I believe 579 is the strongest zone for buyers. I will be buying calls once we hit there.
💬 For detailed insights and broader market context, please check my Substack link in profile.
⚠️ For educational purposes only. This is not financial advice.
Daily QQQ (US100-NQ) Outlook - Prediction (17 NOV)Daily QQQ (US100-NQ) Outlook - Prediction (17 NOV)
📊 Market Sentiment
Market sentiment appears bearish right now, in my opinion. The FED may pause rate cuts in December, which has contributed to recent selling pressure and possible hedging flows. However, with the U.S. government reopening last week, we will start receiving updated economic data again. If employment data weakens and CPI comes in low or stable, it could trigger renewed bullish momentum.
NVDA will report earnings this Wednesday after market close. I will be watching closely in my view, if NVDA were to miss expectations, both QQQ and SPY could see a strong retracement. However, I think this is unlikely. I expect solid earnings growth and believe the ongoing AI cycle continues to support upside.
Additionally, U.S. Treasury Secretary Scott Bessent stated that the Trump administration aims to finalize its trade agreement with China by Thanksgiving (November 27). This could bring further bullish sentiment into the market.
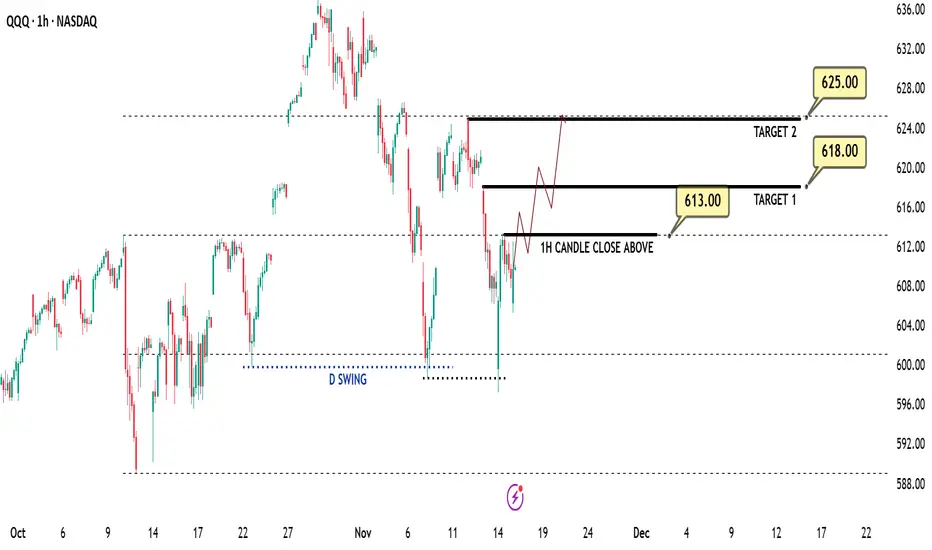
📈 Technical Analysis
The market showed a strong bounce on Friday after tapping the 599 level. RSI has also reset, meaning price is no longer overbought. We remain inside the weekly range, and price has now touched the 0.75 max discount zone for the second time.
📌 Game Plan – Prediction
A 1H candle close above 613 on QQQ will confirm bullish momentum, setting the next target at 618. If we get a clean 1H close above 613, I will be buying calls. After hitting 618, price may pull back slightly before eventually pushing toward 625 and potentially all-time highs around 637.
💬For detailed insights and broader market context, please check my Substack link in profile.
⚠️ For educational purposes only. This is not financial advice.
QQQ to 618, then 628If all goes well QQQ we should see this hold 598. This will confirm a bull-market is still in play, thus revisiting previous highs at 628-630. Why this price target? Volume Void or inefficiencies are present at 618 and lastly 628. My assumption is price tends to revisit these areas of inefficiencies, thus supporting the bullish-bias.
