SPY Pre-Market Trade Plan (Bearish Bias) 9/25Been receiving lots of positive feedback on pre-market trade plans so here is another one for 9/25. Trade Idea with a bearish central thesis. Invalidates if we break and close above to purple box (stop).
SPY trade ideas

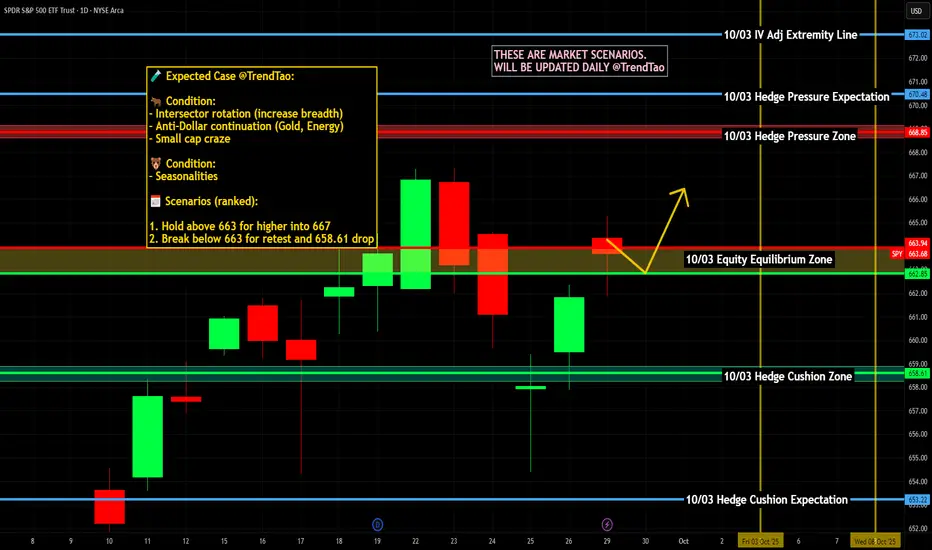
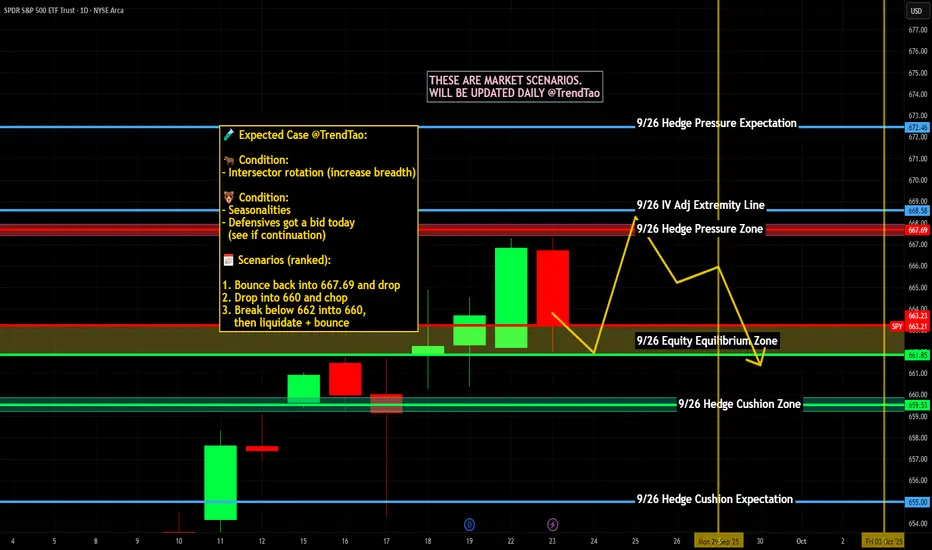
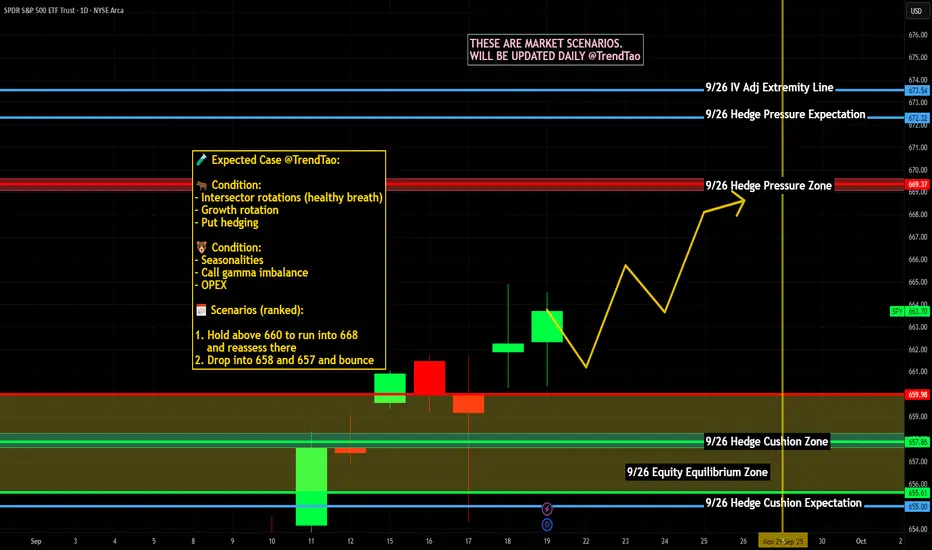
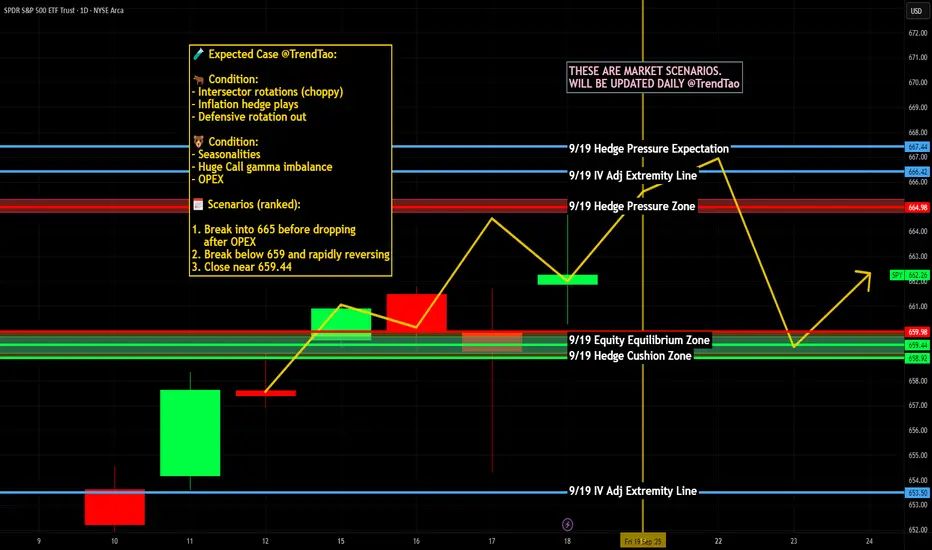
$SPY / $SPX Scenarios — Tuesday, Sept 30, 2025🔮 AMEX:SPY / SP:SPX Scenarios — Tuesday, Sept 30, 2025 🔮
🌍 Market-Moving Headlines
📉 Q3 closeout: Last trading day of September = quarter-end rebalancing flows in equities and bonds.
💵 Fed watch: Multiple Fed speakers across the day keep policy tone in focus.
💻 Mega-cap drift: NASDAQ:AAPL , NASDAQ:MSFT , NASDAQ:NVDA leadership remains sensitive to yields + growth data.
📊 Key Data & Events (ET)
⏰ 🚩 9:00 AM — S&P Case-Shiller Home Price Index (Jul, 20-city)
⏰ 🚩 10:00 AM — JOLTS Job Openings (Aug)
⏰ 🚩 10:00 AM — Consumer Confidence (Sep, Conf. Board)
⏰ 9:45 AM — Chicago PMI (Sep)
🗣️ Fed Speakers:
• 6:00 AM — Philip Jefferson (Fed Vice Chair)
• 9:00 AM — Susan Collins (Boston Fed)
• 1:30 PM — Austan Goolsbee (Chicago Fed)
• 3:30 PM — Austan Goolsbee (Chicago Fed, TV appearance)
⚠️ Disclaimer: Educational/informational only — not financial advice.
📌 #trading #stockmarket #SPY #SPX #Fed #Powell #JOLTS #ConsumerConfidence #CaseShiller #PMI #Dollar #bonds #megacaps
SPY Sep 23 – Bulls Pushing Toward 668–670, Gamma Still in PlayPrice Action & Setup (1-Hour Chart)
SPY has been grinding higher after last week’s consolidation, now trading around 666.7 and pressing the upper end of the short-term channel. Immediate supports line up at 665 and 662, with deeper backup near 657. As long as SPY holds above 665, the structure favors another push to the 668–670 zone.
Momentum Read
MACD remains strongly positive with rising histogram, showing momentum is still alive. Stoch RSI is elevated (near 90), which could lead to short pauses or small pullbacks, but no reversal signals yet.
GEX (Options Flow) Confluence
Gamma exposure is bullish:
* Highest positive GEX / Call resistance: ~668–669
* 2nd Call Wall: near 667
* Next Call Wall: around 670
* Major Put Support: 661 with a secondary wall near 655
Holding above 665 forces dealers to hedge higher, which can keep the squeeze alive toward 668–670.
Trading Plan
* Upside continuation: Enter long on a confirmed hourly close above 667.2. Target 668–670. Stop just below 665.
* Dip buy: A pullback to 665 or 662 that holds on volume can be a low-risk reload.
* Quick short: Only if 661 breaks with heavy volume, aiming for 657 and 655.
Option Angle
Short-dated calls in the 668–670 strike range remain attractive if SPY stays over 665. Protective puts near 661 can work if breakdown signals appear.
Bottom Line
Bulls hold the upper hand as long as SPY stays above 665. A clean push over 667 could quickly extend to 668–670, with gamma hedging likely to assist.
Disclaimer: This is for educational discussion only and not financial advice. Always do your own research and manage risk.

Solving Trading with Math: The Ultimate Pure Math StrategyThis video will be part 1 of using math to solve trading problems.
About this video
This video focuses on day trading using Algebra to determine your target price from opening breakout range.
In the next tutorial, I can show you how to apply this strategy to swing trading.
Overall Purpose
The overall purpose is to show you the actual, real life application of pure mathmatical principles in real life, especially as it pertains to trading.
If you were one of those people who said "I'll never use this math in real life applications", consider yourself corrected :P.
Thanks everyone, hopefully you enjoy and find this helpful!
Safe trades as always.

SPY: Bearish Continuation & Short Trade
SPY
- Classic bearish setup
- Our team expects bearish continuation
SUGGESTED TRADE:
Swing Trade
Short SPY
Entry Point - 663.63
Stop Loss - 664.95
Take Profit - 661.51
Our Risk - 1%
Start protection of your profits from lower levels
Disclosure: I am part of Trade Nation's Influencer program and receive a monthly fee for using their TradingView charts in my analysis.
❤️ Please, support our work with like & comment! ❤️

WHERE IS THE STOCK MARKET PULL BACK? (September 20, 2025)S&P 500 has been on an absolute tear these past five months but we know things can't go straight up forever so in this video we talk about the possibility of where the stock market can pull back and how much longer can we keep pushing?

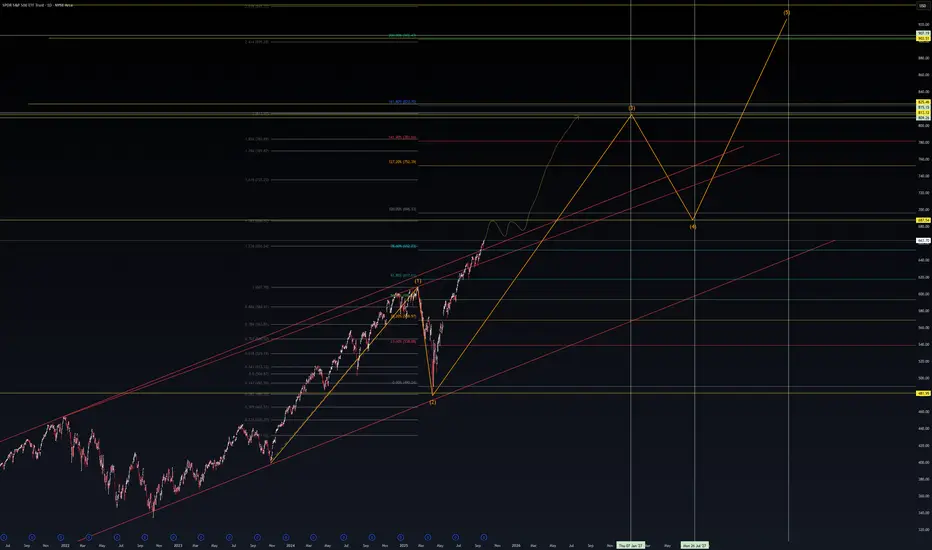
SPY Long-Term Elliott Wave Roadmap📊 SPY Long-Term Elliott Wave Roadmap
SPY continues to respect its long-term bullish channel with clear Elliott Wave structure.
Currently finishing Wave (3) with upside momentum into the 800+ zone.
Expecting a corrective Wave (4) dip toward 680–700.
The final Wave (5) extension projects into the 900+ zone, aligning with major Fibonacci levels.
This roadmap suggests:
✅ Structural bias remains bullish
⚠️ Volatility spikes likely during Wave (4) retracement
⏳ Timeline projects into 2026–2027 for cycle completion
Markets don’t move in straight lines—this is about the macro roadmap.
What’s your take—does SPY see 900+ before the next secular reset?
#SPY #SP500 #ElliottWave #TradingView #Markets
$SPY / $SPX Scenarios — Wednesday, Sept 24, 2025🔮 AMEX:SPY / SP:SPX Scenarios — Wednesday, Sept 24, 2025 🔮
🌍 Market-Moving Headlines
📉 Month-end positioning: Flows light as traders prep for Thursday’s 🚩 GDP + Jobless Claims.
💻 Mega-cap drift: Tech leadership remains central with $AAPL/ NASDAQ:NVDA volatility post-Powell.
💵 Rates + housing: Home affordability narrative continues to weigh on broader risk tone.
📊 Key Data & Events (ET)
⏰ 🚩 10:00 AM — New Home Sales (Aug)
⏰ 4:10 PM — San Francisco Fed President Mary Daly speech
⚠️ Disclaimer: Educational/informational only — not financial advice.
📌 #trading #stockmarket #SPY #SPX #Fed #housing #Powell #economy #Dollar #bonds #megacaps
SPY Sep 22 TA – “Grinding Higher or Ready for a Breather?”
1️⃣ Big Picture on the 1-Hour Chart
* Price action: SPY closed near 663.40, still tracking inside an upward channel. Buyers continue to defend the midline, keeping the short-term uptrend alive.
* Key levels:
* Resistance: 665.1 → 667.5 (recent high and strong call wall)
* Support: 659.5 → 657 (mid-channel & HVL from options data)
* Indicators:
* MACD is positive but flattening, signaling fading momentum.
* Stoch RSI is elevated near 85, which may point to a near-term pause or light pullback.
Overall trend stays bullish but a little extended; a sideways consolidation wouldn’t surprise.
2️⃣ GEX / Options Flow
* Strong call walls at 665–667.5 and a key gamma shelf around 659.5.
* Below, 655 and 650 show heavy put walls, with a large gamma pocket that could accelerate a dip if 657 breaks.
* IVR stands at 13.3, suggesting option premiums remain moderate and potentially attractive for quick strategies.
This options picture supports the idea of SPY chopping between 657 and 665 early in the week unless a fresh catalyst pushes it through 667.
3️⃣ Trading Thoughts & Suggestions
* Scalp / day trade: A clean break above 665–667.5 with strong volume could target 670 and beyond. Tight stop under 663.
* Support bounce: If early weakness brings price toward 659.5–657 and it holds, watch for a rebound back to 663+.
* Fade setup: A hard rejection at 665–667.5 may open a move back toward 657.
4️⃣ Bottom Line
SPY remains in a healthy uptrend, but momentum is slowing. Bulls want to see a sustained move over 667 to keep the rally alive, while bears look for a break below 657 to shift control.
Disclaimer: This is just market opinion for educational discussion. It’s not financial advice. Always manage your own risk before trading.

Let's keep an eye out. Who else is seeing the same thing.
I am a bit worried at how people think this is a great 👍🏾 market. People buying in now wanting to catch some of these gains, its too late. The Fear&Greed Index reading around 63% more Greed 🐷🐖, how?
Some people might be left holding the 🎒 in 2026.
1. Let's pray
2. Take some profits, let the rest ride
3. Look forward a pullback & dollar cost
4. If you got it, hedge/look for shorts
Hope you all had a green 💚 year, give God his glory and give our 10% to charity.
Take care.

Next Leg down startingThe S&P 500 has been trading inside this rising channel for the last 3 and a half years. As you can see it has bounced off the bottom of the rising channel 4 different times and it is now back at the top of the channel. Price action gapped above the channel overnight but immediately sold off pre-market back inside the channel and completely reversed the move despite strong earnings from MSFT and META. This is very bearish and signals a move back down to the bottom of the channel once again and given that its already bounced off the bottom of the channel 4 different times, a 5th hit would have a high probability of breaking below the channel, which I would give a greater than 70% probability of playing out. If this happens, we will see much lower prices in this coming bear market.

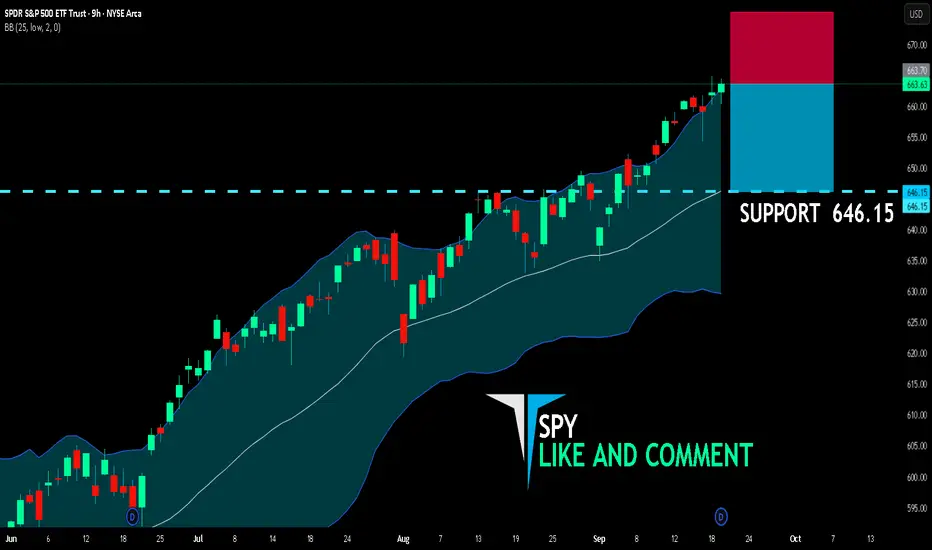
SPY SHORT FROM RESISTANCE
SPY SIGNAL
Trade Direction: short
Entry Level: 663.70
Target Level: 646.15
Stop Loss: 675.36
RISK PROFILE
Risk level: medium
Suggested risk: 1%
Timeframe: 9h
Disclosure: I am part of Trade Nation's Influencer program and receive a monthly fee for using their TradingView charts in my analysis.
✅LIKE AND COMMENT MY IDEAS✅
SPY Trading Opportunity! SELL!
My dear friends,
Please, find my technical outlook for SPY below:
The instrument tests an important psychological level 663.63
Bias - Bearish
Technical Indicators: Supper Trend gives a precise Bearish signal, while Pivot Point HL predicts price changes and potential reversals in the market.
Target - 661.35
Recommended Stop Loss - 664.75
About Used Indicators:
Super-trend indicator is more useful in trending markets where there are clear uptrends and downtrends in price.
Disclosure: I am part of Trade Nation's Influencer program and receive a monthly fee for using their TradingView charts in my analysis.
———————————
WISH YOU ALL LUCK

$SPY / $SPX Scenarios — Week of Sept 22 → Sept 26, 2025🔮 AMEX:SPY / SP:SPX Scenarios — Week of Sept 22 → Sept 26, 2025 🔮
🌍 Market-Moving Headlines
📉 Post-Fed positioning: Traders continue to recalibrate after last week’s cut + SEP; rates & USD tone drive risk.
💻 Mega-cap watch: NASDAQ:AAPL NASDAQ:MSFT NASDAQ:NVDA guidance/AI chatter keeps AMEX:XLK leadership in focus.
🛢️ Energy & FX: Oil swings and a firm dollar remain cross-asset headwinds.
📊 Key Data & Events (ET)
Tue 9/23
⏰ 9:45 AM — S&P Global Flash PMIs (Sep) (Mfg & Services).
Wed 9/24
⏰ 10:00 AM — New Home Sales (Aug).
Thu 9/25
⏰ 🚩 8:30 AM — Initial Jobless Claims (weekly).
⏰ 🚩 8:30 AM — GDP (Q2, Third Estimate).
⏰ 8:30 AM — Durable Goods Orders (Aug).
⏰ 10:00 AM — Existing Home Sales (Aug).
Fri 9/26
⏰ 🚩 8:30 AM — Personal Income & Outlays (Aug) incl. PCE/Core PCE.
⏰ 10:00 AM — UMich Consumer Sentiment (Final, Sep).
⚠️ Disclaimer: Educational/informational only — not financial advice.
📌 #trading #stockmarket #SPY #SPX #PCE #GDP #PMI #joblessclaims #housing #consumer #Fed #Dollar #oil #megacaps
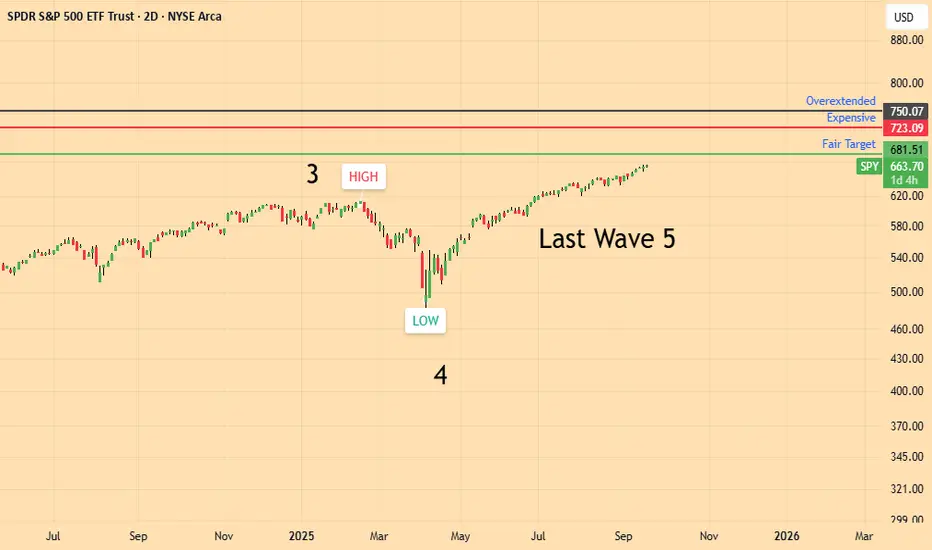
SPY still bullish but this is the last moveGiven the High in Feb25 at 619.22 ; the Low in Apr25 at 481.8, we have the following Fibon* extension targets
Target 0.382 = 681.51 Fair
Target 0.618 = 723.09 Expensive
Target 0.764 = 750.07 Overextended
In case SPY reaches 750.07 and declines afterwoods the correction can reach :
Target 0.618 = 570.55 Oversold
Target 0.382 = 633.38 Fair
In case SPY reaches 723.09 and declines afterwoods the correction can reach :
Target 0.618 = 562.63 Oversold
Target 0.382 = 619.20 Fair
SPY is likely to reach 681.51 in this Wave which we label Elliott Wave 5
Given the fair targets of the upcoming corrections at 633.38 or 619.20 it makes little sense to buy, unless one seeks to catch the latest upward move
It is not possible to predict how long this wave with last and how much time it will take to reverse
*calculated with the natural logarithms of datas
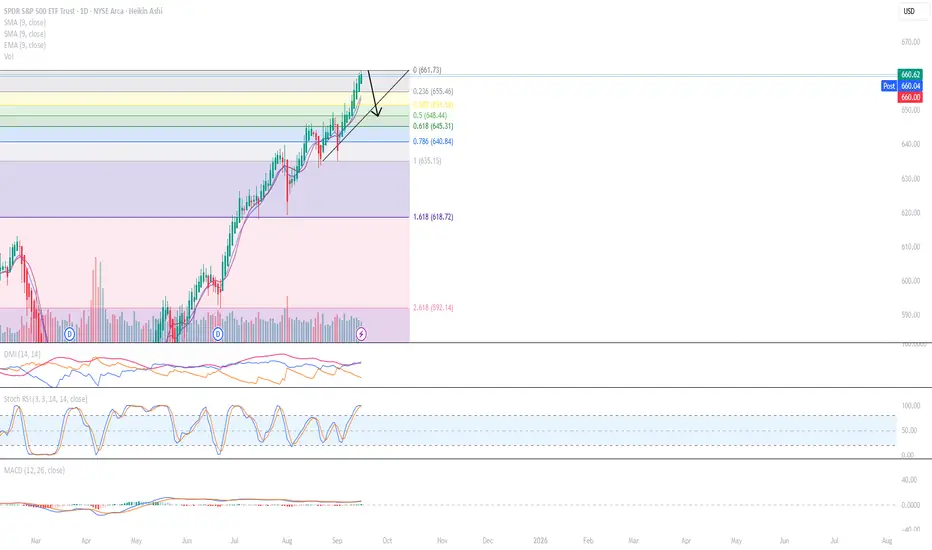
SPY Daily Analysis – Sept 15, 2025📊 SPY Daily Analysis – Sept 15, 2025
SPY has completed a measured move into the premium zone. The question now: Does the correction start here, or will it extend after the next macro wave?
🔑 Key Observations:
Price has pushed into a premium supply zone after a strong impulsive run.
The measured move aligns with potential overextension levels, signaling exhaustion.
First correction target sits around 619 (−6.3%), with further downside imbalances below.
Macro structure still bullish overall, but short-term risk of correction is increasing.
Volume profile shows fading momentum as we enter this zone.
⚠️ Scenarios:
Correction begins here → quick retrace to 640 → 619.
Macro wave extends → delayed correction, targeting higher channel resistance first.
📉 Bias: Neutral → Bearish (waiting for confirmation).

July 2026 is a peakAfter both financial crashes from 2008 and COVID the money printer got turned on. We trade in a channel before breaking out. We are in a channel now. Using Fibb I'm predicting when we breakout of this channel. July 2026

SPY Fly or Die Looks like Q1 2024 is going to be a pivot point. Looking at the weekly tf, The price action curve has stayed consistent over the years. Im not a big fan of alot of indicators but we can see the bullish pressure building and bump and run pattern forming, Measured move from prior LL to Prior HH giving us a target of 700. Also 127 fib ext.
I would love to see the curve tested one more time but if there is a strong break to the top side Im going long on spy
please share your thoughts

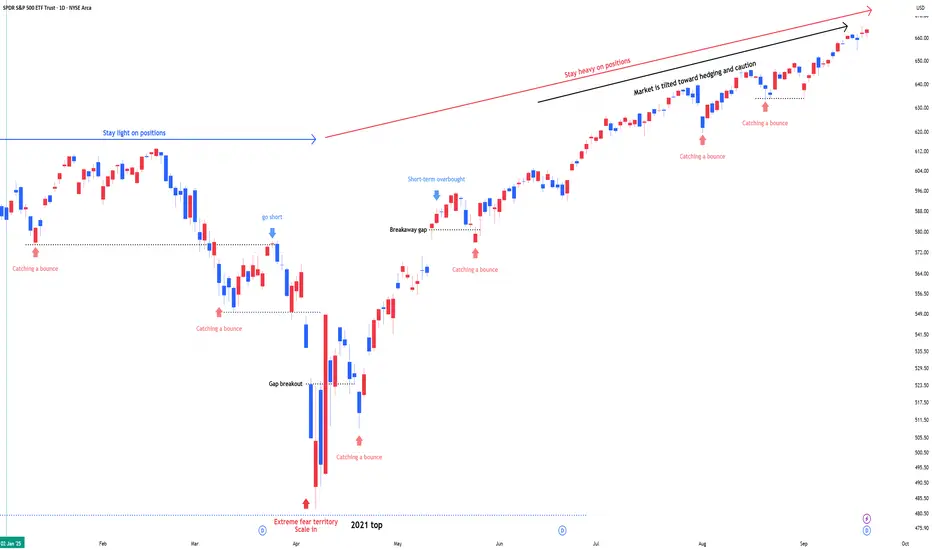
SPY : Stay heavy on positions (2x leverage)- System metrics show the market transitioning into the initial phase of overheating.
In stay light on positions zones, I hold SPY(+QQQ) and reduce exposure.
In stay heavy on positions zones, I increase allocation using a mix of SSO(+QLD) and TQQQ.
** This analysis is based solely on the quantification of crowd psychology.
It does not incorporate price action, trading volume, or macroeconomic indicators.
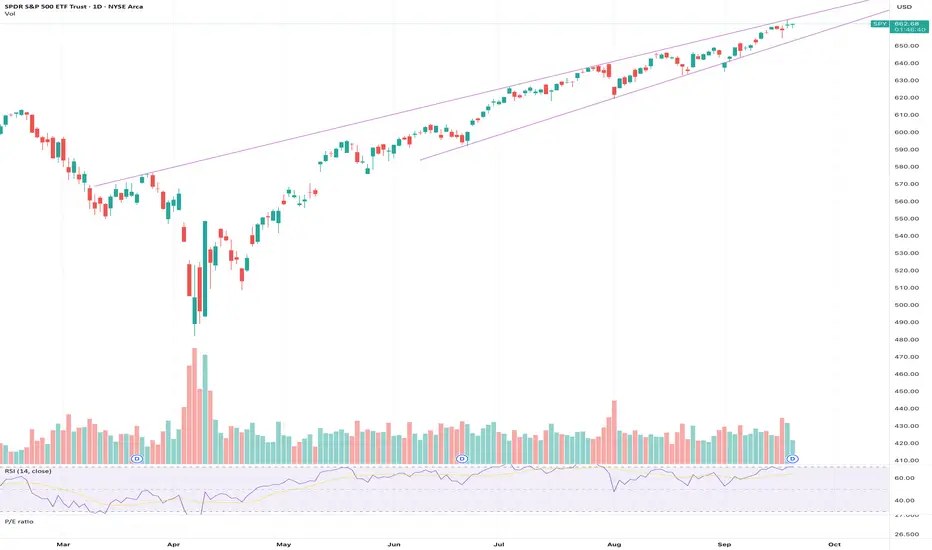
SPY Top of RangeThe index kissed the top of it's 6-month ascending triangle range. With the big news this week for investors being what will the fed do with rates we've seen investors eagerly assume that several more cuts are baked in this year and early next.
While more cuts are most certainly on the way, the real question is if the market is overly optimistic to the tune of being deaf toward any form of downside news. Will cuts lead to inflation? Will inflation cause a greater pinch on Main Street that eventually bleeds into Wall Street? Will Russia "accidentally" attack Poland? Will Trump decide to raise Tariffs on China, Mexico or Canada again? The likelihood of something in the geo-political spectrum happening is fairly high and with many leading equities already stretching their P/E to absurd heights (thank you AI) the potential upside from here is much lower than the potential downside, or at least the risk-off side.
All it takes is one article from a Mag7 insider to say that they are trimming GPU purchases by 50% to curtail costs to match revenues and this turkey is goosed.
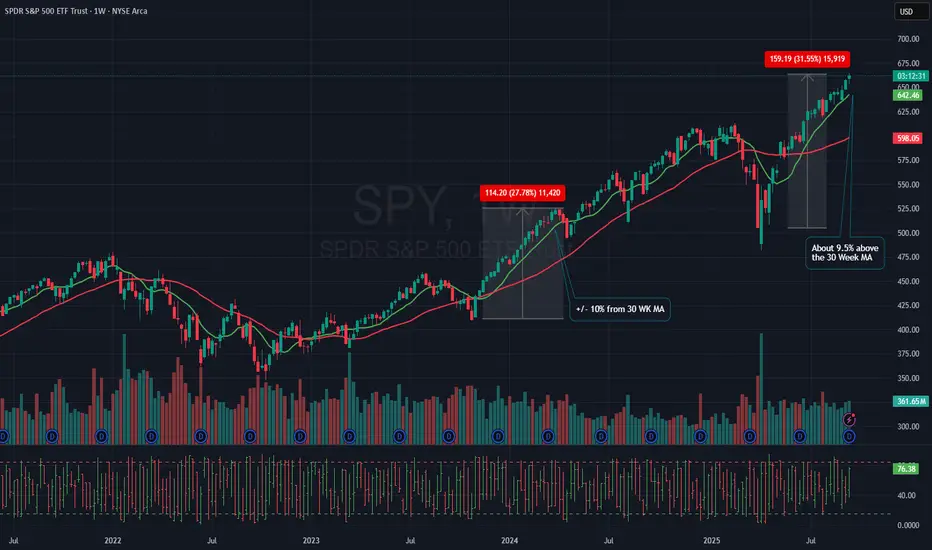
Potential $SPY Pullback AnalysisOverview
This section examines the possibility of a pullback in SPY, based on recent price movements and historical trends.
Current Price Stretch Relative to Moving Average
SPY is currently trading approximately 9.5% above its 30-week moving average. This level of extension is notable, as it approaches the threshold observed during previous pullbacks.
Historical Context
Looking back, the last significant instance when SPY was stretched about 10% above its 30-week moving average resulted in a pullback toward the end of March 2024. This comparison provides context for the current market situation.
Observational Note
It is worth noting that a confirmed closing price for the current week has not yet been established. This analysis is not a prediction, but rather an observation intended to increase awareness of market conditions.
$SPY / $SPX Scenarios — Friday, Sept 19, 2025🔮 AMEX:SPY / SP:SPX Scenarios — Friday, Sept 19, 2025 🔮
🌍 Market-Moving Headlines
📉 Week-end positioning: Traders de-risk after a heavy Fed + macro week; watch flows into bonds and equities.
💬 Consumer & labor narrative: Markets digest Fed messaging alongside claims + LEI signals.
🌐 Global spillover: Europe and Asia equities feed into U.S. tone with light U.S. catalysts on deck.
📊 Key Data & Events (ET)
⏰ 10:00 AM — State Employment & Unemployment (Aug)
⚠️ Disclaimer: Educational/informational only — not financial advice.
📌 #trading #stockmarket #SPY #SPX #Fed #Powell #labor #economy #bonds #Dollar #risk
Hitting the 50% Fibinocci in the next few days ...There will be a brief retracement in the next few days until Sept 22. I suspect it will hit the 50% fib but realistically it could hit any one of the other fib lines.
The reason I am thinking it will retrace is due to the indicators looking bearish, especially on the 4 hour indicators, etc.
This is just a brief retracement lasting a few days and the SPY will continue to go up after.
Always have stops in place and only use 10% or less of your trading account.