About Vanguard 500 Index Fd Admiral Shs
Related stocks
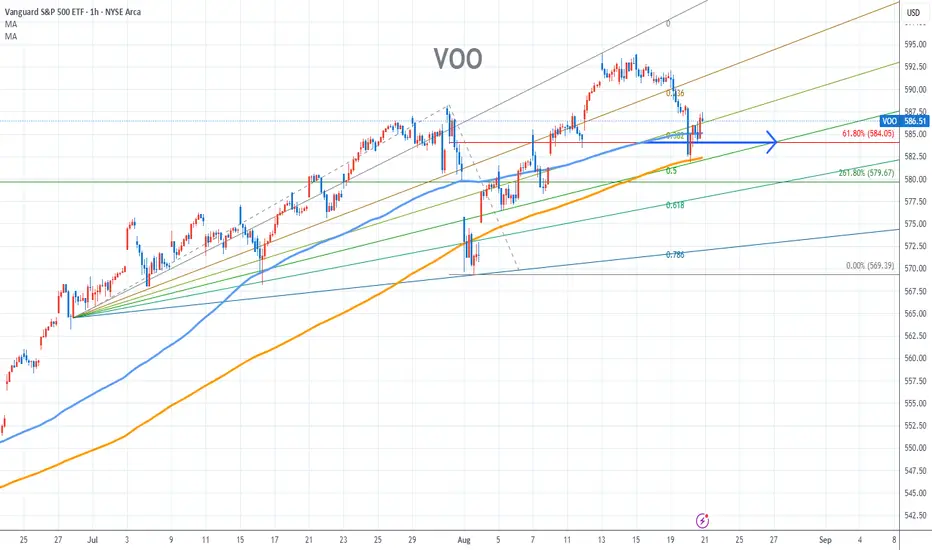
VOO Stock Chart Fibonacci Analysis 082025Trading Idea
1) Find a FIBO slingshot
2) Check FIBO 61.80% level
3) Entry Point > 584/61.80%
Chart time frame:B
A) 15 min(1W-3M)
B) 1 hr(3M-6M)
C) 4 hr(6M-1year)
D) 1 day(1-3years)
Stock progress:A
A) Keep rising over 61.80% resistance
B) 61.80% resistance
C) 61.80% support
D) Hit the bottom
E)
13-F Filings are Comming!!Can't wait to see who actually bought the dip, 13-F filings are coming up next week and ill be watching to see, who are the pessimists?, who made money off the drop?, and most important did Mr. Buffet go shopping yet?
We buy dips,
LLR


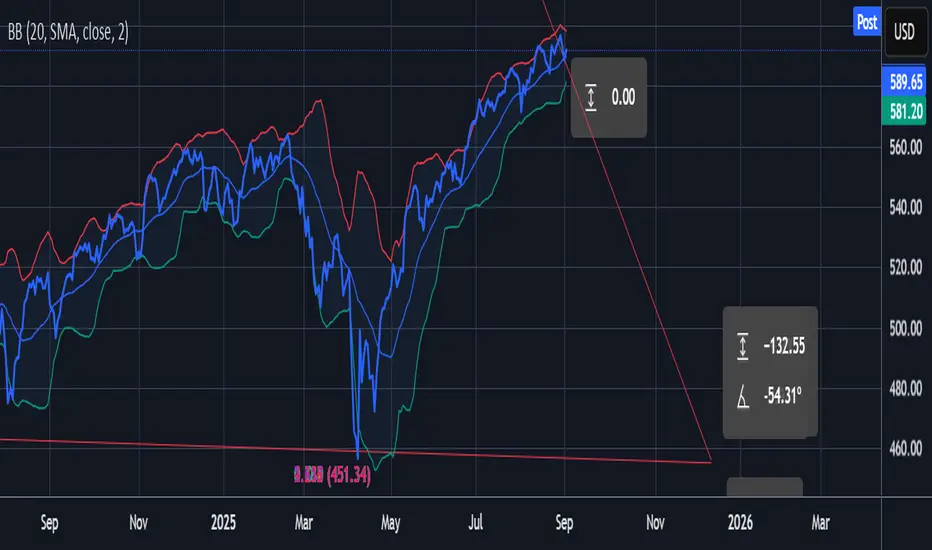
$VOO going down ?As you know the stock market and the cryptocurrency market correlates together, so it wouldn’t be wrong to look for a bear perspective because in the cryptocurrency market, we can currently see BTC trending down on the monthly. So if Bitcoin goes down the stock market will also go down so this is my

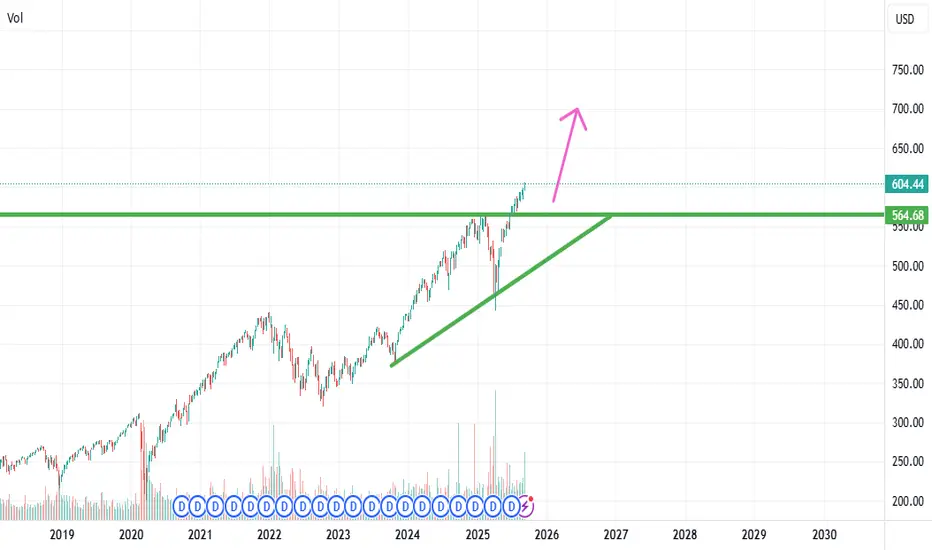
VOO TRACKS EVERYTHING THAT IS TRADED IN THE USA.I AM IMPLYING THAT THE MARKETS WILL RALLY VERY HARD.
The Impact of Tariffs and Monetary Policy on VOO and the U.S. Economy
The Vanguard S&P 500 ETF (VOO) has been experiencing significant growth, mirroring the strength of the U.S. economy and the shifting landscape of global finance16. This upwar

The Vanguard S&P 500 ETF (VOO)As of January 25, 2025, VOO is trading at $559.01, reflecting a slight decrease of 0.296% from the previous close.
Analyst Projections for 2025
Analysts have provided various forecasts for VOO's performance in 2025. According to a report from December 2024, the average projected price for VOO in 2

Next 4 Year OutlookAs I types this we are Six days away from the inauguration of President Donald Trumps Second Term. His threats to impose 25% Tariffs on his NA allies, Canada and Mexico looms over (if I were a betting man, Loose air). Besides the matter, I still hold the ideology, that the United States will remain

VOO at Major Resistance. VOO at Major Resistance. Good profit take or hedge. I expect volatility at this level.

See all ideas
Displays a symbol's price movements over previous years to identify recurring trends.