WHEATWheat presents a favorable buying opportunity, as it has established a well-defined support level. The stability observed at this price zone indicates reduced downside risk and provides a strong foundation for potential upward momentum.

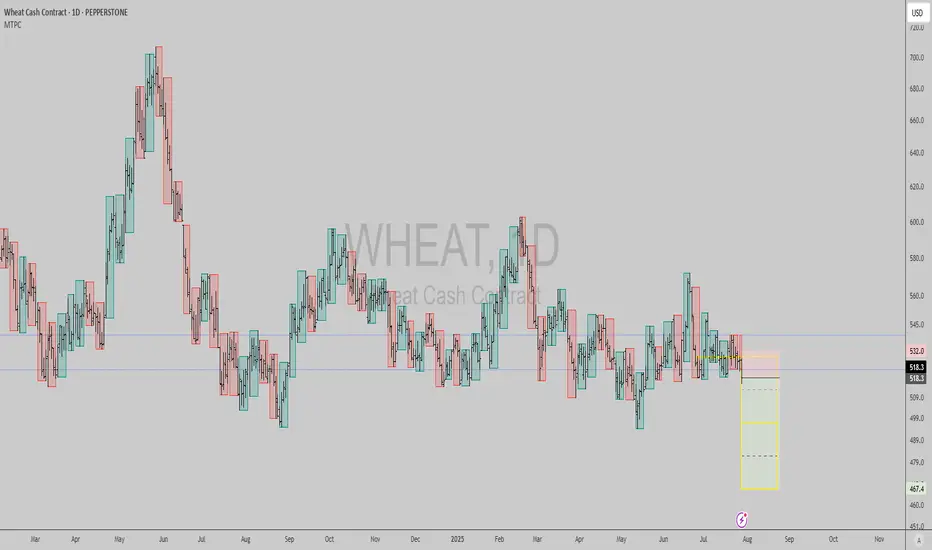
WHEAT: Short signal amidst Russia/Ukraine truce deadlineThe market seems to be pricing in a possible truce between Ukraine and Russia, since Trump gave Russia a 2 week deadline to achieve it or risk further sanctions. The technical chart has a picture perfect short signal in the daily timeframe with good reward to risk here.
Best of luck!
Cheers,
Ivan
Wajani Investments: Wheat analysisWheat has formed a very strong Head and Shoulder with a bearish wedge or descending triangle . This can be seen from both monthly, weekly and daily timeframes. All these points to lower prices in the weeks ahead. In this market you can risk a 1:3
Remember to always adapt or make changes as t

Wheat should go to 540 then target 610Daily chart,
The commodity WHEAT - cash contract - PEPPERSTONE:WHEAT is trading in a soft rising channel (yellow), and the price should test the line R1 at around 540 - After crossing, the target will be towards the channel upper line R2, around 610 , passing through the resistance levels 550

WHEATIn April/May, wheat harvests occur in the eastern part of the globe. India has banned wheat exports since 2022 in order to replenish domestic reserves. Subsidies for farmers have meant that the sowing area is larger than usual, which translates into quite high expectations when it comes to harvests.

WHEAT - Bullish TrendTechnical Analysis:
- WHEAT is breaking out neck after Bullish Divergence, Double Bottom reversal pattern formed, will it move towards its target?
Fundamental Analysis:
- COT report is also in favour of this trade.
Seasonality:
- Bullish from last week of January.

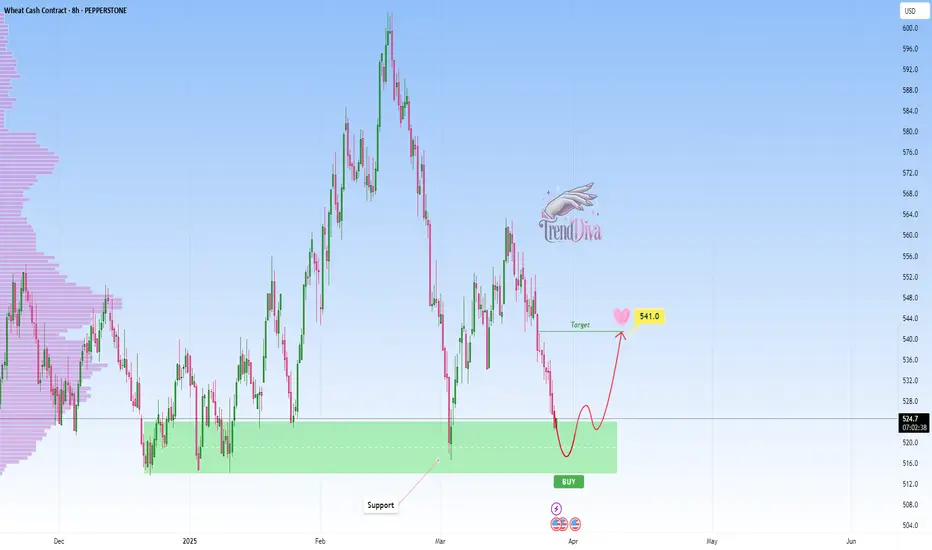
WHEAT at Key Support Level - Will Price Rebound to 541$?PEPPERSTONE:WHEAT has reached a major support level, an area where buyers have previously shown strong interest. This area has previously acted as a key demand zone, increasing the likelihood of a bounce if buyers step in.
A bullish confirmation, such as a strong rejection pattern, bullish engulfi
Global Wheat Market: Lower Production and Trade AdjustmentsAs outlined in the March WASDE report , the global wheat market is undergoing significant shifts due to production declines, lower trade volumes, and changing stock levels. These factors are expected to shape pricing and investment strategies in 2025.
Global Production and Stock Adjustments
The

WHEAT Approaching Key Support - Will Price Rebound to 550$?PEPPERSTONE:WHEAT is approaching a key support level, an area where buyers have previously shown strong interest. The recent bearish movement suggests that price may soon be testing this level, potentially setting up for a rebound.
A bullish confirmation, such as a strong rejection pattern, bullis

WHEAT is in bearish trendthe price is simply following the DOW theory as soon as the bearish divergence appeared on the RSI trend shifted and started to make LHs and LLs. I have also placed a short position on the chart as it will be our sell stop order

See all ideas
Displays a symbol's price movements over previous years to identify recurring trends.