WTI long or short?Personally i don't see the short becuase we are on a huge buying range, which means that if the market really wants to go down will have to work. Not only that but also they already tried to push the market down that the process failed when buyers stepped in around the 62s.
Anyway, on 4h im seeing how the first time that it got to 62 the buyer appeared aggresively and the second time they literally stopped the market from continue falling. According to what i have said, it is possible to project potential purchases once it breaks 64.192 however, we have to be sure that it is a high quality brea (all the mases can see it and are already in) After that, it is as simple as waiting for a shakeut (wait until they have created liquidity and reclaimed 64.192) after that the market is very likely to go to 65.349. if im correct, i will cover at least 60-70% or more because ill be going against a huge wall and we might still be on AB or already an internal process of D. Lets see
WTI trade ideas

Boring oilHonestly, even if you analyze oil just once a month and then come back to the chart the next month, you wouldn’t miss anything — the chart is that repetitive. For months now, the price has been fluctuating between \$63 and \$61. So for now, we won’t be posting any more oil analyses until a new conflict in the Middle East happens that could push the price higher. ✅

USOIL PUMP ?Usoil Pump Soon
Starts Bearish Channel Then Its Fill The Demand Zone Then A Possible Look For Long Trade
Compression Buy Setup
Best Of Luck With Your Trading 🤞
Follow Us For More
Oil gains amid geopolitical risks, supply outlookOil gains amid geopolitical risks, supply outlook
Oil rose in early trade as markets weighed rising geopolitical tensions against forecasts of oversupply. Trump warned of major sanctions on Russia and urged allies to impose steep tariffs on China and India for buying its crude, while Ukraine’s drone strikes on Russian refineries added to risks.
Goldman Sachs expects oil to trend lower next year on strong supply growth but says prices may rebound sooner if inventories peak or OPEC cuts output. The bank now sees Brent in the low $50s and WTI near $50 by end-2026.

USOIL ShortAfter a long consolidation. We see minor pullbacks and these are places to start shorting.
AMEX:UCO is an ETF that can be used for exposure!

Crude oil - DAILY- 15/09/2025Oil prices extended last week’s gains as traders weighed rising geopolitical risks against forecasts of a surplus later this year. US President Donald Trump renewed pressure on Europe to cut Russian oil purchases and floated sanctions if NATO allies comply, while the US is also pushing G7 partners to impose tariffs on China and India for buying Russian crude.
Market sentiment remains shaped by escalating tensions, including Israeli strikes in Qatar and Ukrainian drone attacks on Russian refineries. Analysts warn that sanctions and infrastructure damage could push prices higher in the short term, but expectations of a supply overhang and OPEC+ production increases keep downside risks in focus.
On the technical side, the price of crude oil has retested the major support area of $62 and has since rebounded to the upside. The Stochastic oscillator is back in neutral levels for the time being, hinting that the recent bullish correction could project into the near short term while the Bollinger bands are sufficiently expanded, showing that there is volatility to support any short-term spikes.
Disclaimer: The opinions in this article are personal to the writer and do not reflect those of Exness

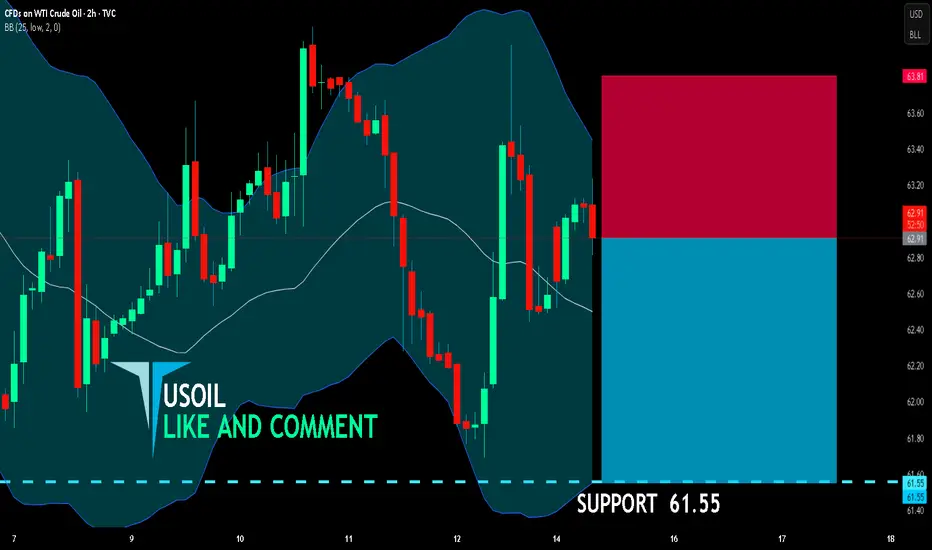
USOIL BEARISH BIAS RIGHT NOW| SHORT
USOIL SIGNAL
Trade Direction: short
Entry Level: 62.91
Target Level: 61.55
Stop Loss: 63.81
RISK PROFILE
Risk level: medium
Suggested risk: 1%
Timeframe: 2h
Disclosure: I am part of Trade Nation's Influencer program and receive a monthly fee for using their TradingView charts in my analysis.
✅LIKE AND COMMENT MY IDEAS✅
USOIL Long term outlookStill bearish short term, but stocks like GTE may be a strong buy at the MA support.
OIL will dump in the future as alternative fuels take its place or another economic standstill occurs i.e. pandemic v2 (ty bill gates), but then I expect OIL to pump from that low once it has been reached
Not financial advice

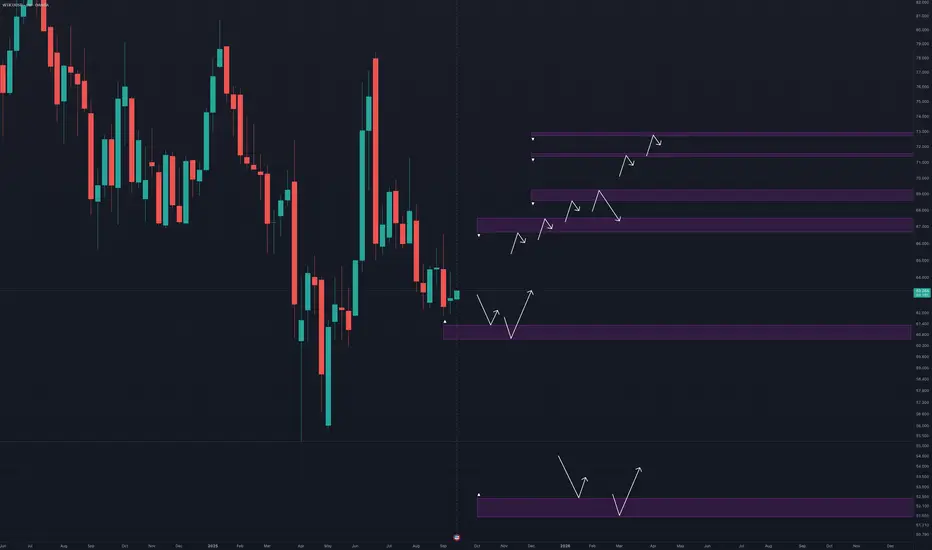
WTI 4HTrading Outlooks for the Week Ahead
In this series of analyses, we review short-term trading outlooks and perspectives.
As can be seen, in each analysis there is a key support/resistance zone close to the current price of the asset. The market’s reaction to or breakout from these levels will determine the next price movement toward the specified targets.
Important Note: The purpose of these trading outlooks is to highlight critical price levels ahead and the market’s potential reactions to them. The analyses provided are by no means trading signals!

USOIL: Strong Bullish Sentiment! Long!
My dear friends,
Today we will analyse USOIL together☺️
The in-trend continuation seems likely as the current long-term trend appears to be strong, and price is holding above a key level of 62.548 So a bullish continuation seems plausible, targeting the next high. We should enter on confirmation, and place a stop-loss beyond the recent swing level.
❤️Sending you lots of Love and Hugs❤️

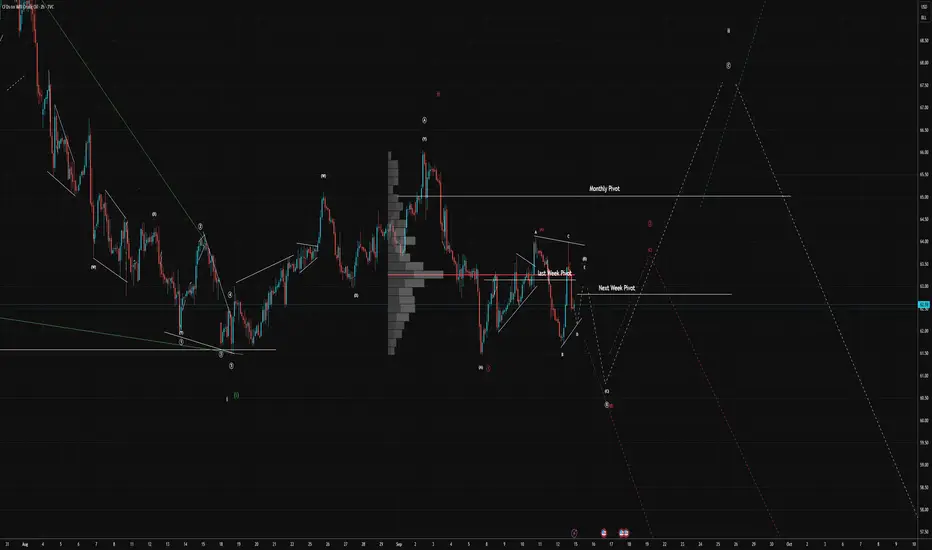
Oil Analysis: Testing Lows Before a Bounce?Price remains below key resistance levels and the monthly Point of Control (POC). I think within the next week, we could see the lows taken out, which would then be followed by a bounce.
The key question is whether the wave (ii) correction (red scenario) is complete, or if we are poised for another rally toward $67/bbl.
For now, we are maintaining careful short positions. Fading the trend at the potential end of a wave is generally a fool's errand; I've even added it to my rulebook as a hard taboo.
The slightly longer-term chart suggests another potential scenario in green.
USOIL Is Very Bullish! Buy!
Here is our detailed technical review for USOIL.
Time Frame: 1D
Current Trend: Bullish
Sentiment: Oversold (based on 7-period RSI)
Forecast: Bullish
The market is testing a major horizontal structure 62.543.
Taking into consideration the structure & trend analysis, I believe that the market will reach 70.257 level soon.
P.S
Please, note that an oversold/overbought condition can last for a long time, and therefore being oversold/overbought doesn't mean a price rally will come soon, or at all.
Disclosure: I am part of Trade Nation's Influencer program and receive a monthly fee for using their TradingView charts in my analysis.
Like and subscribe and comment my ideas if you enjoy them!

Downtrend in oilThe price of oil is completely bearish and the numbers $66 and $65 are suitable for opening a sell position.

USOIL might be the next commodity to be on the look out of!USOIL is still yet anticipated to fulfill the completion of its bearish structure, before it could breverse to the bullish side!
Crude Oil (USOIL) – Long SetupOil is currently trading around $63.20 and has formed a clean ascending structure, pushing into the breakout zone. Price is respecting the trendline well and is consolidating just below the EMA cluster – a breakout could be next.
We're currently in a narrow entry zone where bulls may gain control if we see a clean break above the local resistance range.
Trade Setup:
Entry: within the purple box (current zone)
Stop Loss: $62.60 just below the trendline – invalid if broken
Breakout Confirmation: clear candle close above $63.45
Targets:
T1: $63.70
T2: $64,60
Why Long?
Trendline support is holding – price has been bouncing cleanly off the rising line.
Momentum building – repeated tests of resistance without strong rejection.
EMA cluster as magnet – price may want to retest and potentially break through the EMA zone sitting above.
Summary:
Crude oil is coiling tightly just below resistance and trendline support is holding strong.
If we get a push above the breakout zone, I expect follow-through toward T1 = $63.70 and T2 = $64.60
Setup becomes invalid if the ascending trendline breaks clearly to the downside.
No financial advice – just how I see the chart.

Crude oil tests the key resistance areaWe’ll start our review with Crude oil: the price consolidates around the dynamic resistance area of $63-64, and may try to retest it again before starting another downswing. The sentiment for Crude oil in particular and for energy assets in general remains muted (though, stocks of the energy sector display modest gains).
According to supply/demand estimation from eia.gov, pressure for Crude oil futures will increase in the fourth quarter of 2025, so the sentiment remains bearish, which is also confirmed by the price action.
Don't forget - this is just the idea, always do your own research and never forget to manage your risk!

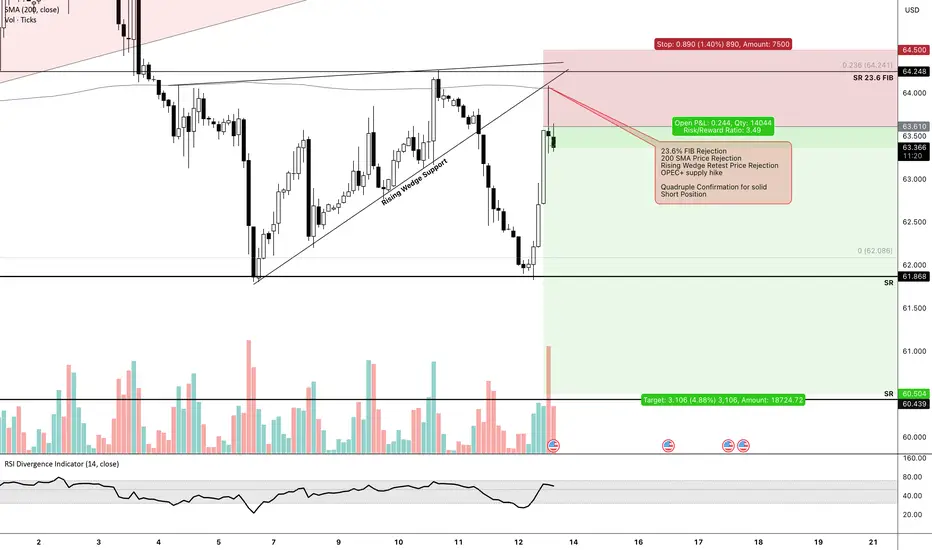
OIL Trade Setup - September 12th📲 NFX TRADE ALERT – Swing Setup
💹 Instrument: Crude Oil GBEBROKERS:USOIL
🛒 Trade Type: Swing – Sell at Market
📍 Entry: $63.60
⛔ Stop Loss: $64.50
✅ Target Profit: $60.50
📊 Trade Setup Analysis – GBEBROKERS:USOIL
🔻 23.6% FIB rejection
🔻 200 SMA rejection
🔻 Rising wedge retest rejection
🔻 OPEC+ supply hike
That’s quadruple confirmation supporting a solid short position.
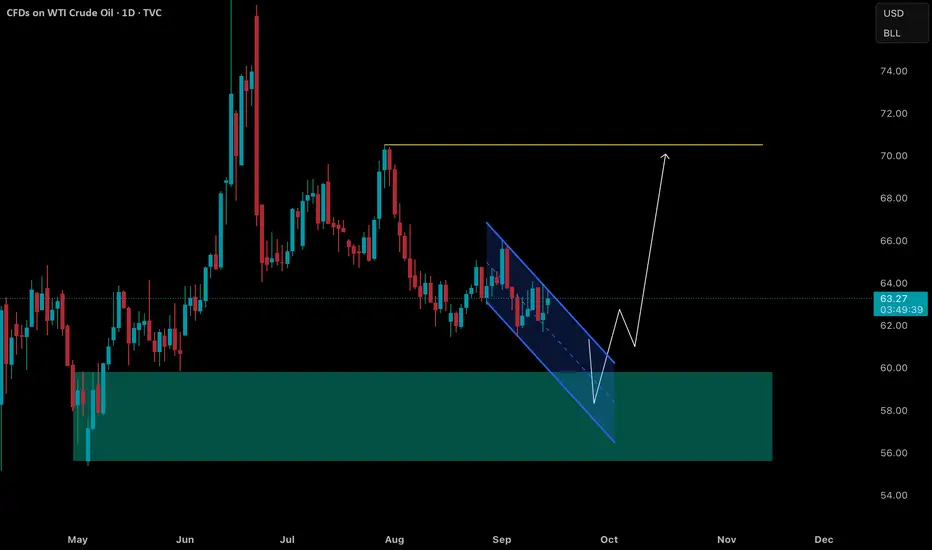
WTI Crude Oil – Falling Wedge Near Demand ZoneWTI is approaching a strong demand zone around $60–$61 while forming a falling wedge pattern.
A bullish breakout from this structure could trigger a move toward $68–70 in the coming weeks.
🔑 Key Levels:
Support: $60–61 (demand zone)
Resistance: $68–70 (target zone)
⚠️ This is technical analysis, not financial advice. Always manage risk accordingly.

Oil bullish for 3rd waveOil could be breaking for long bull trend
The bottom for ABC correction is 62% retrace for previous long term trend.
sorry for labeling errors in charts... but you'll get the idea.

Analysis review on oilIf the Middle East were a more stable region, the fair price of oil should be around **\$45**.
The market is inclined to move toward that level, but the ongoing and escalating unrest in the Middle East is preventing it.
In any case, my analysis remains the same as the previous one on oil, with no changes.

Oil trade 40%?Could be a nice trade. Or it is a wave 3 or a wave C. If its a C just count 5 waves up and then go short. If its a wave 3 itll bash to the upside.

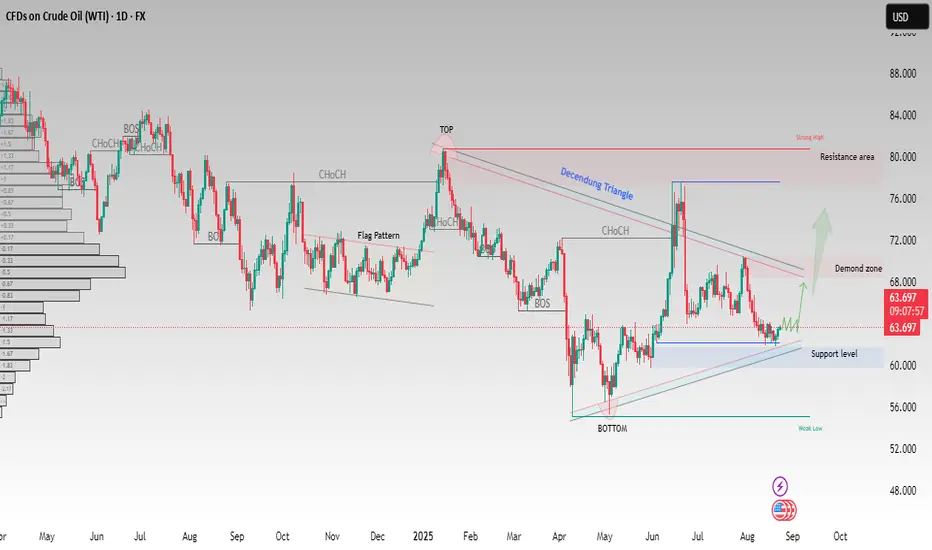
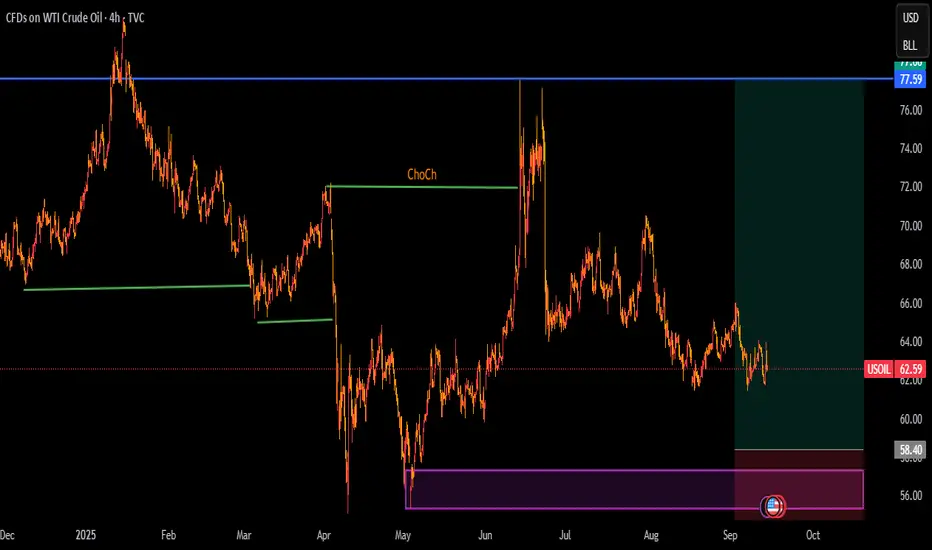
USOIL(WTI) – Demand Zone Tested,Potential Bullish Reversal AheadCrude Oil (WTI) is showing signs of strength after respecting the support level near $60–62 and forming a clear demand zone. Price has been consolidating within a descending structure and is now attempting to push higher.
Key observations:
✅ Support level held strongly near $60.
✅ Multiple Change of Character (CHoCH) signals indicating momentum shift.
✅ A potential breakout above the descending triangle may open the path toward the $70–72 demand zone.
📈 If bullish momentum continues, next targets lie around $76–80 resistance area.
On the downside, a break below $60 would invalidate the bullish setup and expose a move toward $56–54.
This structure highlights a possible trend reversal from the bottom toward higher levels, as long as buyers maintain control above support.
This analysis is for educational purposes only. It is not financial advice. Please trade responsibly and manage your risk